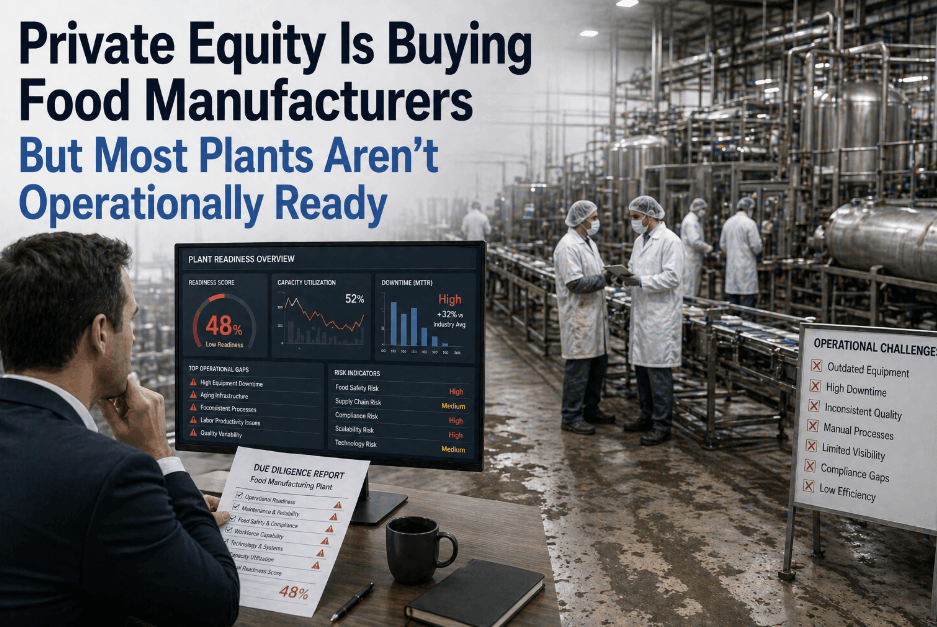
Private equity acquisitions in food manufacturing are accelerating. But behind the deal memos and valuation models lies a hard operational truth: most acquired plants are not ready for the performance targets embedded in PE investment theses. Outdated equipment, fragmented production data, deferred maintenance backlogs, and absent manufacturing intelligence software create a compounding risk that no financial restructuring alone can resolve. For PE-backed food manufacturers,operational readiness is not a post-close consideration — it is the determinant of whether the investment thesis survives contact with reality.
Is Your Acquired Plant Operationally Ready to Deliver PE Returns?
iFactory's industrial analytics platform gives PE operating partners and portfolio company leadership real-time asset performance visibility, cross-facility KPI benchmarking, and predictive maintenance intelligence — purpose-built for food manufacturers under acquisition pressure.
Why PE Investment Theses Break Down on the Plant Floor
Private equity firms model food manufacturing acquisitions on EBITDA expansion through yield improvement, throughput gains, and cost reduction. What the models rarely capture is the operational debt hidden inside plant infrastructure. When operating partners conduct operational due diligence at a surface level — reviewing financials rather than asset condition data — they inherit a risk profile that is invisible until the first major unplanned downtime event.
The pattern repeats across portfolio after portfolio. A food manufacturer with solid top-line revenue and acceptable margins conceals a maintenance backlog that has been deferred through three ownership cycles. Equipment reliability is managed reactively. Production monitoring software, if it exists at all, operates at the line level with no enterprise aggregation. The moment PE ownership accelerates production targets, deferred risk converts to realized downtime — and EBITDA projections immediately fall behind schedule. Operating partners who Book a Demo with iFactory typically discover that their plant-level data gaps are larger — and more costly — than their pre-close assumptions.
Deferred Maintenance Backlog
Sellers managing to EBITDA suppress maintenance spend in the 18–24 months before a transaction. The resulting asset degradation is invisible in financial statements but immediately visible in production performance analytics post-close.
Absent Manufacturing Intelligence
Most acquired food plants lack manufacturing intelligence software capable of producing the cross-facility KPI benchmarking PE operating partners need to govern a portfolio. Leadership navigates with anecdotal plant manager reports — not data.
Non-Standardized OEE Definitions
Portfolio companies acquired from different ownership histories report OEE using incompatible definitions. Without a unified industrial analytics platform, portfolio-level benchmarking produces misleading comparisons and misallocated capital.
Compliance Infrastructure Gaps
Acquired food manufacturers frequently carry undisclosed FSMA compliance gaps — manual documentation processes, incomplete traceability records, and site-level audit preparation that cannot scale to PE portfolio governance requirements.
What a Real Manufacturing Risk Assessment Reveals Before and After Close
Operational readiness assessment in food manufacturing goes beyond facility walkthroughs. A rigorous manufacturing risk assessment quantifies asset health, maintenance backlog cost, production throughput variance, quality deviation frequency, and compliance documentation completeness — all against the performance targets embedded in the acquisition model. The gap between projected and actual operational capacity is where PE returns erode fastest.
Operational Due Diligence: The Questions Financial Models Don't Ask
Standard financial due diligence captures revenue concentration, customer contracts, and working capital dynamics. It does not capture the condition of critical processing equipment, the frequency of unplanned line stoppages, or the accuracy of maintenance records. PE firms that integrate operational due diligence tools into their pre-close process — including industrial IoT monitoring of key assets — consistently identify value at risk that adjusts purchase price or informs day-one remediation planning. The ones who skip this step discover the same issues six months post-close, without the negotiating leverage to address them.
Day-One Operational Baseline: Establishing the True Performance Floor
The first 90 days post-close are the highest-leverage window for operational transformation. Establishing an accurate production performance analytics baseline — real OEE by line, actual downtime cost by asset, true yield variance by SKU — gives PE operating partners the data foundation for every improvement initiative that follows. Without this baseline, improvement programs target the wrong constraints and generate marginal returns. Operating partners who Book a Demo during the first 60 days post-close routinely compress their baseline-setting timeline from quarters to weeks.
Enterprise Asset Management as a PE Value Creation Tool — Not Just a Maintenance Function
Most acquired food manufacturers treat asset management as a plant-level maintenance function. PE operating partners who have compounded returns across multiple food manufacturing investments understand it differently: enterprise asset management is a portfolio-level value creation lever that determines whether throughput targets are achievable, downtime costs are containable, and exit multiples are defensible.
Predictive Maintenance Software: Converting Asset Risk Into a Managed Variable
Reactive maintenance in an acquired food plant means every equipment failure is a surprise with an unknown cost. Predictive maintenance software powered by industrial IoT monitoring converts asset degradation from a hidden risk into a visible, schedulable event. For PE portfolio companies, this transforms the maintenance function from a variable cost center with unpredictable spikes into a managed operational process with forecastable expenditure profiles. Operating partners who deploy predictive maintenance software across portfolio plants within the first 12 months consistently report 50–67% reductions in unplanned downtime events — a direct EBITDA contribution that compounds through the hold period.
Cross-Portfolio Asset Analytics: Seeing Risk Before It Becomes Downtime
A bearing degradation pattern appearing at three portfolio plants within 60 days is a fleet-level signal — but only PE operating groups with a unified industrial analytics platform can see it as such. Without cross-facility asset performance management, each failure is an isolated event. With it, the same pattern triggers a coordinated procurement and scheduling response across every affected facility simultaneously — eliminating the sequential failure cycle that erodes PE returns plant by plant. Operating partners ready to establish this fleet-level view can Book a Demo to receive a portfolio-specific asset risk assessment.
| Asset Management Maturity | Reactive (Typical Acquired Plant) | Predictive (Post-Platform Deployment) | PE Portfolio Impact |
|---|---|---|---|
| Failure Detection | Post-failure, during production | 14–21 days pre-failure via IoT sensor trending | Downtime events reduced 55–67% |
| Maintenance Planning | Emergency reactive scheduling | Condition-based, integrated with production schedule | Maintenance labor cost reduced 28–34% |
| Parts Inventory | Excess safety stock or emergency procurement | Demand-signal-driven procurement aligned to failure predictions | Inventory carrying cost down 22% |
| Cross-Portfolio Visibility | None — per-plant reporting only | Fleet-level asset health dashboard, all portfolio plants | Coordinated risk response across all facilities |
| EBITDA Contribution | Unpredictable, downside-skewed | Forecastable, improvement-trajectory mapped | $1.2M–$3.8M annual impact per plant |
Digital Transformation in Manufacturing — The PE-Relevant Sequencing Most Operating Partners Get Wrong
Digital transformation in food manufacturing is not a single initiative — it is a sequenced capability build that must be aligned with PE hold period economics. Operating partners who attempt to deploy full manufacturing intelligence software stacks simultaneously across multiple portfolio plants routinely encounter integration delays, data quality failures, and operator trust erosion that set transformation timelines back by 12–18 months. The correct sequence prioritizes data infrastructure before analytics activation, and analytics before advanced automation.
Operational Readiness Assessment and Data Infrastructure Audit
Conduct an asset-level operational readiness assessment across all portfolio plants. Audit existing MES instances, sensor networks, and ERP data streams. Establish a validated enterprise data historian that normalizes production data into a single schema — the prerequisite for all performance analytics that follow.
Production Performance Analytics and Predictive Maintenance Activation
Deploy the enterprise analytics dashboard with standardized cross-facility KPI views. Activate predictive maintenance software modules across all instrumented assets. This phase delivers the operational visibility that enables PE governance — moving from anecdotal plant manager reports to real-time production performance analytics.
Manufacturing Intelligence and Exit Readiness Documentation
Activate cross-portfolio best-practice transfer engines, automated FSMA compliance reporting, and reliability engineering software analytics. The operational data accumulated through this phase also builds the documented performance improvement narrative that supports exit valuation — converting operational gains into defensible multiple expansion.
Reliability Engineering Software in PE-Backed Food Plants — Translating Uptime Into EBITDA
Reliability engineering software quantifies the financial consequence of asset unreliability in terms PE operating partners can connect directly to investment thesis performance. When every unplanned downtime hour carries a $18,000–$65,000 cost, and a portfolio plant averages 4.2 unplanned downtime events per month, the annual EBITDA drag from unreliability becomes a calculation — not an estimate. This translation from engineering metrics to financial outcomes is the critical capability gap between plant-level maintenance teams and PE-grade operational governance.
Reliability engineering software deployed through an industrial IoT monitoring infrastructure gives operating partners three capabilities that drive returns. First, it identifies the 20% of assets responsible for 80% of downtime cost — enabling capital allocation precision that reactive programs never achieve. Second, it produces failure mode documentation that informs maintenance procedure standardization across all portfolio plants simultaneously. Third, it generates the continuous performance improvement record that supports exit diligence — giving acquirers documented evidence of operational transformation rather than asserted claims. PE operating partners building this capability can Book a Demo to receive a portfolio-specific reliability gap analysis within 48 hours.
Portfolio-Level Operational Governance
A single-screen view of OEE, downtime cost, yield, and quality deviation across every portfolio plant — updated in real time and comparable with standardized KPI definitions. Capital allocation and operational intervention decisions driven by data, not quarterly site visits.
Operational Baseline Accountability
Facility-level production performance analytics that make throughput, quality, and maintenance targets visible in real time — creating the accountability infrastructure PE ownership requires while giving plant leadership the data tools to actually hit targets.
Predictive Asset Risk Management
Cross-portfolio asset health trending and predictive failure alerts across all instrumented equipment. Maintenance interventions scheduled proactively, integrated with production planning — eliminating the reactive emergency cycle that drives disproportionate labor and parts costs in acquired plants.
The Financial Case: How Operational Readiness Drives PE Returns and Exit Multiples
Operational transformation in PE-backed food manufacturing generates returns through three compounding mechanisms — each directly linkable to exit valuation. The case for deploying an industrial analytics platform is not a technology investment argument. It is a return optimization argument denominated in EBITDA and multiple expansion.
Downtime Cost Elimination
Unplanned downtime in acquired food plants averages $18,000–$65,000 per hour. Asset performance management through industrial IoT monitoring reduces downtime events by 55–67% within 12 months. At five events per month per plant, elimination represents $5.4M–$19.5M in annualized EBITDA across a four-plant portfolio — before any throughput improvement is counted.
Performance Gap Closure
The average OEE spread between best and worst plants in a PE food portfolio is 31%. Manufacturing intelligence software systematically transfers best practices from top-performing to underperforming facilities — closing this gap at a pace no site-visit program matches. Closing half the gap in an underperforming plant compounds EBITDA gains through the entire hold period.
Exit Multiple Defense
Strategic acquirers and secondary PE buyers apply haircuts to food manufacturing assets with undocumented operational improvement — or apply premiums to those with continuous, data-verified performance improvement records. The operational data generated by an industrial analytics platform through a hold period is itself an exit value asset, defensible in due diligence.
Operational Readiness KPI Benchmarks — PE-Backed Food Manufacturing Deployments
Average improvements achieved within 12 months of full industrial analytics platform deployment across iFactory's PE-backed food manufacturing portfolio company customer base.
PE Operational Readiness in Food Manufacturing — Frequently Asked Questions
What is operational due diligence in food manufacturing acquisitions?
Operational due diligence in food manufacturing goes beyond financial statement analysis to assess actual asset condition, maintenance backlog cost, production efficiency metrics, compliance documentation completeness, and technology infrastructure maturity. It quantifies the operational risk embedded in an acquisition target that financial due diligence cannot surface — and directly informs purchase price and post-close remediation planning.
How does predictive maintenance software differ from standard CMMS in a PE portfolio context?
A standard CMMS manages work orders and maintenance history at the plant level. Predictive maintenance software powered by industrial IoT monitoring detects asset degradation signals before failure — and in a PE portfolio context, aggregates this intelligence across all facilities simultaneously. This fleet-level view enables coordinated proactive intervention that reactive CMMS systems structurally cannot produce.
What is the typical implementation timeline for PE portfolio deployments?
PE portfolio deployments typically achieve initial cross-plant visibility within 6–10 weeks for companies with existing IoT infrastructure, and 14–20 weeks for plants requiring sensor installation and MES integration. iFactory's pre-deployment assessment significantly reduces integration complexity and compresses the timeline from baseline assessment to live portfolio intelligence.
How does operational performance data support exit valuation?
Continuous, data-verified operational performance improvement — documented through an industrial analytics platform — provides acquirers with auditable evidence of EBITDA sustainability and improvement trajectory. This shifts exit conversations from asserted to demonstrated operational capability, supporting multiple expansion and reducing the due diligence risk haircuts that operationally opaque businesses routinely absorb.
Can manufacturing intelligence software work across portfolio plants with different MES systems?
Yes. Modern industrial analytics platforms ingest data from heterogeneous source systems — multiple MES vendors, different SCADA configurations, and varied ERP instances — and normalize them into a standardized enterprise schema. Most PE portfolio deployments achieve meaningful cross-facility visibility with 70–80% of data sources connected at initial launch, expanding to full coverage within the first quarter.
What is the typical ROI payback period for a PE-backed food manufacturer?
Most PE-backed food manufacturers achieve full platform investment payback within 10–14 months of full deployment, driven primarily by downtime cost elimination and OEE gap closure. ROI accelerates as the platform accumulates cross-facility performance data and the predictive accuracy of maintenance and quality models compounds through the hold period.
Don't Let Operational Debt Erode Your Food Manufacturing Investment Thesis
iFactory's industrial analytics platform delivers the operational readiness assessment, predictive maintenance intelligence, and cross-portfolio performance visibility PE operating partners need — purpose-built for food and beverage manufacturers under acquisition pressure.