The line supervisor at a midwestern snack-foods plant watches the morning report on her tablet. Fryer temperature at line 3 drifted 2°F overnight — the night operator caught it on a clipboard at 2 AM but didn't flag it until shift change. That 2°F drift, over an eight-hour run, cost 340 pounds of off-spec product and a late delivery to a national retailer. The data existed — on paper logs, on a dusty PLC historian, in the line operator's head. But nobody saw the pattern until the pallet was rejected. This is the gap between paper SPC and a living digital twin of your line.
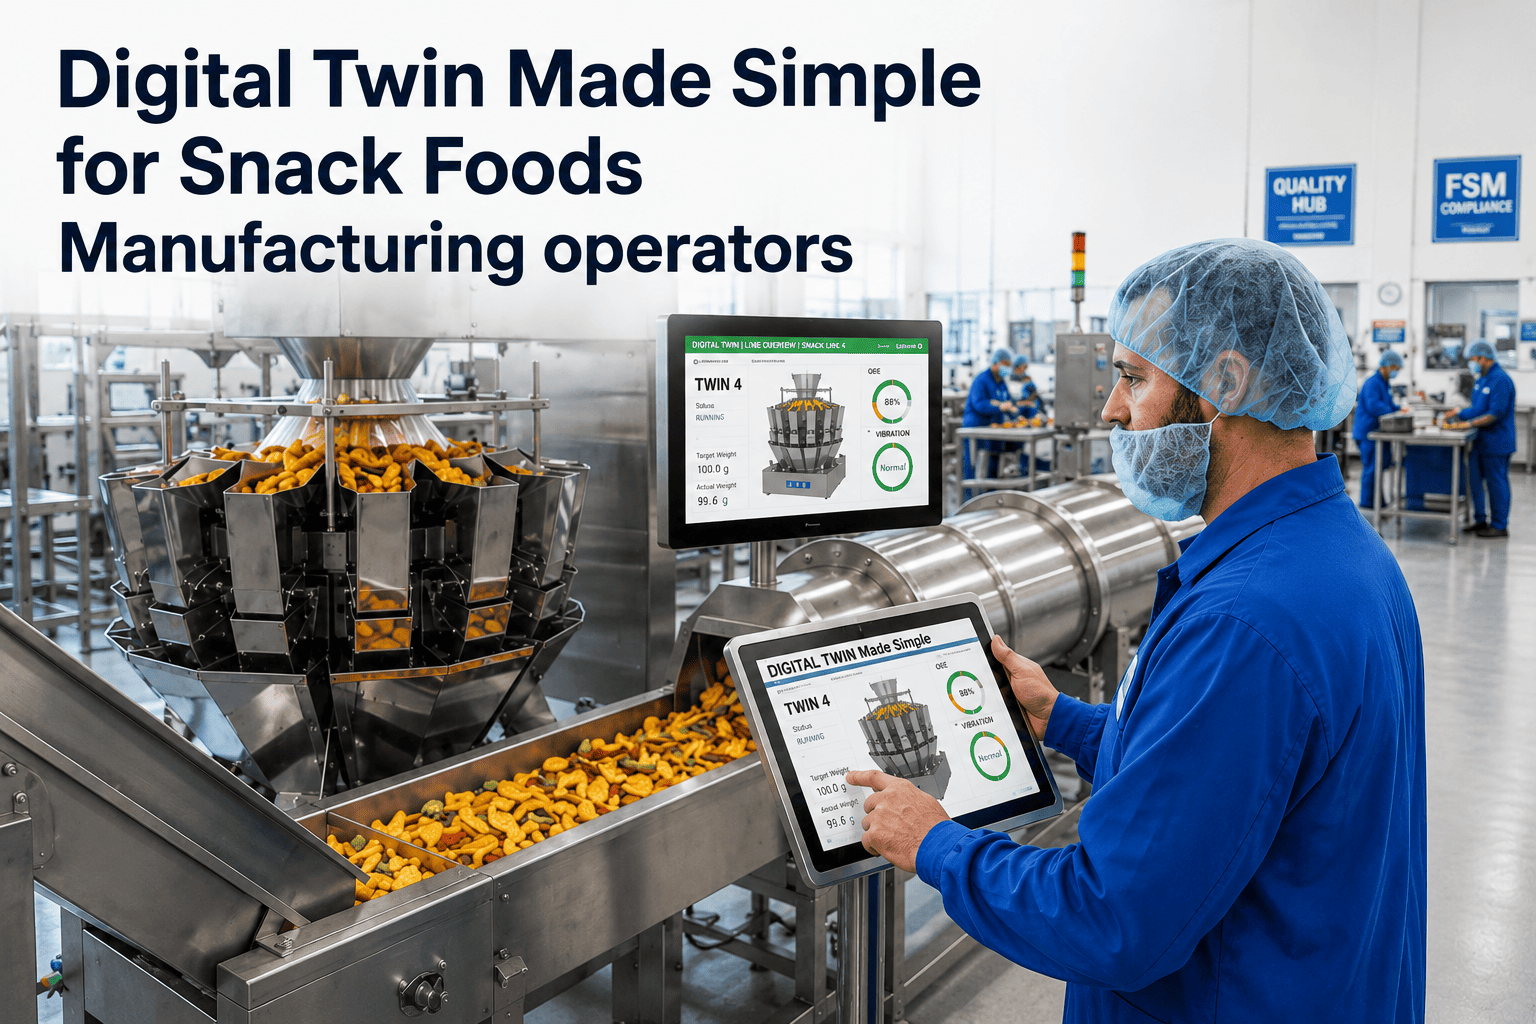
From Paper SPC to Digital Twin: A Line Operator's View of Real-Time Control
One platform that replaces clipboards, spreadsheets, and siloed dashboards with a live, actionable digital twin of every line — from fryer to bagger to pallet.
iFactory is an end-to-end manufacturing intelligence platform that lives on a single NVIDIA appliance on your plant network. It connects to every data source you already own — PLCs, SCADA, weigh scales, metal detectors, vision systems, and your paper SPC logs (scanned or entered). It builds a live digital twin of your snack food lines, then puts that twin in the hands of every operator, supervisor, and plant manager on a single pane of glass. No cloud upload, no data leaving the plant, no months-long integration projects.
One Platform That Replaces Five Tools
iFactory absorbs the roles of paper SPC systems, manual data loggers, separate OEE dashboards, quality LIMS portals, and ad-hoc reporting spreadsheets — all into a single, operator-friendly interface that runs on the plant floor.
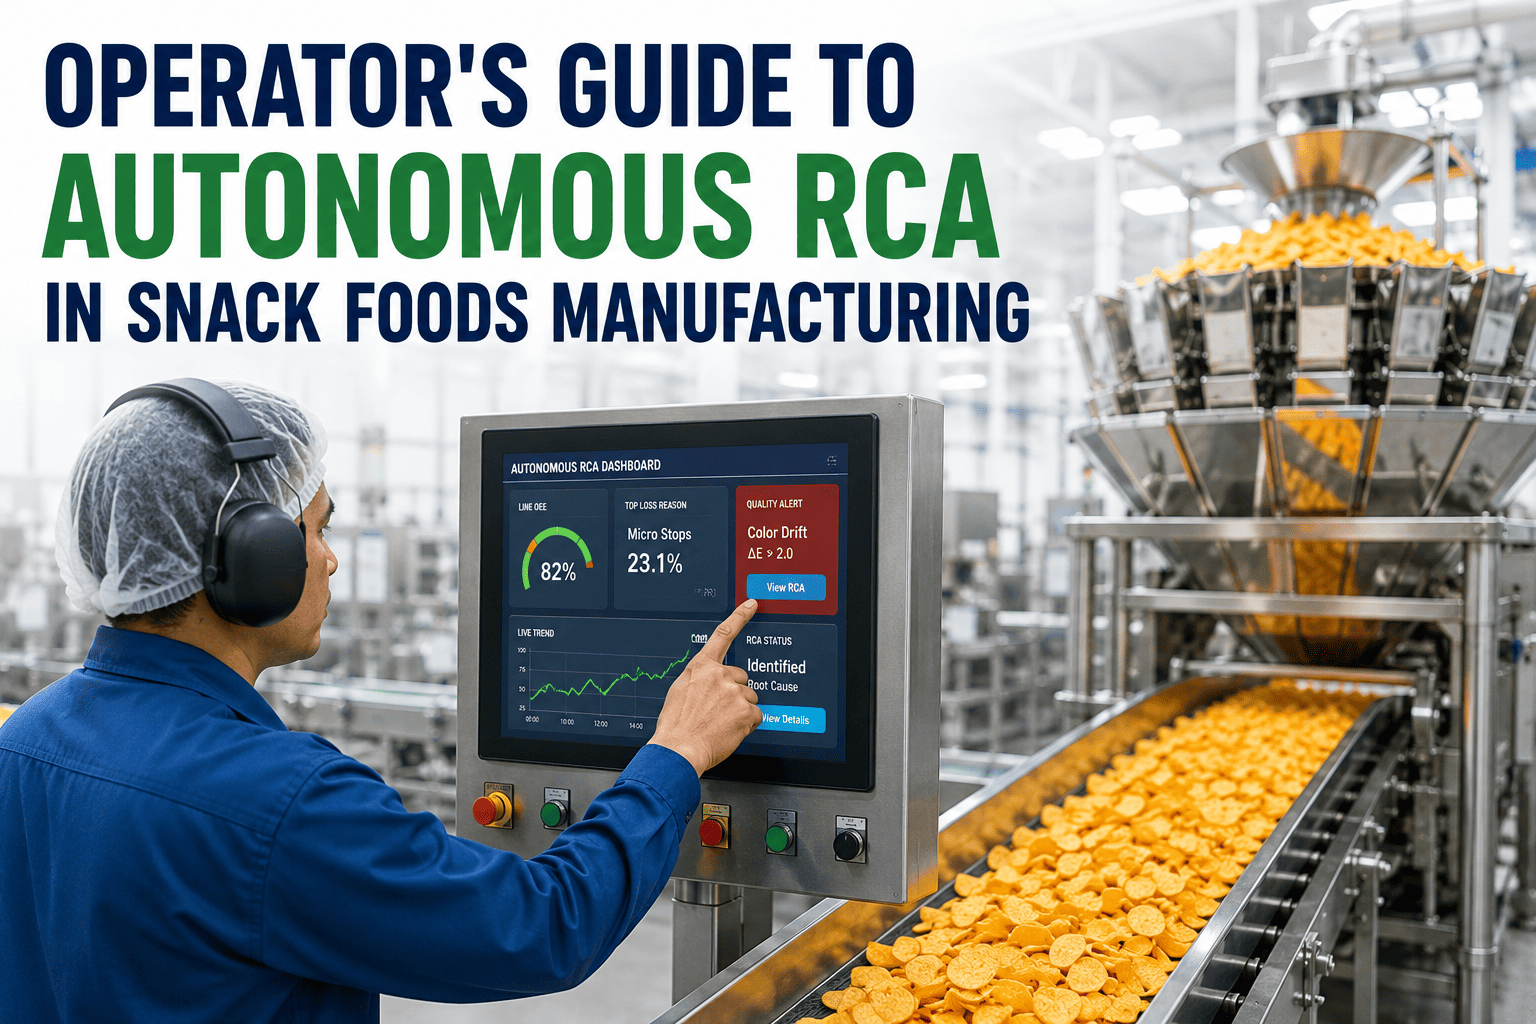
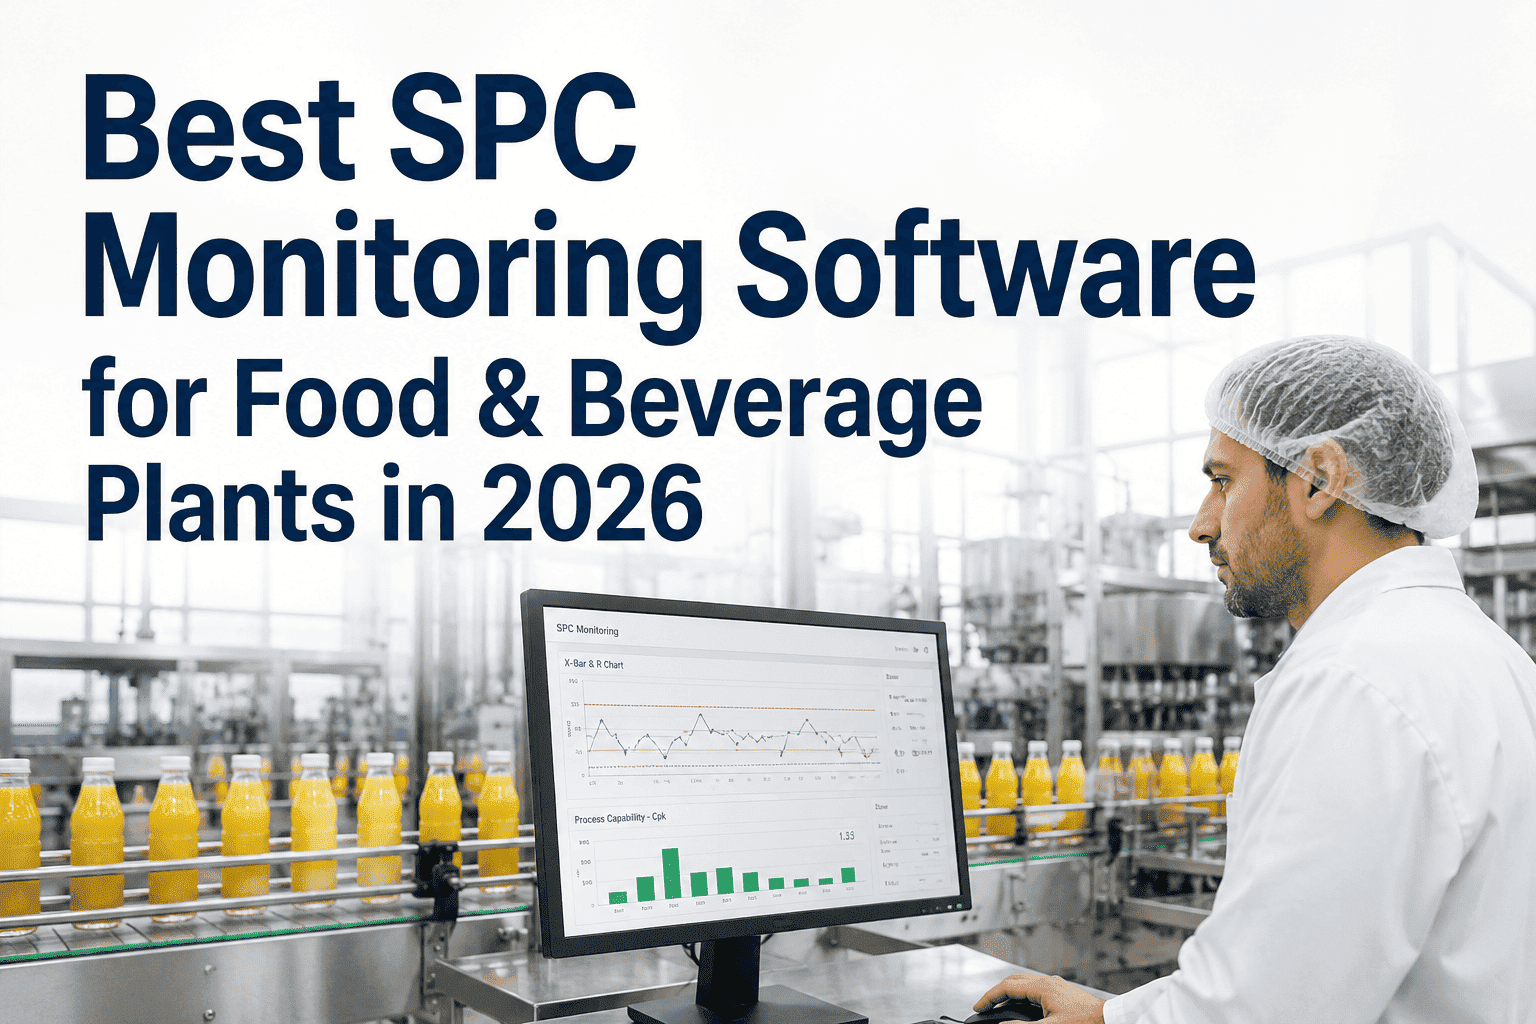
Live Control Charts
Every critical parameter — fryer oil temperature, seasoning drum speed, bag seal pressure — streams into live X-bar and R charts updated every second. Operators see a drift the moment it starts, not when the shift log is reviewed.
Batch-Level Digital Thread
Every bag, every case, every pallet is linked to its raw material lot, process conditions, and quality checks from mixer to shipping dock. A retailer's trace request that used to take 48 hours now takes 90 seconds.
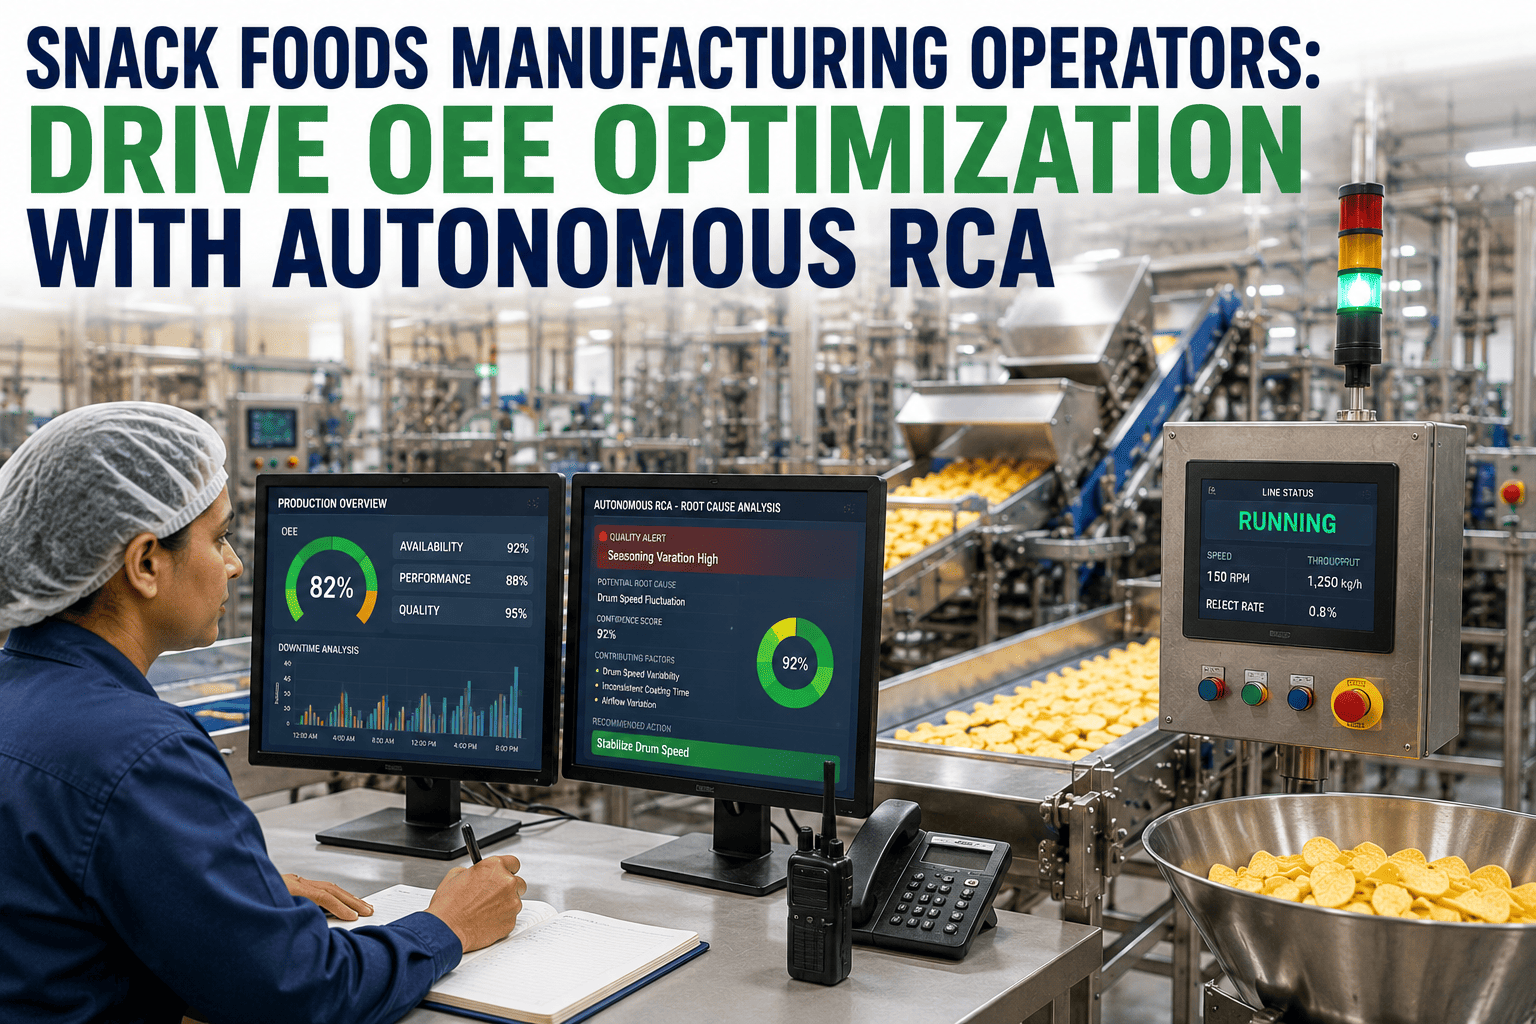
Line Performance Dashboard
Availability, performance, and quality metrics calculated automatically from PLC data and operator inputs. No manual stopwatch studies. No end-of-shift spreadsheet gymnastics. Live OEE for every line, every shift, every SKU.
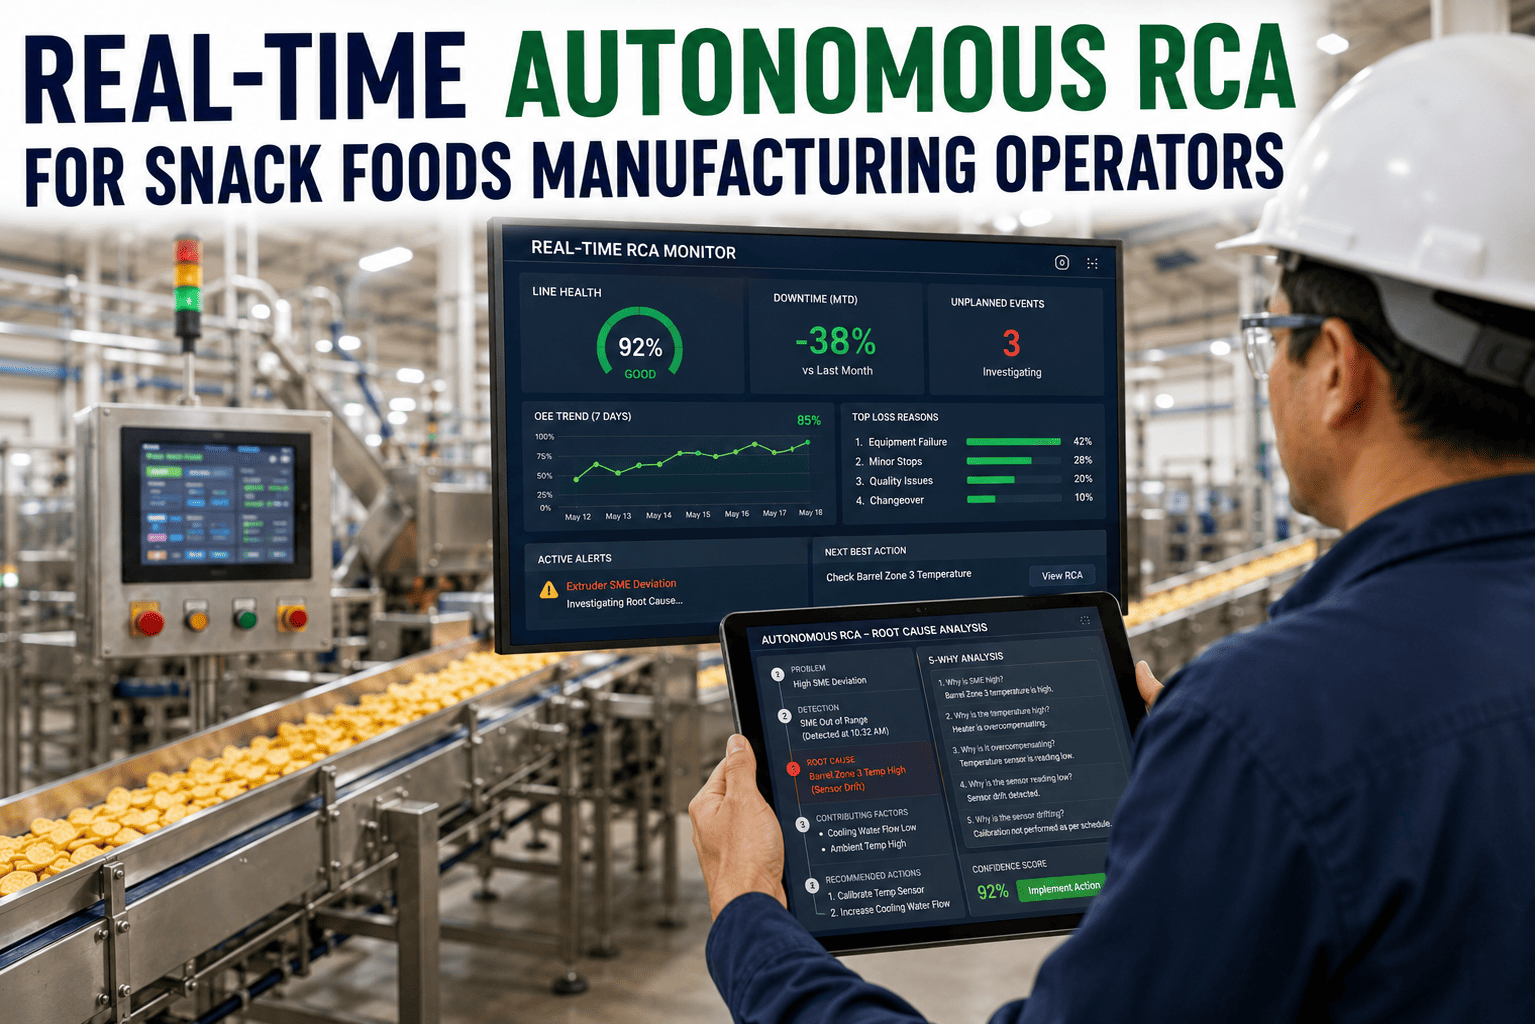
Drift Detection & Prediction
Machine learning models trained on your line's own data detect subtle shifts in temperature, pressure, and speed before they cause a quality failure. Alerts go to the operator's station and the supervisor's tablet simultaneously.
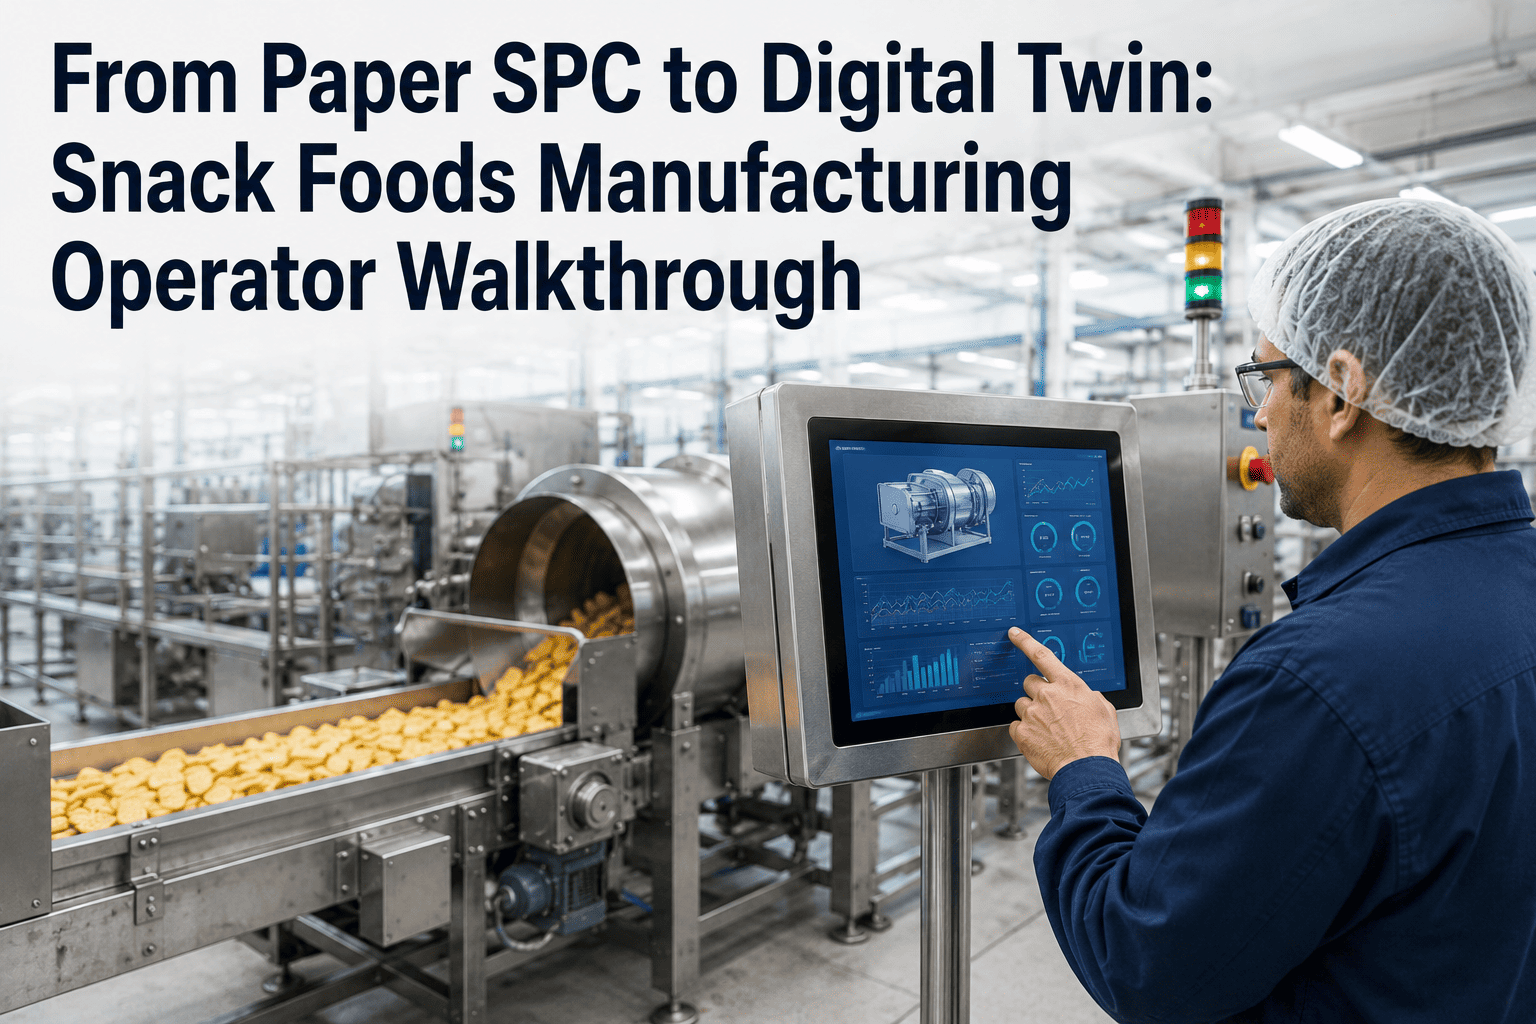
Live 3D Line Visualization
A digital twin of each line shows real-time throughput, machine status, and material flow. Operators can zoom into any station, see current parameters, and compare against target values — without leaving the line.
Automated Shift & Daily Reports
End-of-shift reports that used to take 30 minutes of clipboard data entry and Excel manipulation are generated automatically. Quality metrics, yield, downtime reasons, and OEE — all in one PDF, emailed to the team at shift end.
From Data Connection to Operator Dashboard in Four Steps
iFactory is turnkey. We connect to your existing data sources, configure the digital twin, and put the interface in front of your operators — typically in 6 to 12 weeks.
Connect Data Sources
We plug into your PLCs, SCADA, weigh scales, metal detectors, and any paper log systems. No new sensors required. No IT infrastructure changes.
Build the Digital Twin
Our team configures the live model of your line — every machine, every sensor, every quality checkpoint — and maps the data streams to the twin in real time.
Deploy Operator Interfaces
We set up dashboards, control charts, and alert rules tailored to your operators' workflows. Training takes two hours. No new software to install on plant PCs.
Go Live & Iterate
Within 6–12 weeks, your team is running on iFactory. We add new data sources, refine alert thresholds, and expand to additional lines based on what you learn.
What a Clipboard and a Spreadsheet Actually Cost You
Paper SPC doesn't just slow you down — it hides problems until they become waste, rework, or chargebacks. Here's what three common scenarios cost a typical snack foods line running 16 hours a day, 5 days a week.
Undetected Temperature Drift
A 3°F fryer temperature drift that goes unnoticed for two hours produces 400–600 pounds of off-spec product. With paper SPC, the drift is caught at best at the next hourly check, at worst at shift change.
Delayed Quality Hold Response
A metal detector flag that isn't reviewed until end-of-shift can hold an entire pallet. With live alerts, the operator stops the line in seconds and isolates the affected product immediately.
Missed OEE Improvement
Without live OEE data, a 2% availability loss from a sticky conveyor belt sensor goes unnoticed for weeks. That's 19 minutes of lost production per shift, every shift, for a month.
What Operators and Plants Achieve with iFactory
These are real outcomes from snack food lines running iFactory in production for three months or more.
Your operators already know what the line should feel like. iFactory gives them the data to prove it — in real time. Book a 30-min walkthrough and we'll show you a live digital twin running on a snack food line today.
Questions from Plant Operations Teams
Stop managing your snack food lines with clipboards and spreadsheets.
See how a live digital twin puts real-time SPC, OEE, and traceability in your operators' hands — in 6 to 12 weeks, with no cloud dependency. Book a 30-minute walkthrough and we'll show you a live line running on iFactory.