The 3:00 AM shift supervisor at a mid-sized snack foods plant watches the fryer temperature trend climb past the spec limit for the third time this week. He knows the batch will test high for acrylamide in the morning lab run — another 40,000 bags headed for the rework grinder. His dashboard shows yesterday's production summary, not the real-time oil degradation curve climbing in front of him. The plant's historian data lives in a separate server room, three network hops away, updated every 15 minutes. By the time anyone sees the trend, the product is already in the bag. This gap between what's happening on the line and what operators can actually see costs snack manufacturers 3–5% of yield every shift, every day.
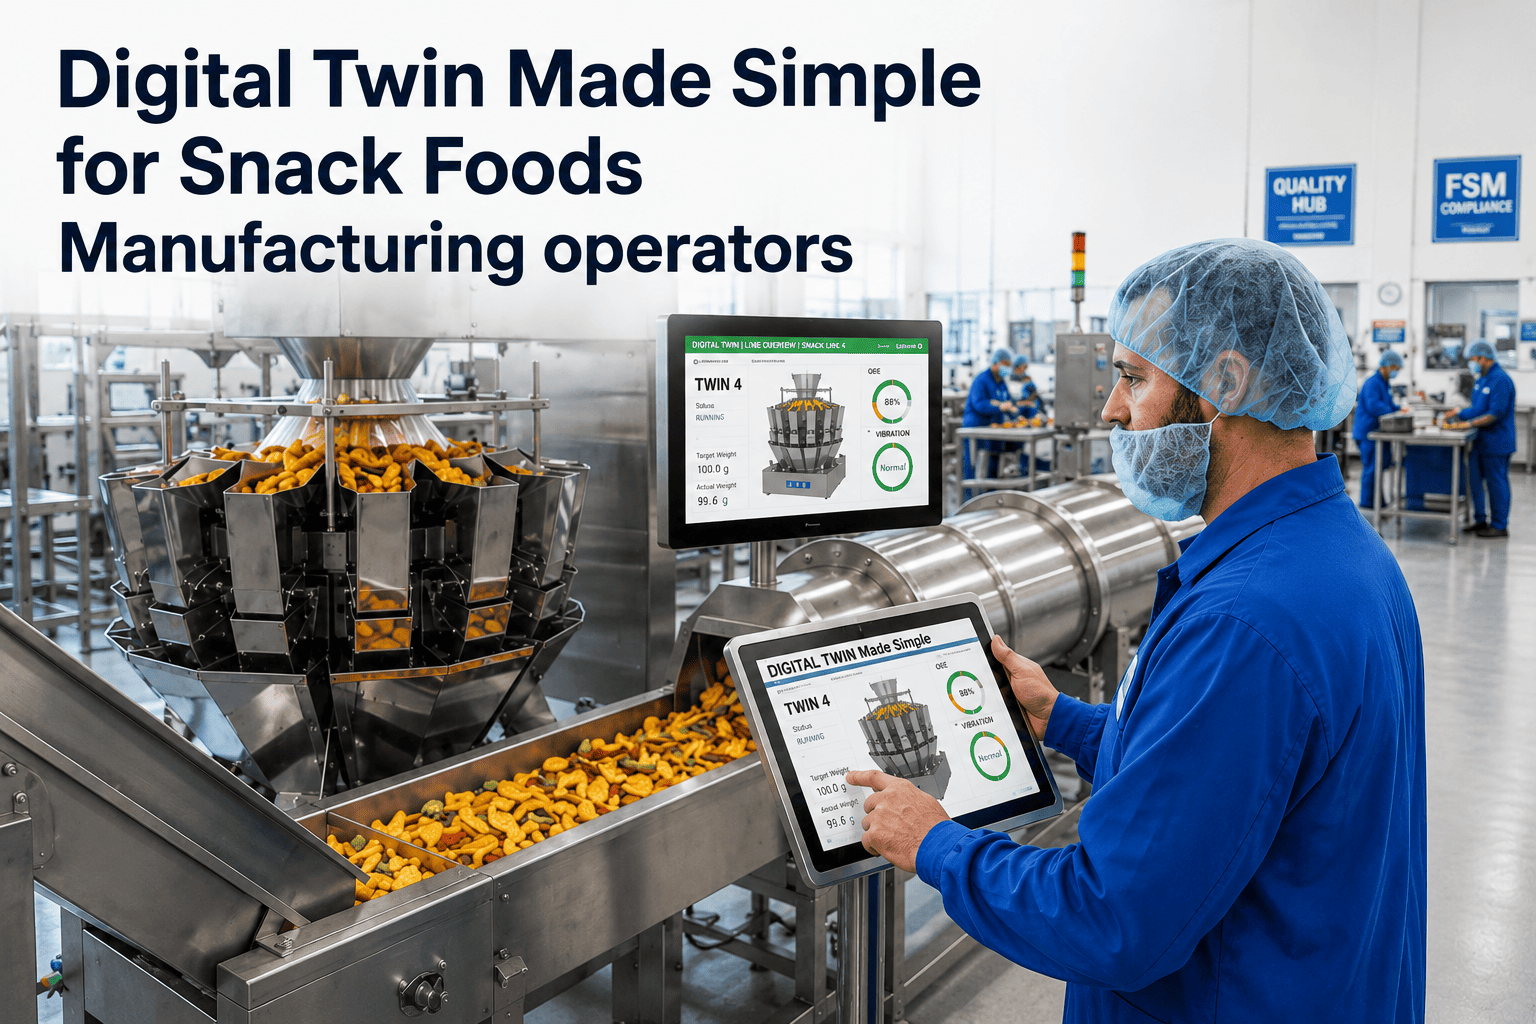
Your Snack Foods Line Has a Digital Twin — And Operators Can See It in Real Time
iFactory's on-premise digital twin gives every operator, supervisor, and plant manager a live, unified view of the line — from fryer oil temperature to packaging seal integrity — without a single data point leaving the plant network.
What Changes When Your Line Has a Live Digital Twin
The difference isn't more data — it's who sees what, when. Here's how the same shift plays out with and without iFactory.
Without iFactory
- Operator sees a 15-min-old clipboard reading on fryer oil temp
- Lab acrylamide results arrive 4 hours after the batch is packed
- Packaging seal pressure alarms go to a PLC light panel nobody monitors
- Line speed adjustments are reactive — after the downtime event
- Shift handoff is a paper log and a verbal "it was running fine"
With iFactory
- Operator sees live fryer oil degradation curve with 10-second latency
- Acrylamide prediction model alerts before the spec threshold is crossed
- Seal pressure trend shows drift 30 minutes before failure — operator adjusts
- Line speed is optimized in real time based on upstream and downstream conditions
- Shift handoff is a complete digital replay of the last 8 hours — every trend, every event
Five Gaps in Your Line Visibility That Are Costing You Real Money
Every 30 seconds of unplanned downtime on a high-speed snack line costs $2,500 in lost throughput. These are the gaps that add up to millions per year.
Oil degradation blind spot
Without continuous TPC (total polar compounds) monitoring, fryer oil is changed on a schedule, not on condition. The result: 15% of oil is discarded early, and 8% of product fails acrylamide spec.
Packaging seal drift
Seal pressure sensors exist but aren't correlated to bag leak test results. Operators discover a bad seal run 4 hours later — 60,000 bags to rework.
Seasoning application variance
Seasoning drums run at fixed speed regardless of product density. Real-time weight checks show 3–5% over-application on 20% of production.
Changeover time creep
Average changeover is 45 minutes but varies between 38 and 72 minutes. No standard process because no one can see the exact sequence of events.
Cooling tunnel temperature drift
Cooling tunnel exit temperature drifts 4°F over a 12-hour run. Product enters packaging warm — bag seal integrity drops by 12% for the last 2 hours of the shift.
Four Steps from Data Sources to Live Line Visibility
No custom code. No cloud migration. Just your existing PLCs, sensors, and historians wired into a single live model of your line.
Connect
iFactory connects to your existing PLCs (Allen-Bradley, Siemens, Mitsubishi), sensors (temperature, pressure, flow, weight), and historians (OSIsoft PI, Canary, SQL) — all on your plant network.
Model
Our AI ingests 90 days of historical data and builds a digital twin of your line — mapping every sensor to every product state, every recipe step, every quality outcome.
Visualize
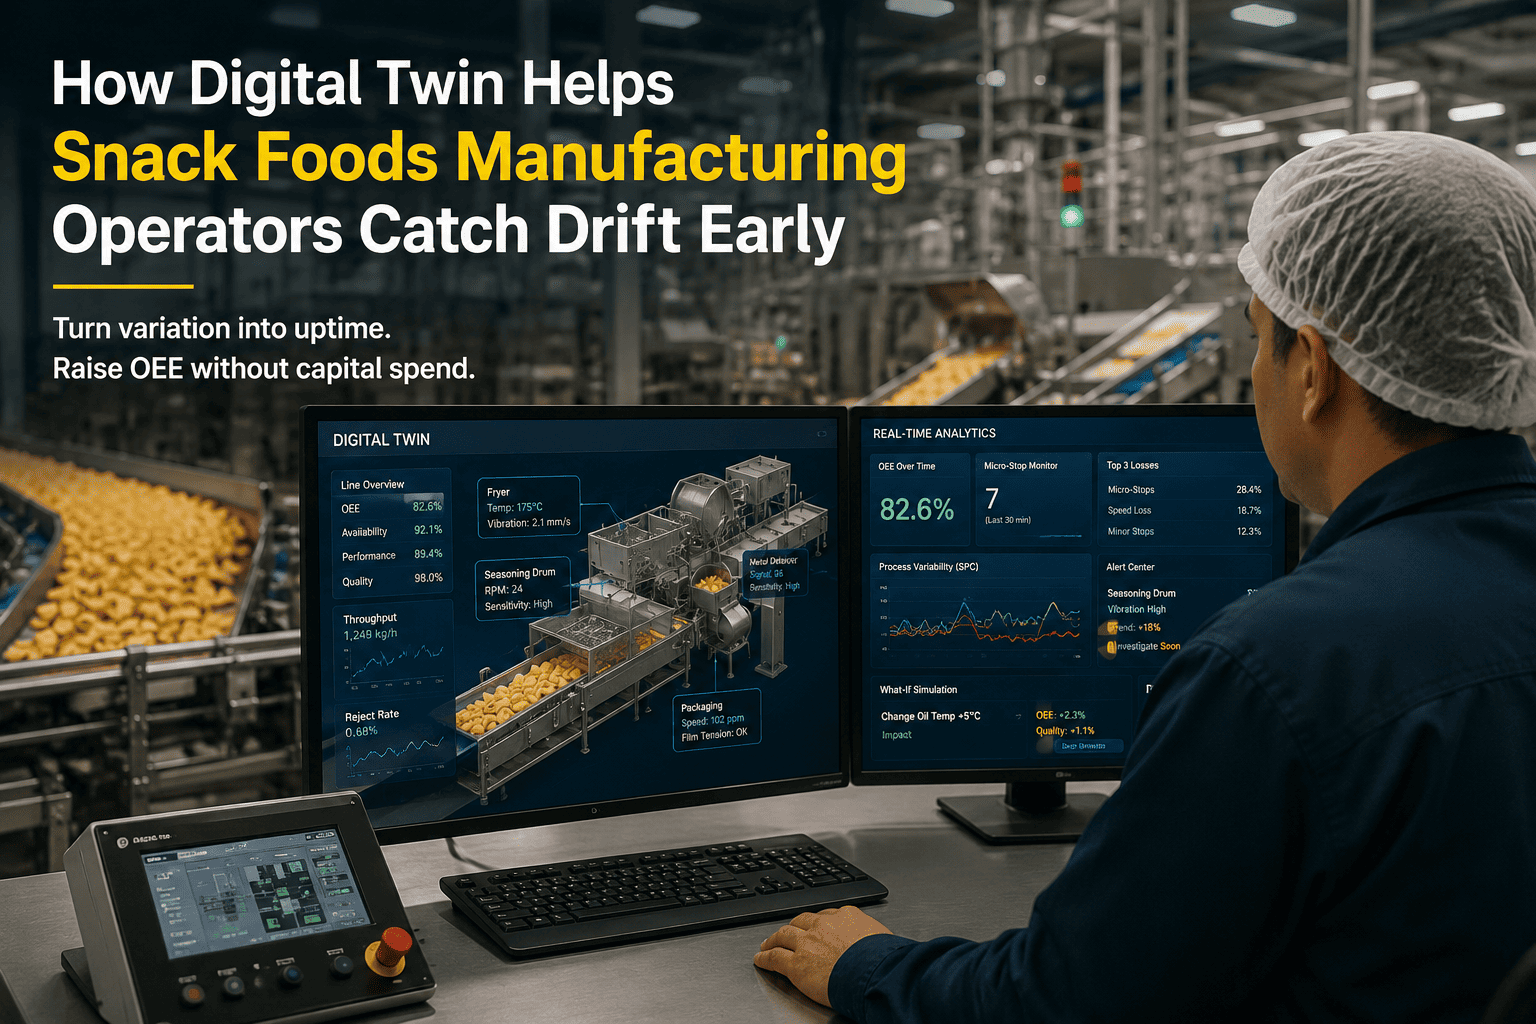
Operators see a live, 3D digital twin of the line on a single screen — fryer, seasoning drum, cooling tunnel, packaging — with every metric updating every 10 seconds.
Predict
The twin predicts quality drift, equipment degradation, and downtime events 30–60 minutes before they happen — and tells the operator exactly what to adjust.
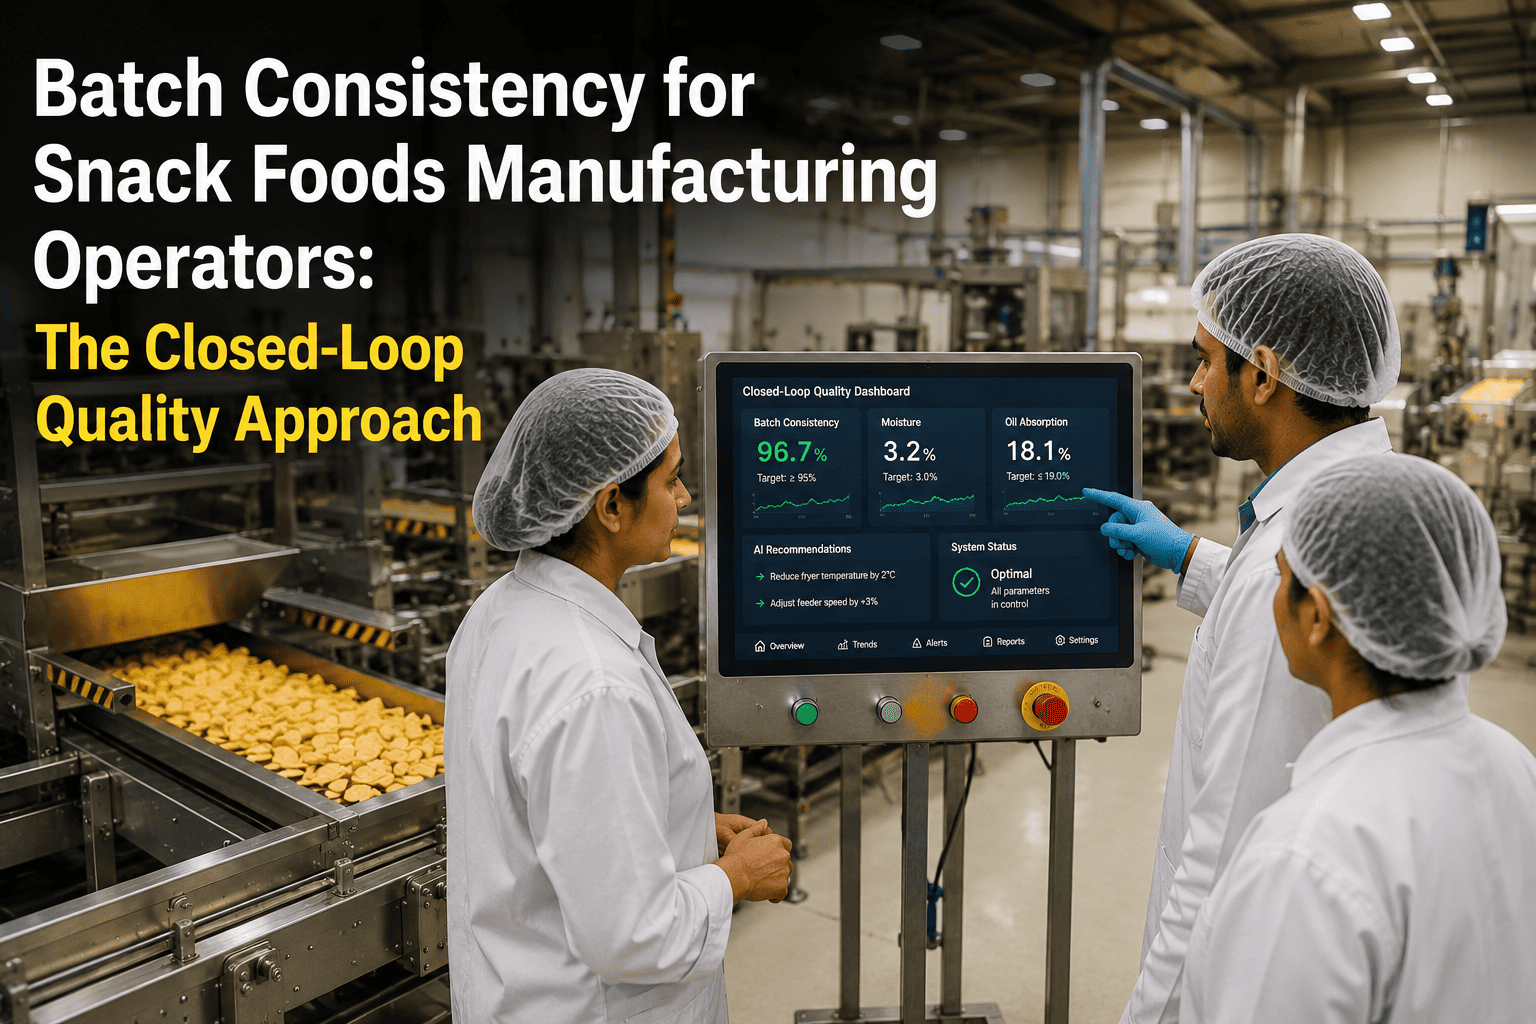
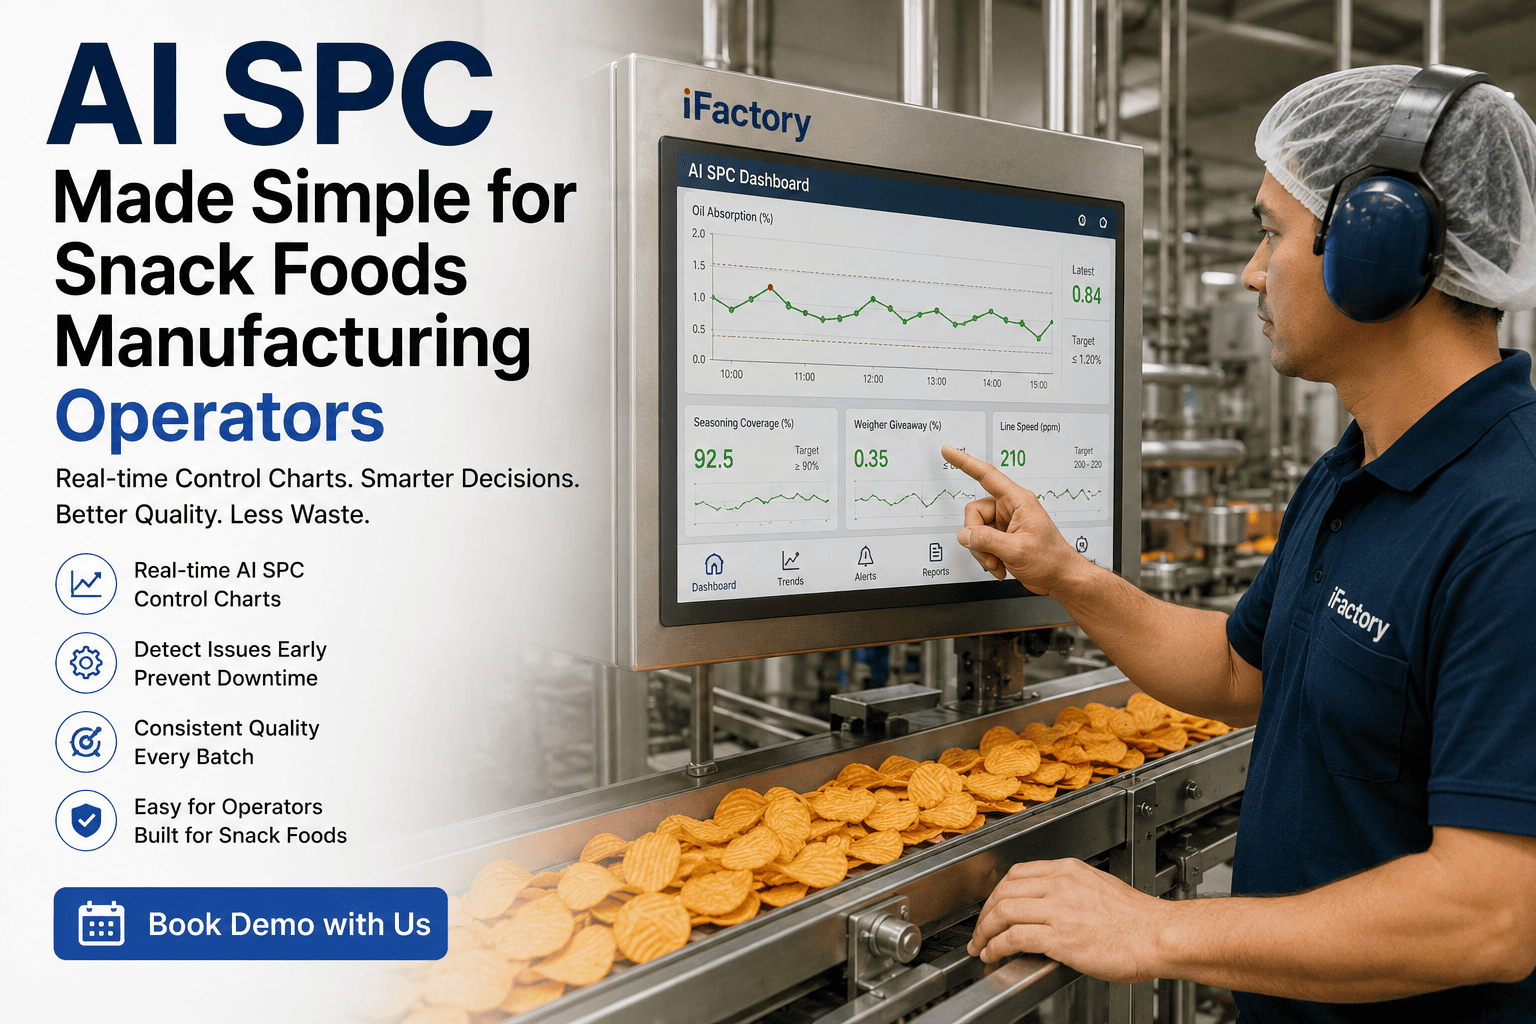
What Your Operators Actually See on the Screen
This isn't a dashboard with 47 charts. It's a single, unified view of your line — built for the operator on the floor, not the analyst in the back office.
Fryer Oil Health Index
Continuous TPC, temperature, and flow rate combined into a single 0–100 health score. When the score drops below 85, the system recommends a partial oil change — not the full dump. Operators see the trend line, not a red light.
Acrylamide Risk Map
A real-time heat map of the fryer showing where and when acrylamide formation risk crosses the threshold. The model uses oil age, temperature profile, and product residence time — alerts come 20 minutes before the lab would catch it.
Seal Integrity Trend
Every packaging lane's seal pressure, temperature, and dwell time plotted against the last 100 bag leak test results. When any parameter drifts past 2 sigma, the operator gets a "check seal on lane 3" alert — not a "seal failure" alarm 4 hours later.
Line Speed Optimizer
The digital twin adjusts line speed in real time based on upstream fryer throughput, downstream packaging availability, and seasoning drum capacity. Operators see a recommended speed target — not a manual guess — updated every 60 seconds.
Your line's digital twin can be live in 12 weeks — no cloud, no data leaving the plant, no custom development. Book a 30-min walkthrough and we'll show you a twin running on a snack line right now.
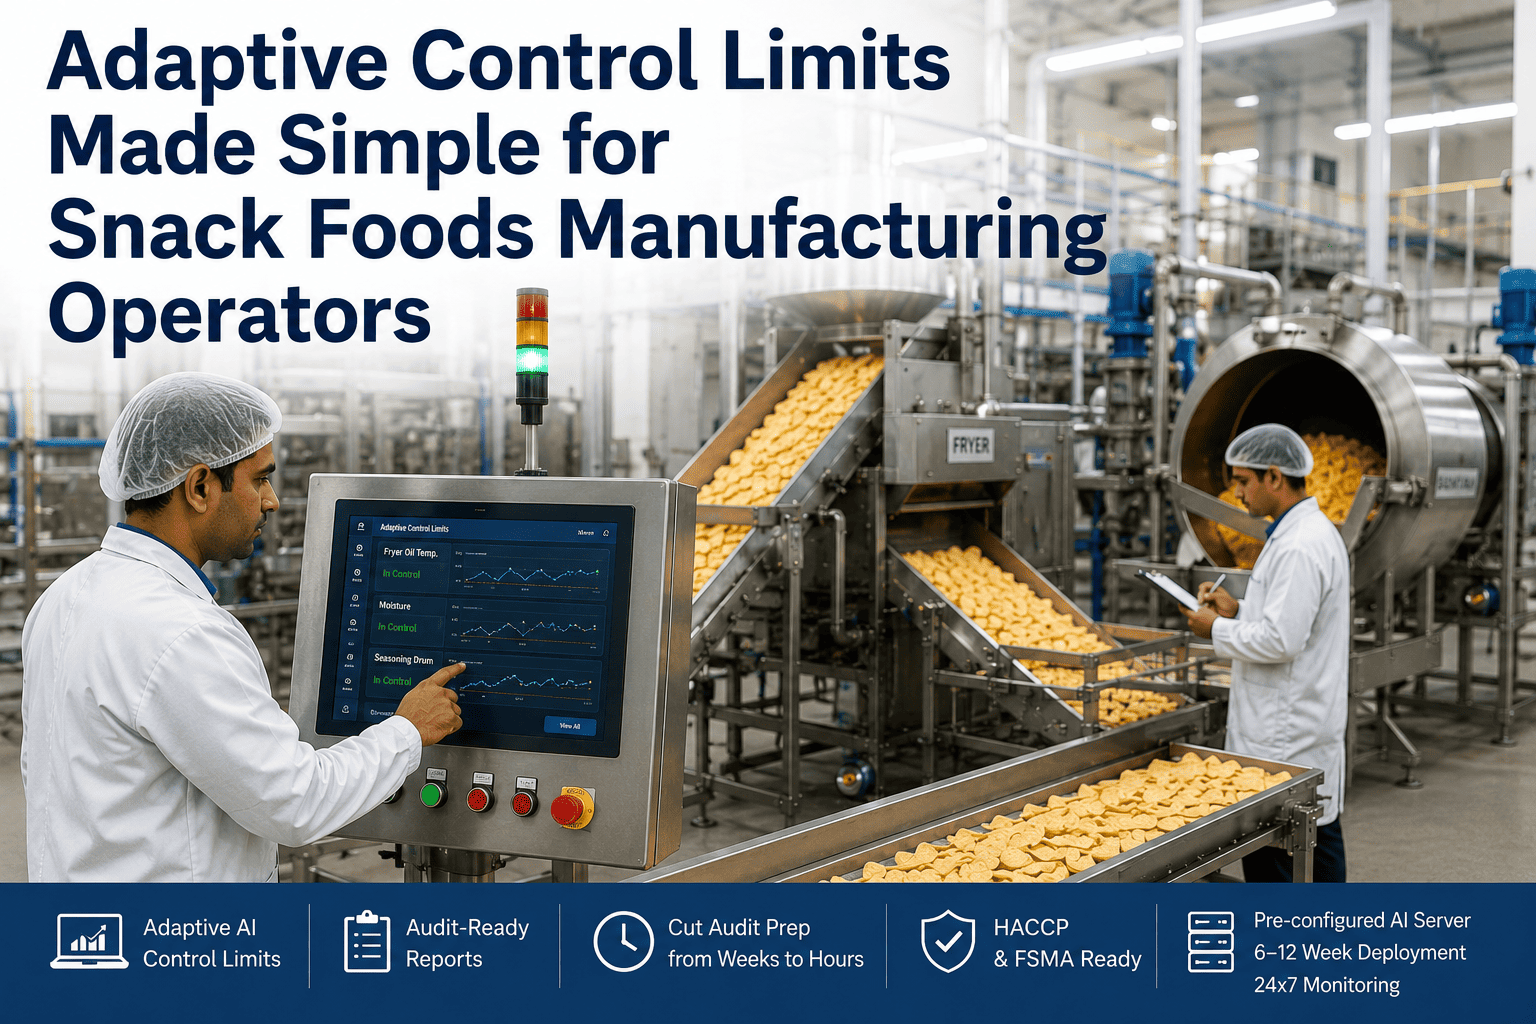
Everything Included in Your Digital Twin Pilot
iFactory delivers a complete, turnkey pilot in 6–12 weeks. You hand over data-source access. We hand over a working digital twin on your plant network. No cloud, no consultants, no surprise costs.
On-Premise NVIDIA Appliance
Installed on your plant network. Zero data egress. No cloud dependency. No IT security review delays.
6–12 Week Pilot Timeline
From data-source access to live digital twin on operators' screens. No custom development. No multi-year deployment.
Operator-Trained Interface
Designed for the shift supervisor, not the data scientist. One screen. One health score per line. One alert when something needs attention.
Predictive Quality Models
Acrylamide, seal integrity, oil degradation, seasoning application — all modeled and live before the pilot ends. Not a demo. A working twin.
24x7 Managed Service
iFactory monitors your twin around the clock. If a sensor drops or a model needs retraining, we handle it — not your IT team.
Pilot-to-ROI in One Quarter
Your first yield improvement, first downtime reduction, first quality catch — all measured and documented within 90 days of go-live.
What Snack Foods Operators Ask About Digital Twins
Your Snack Line's Digital Twin Is 12 Weeks Away
No cloud. No custom code. No data leaving your plant. Just a live, unified view of every fryer, every drum, every packaging lane — on your operators' screens, updating every 10 seconds.