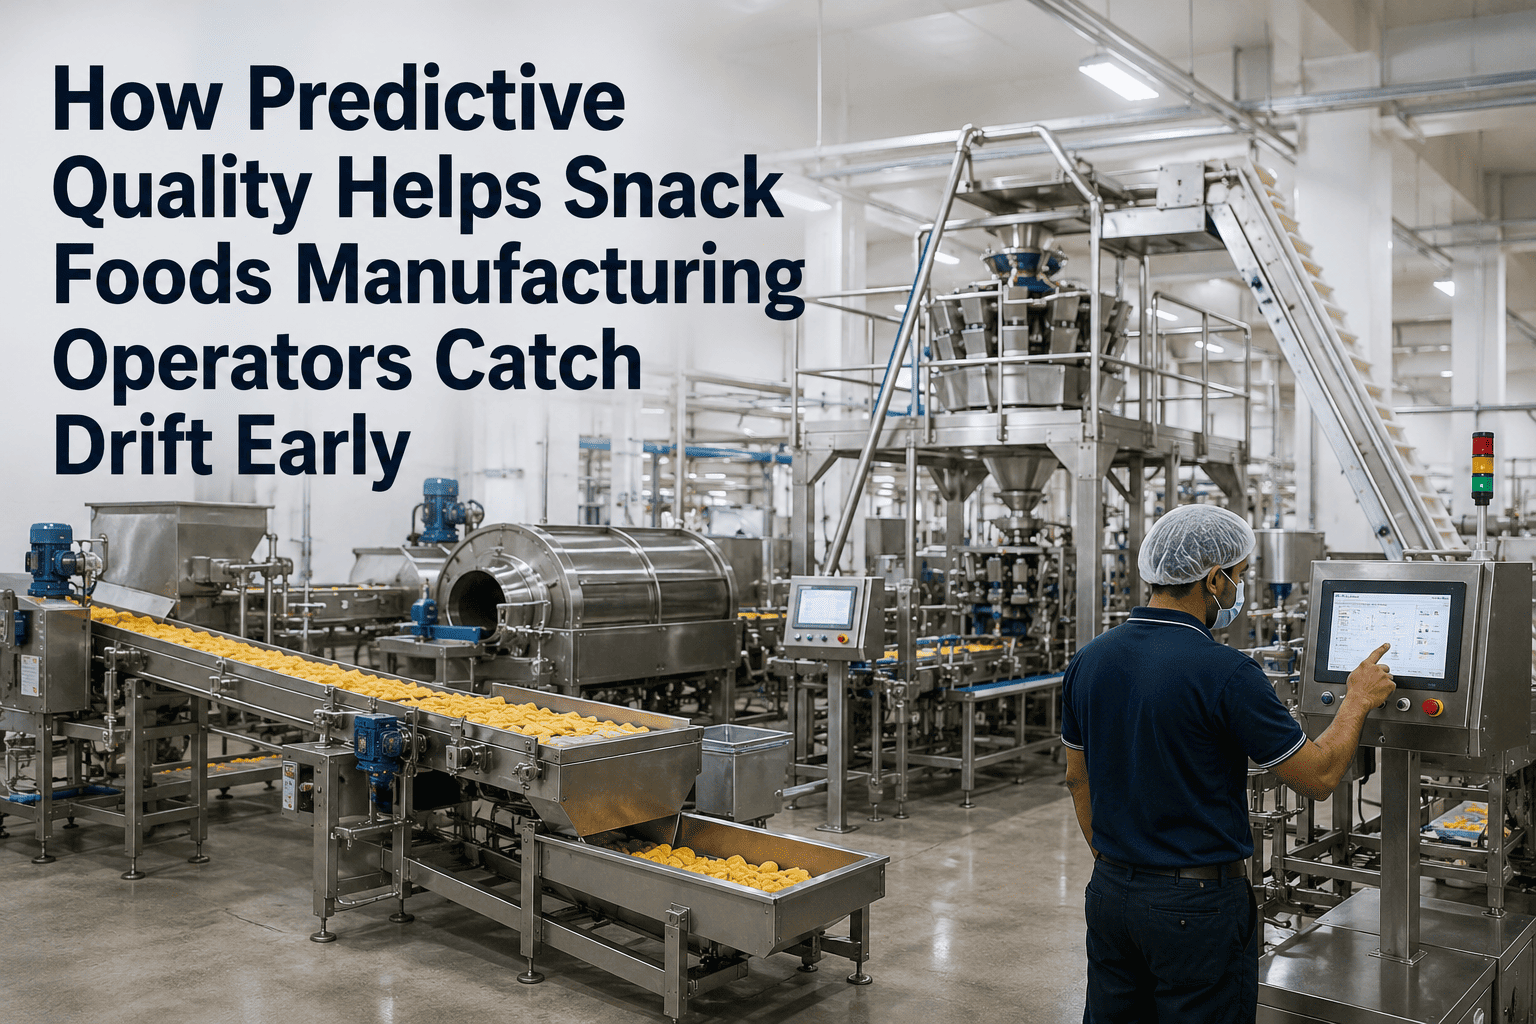
At 2:17 AM on a Tuesday shift change, the fryer operator at a regional potato chip plant watches the oil temperature gauge settle at 352°F—three degrees above spec. He makes a mental note, finishes his log, and clocks out. By the time the day crew notices the drift, 847 pounds of product have been rejected for off-color texture and the line has burned through an extra 230 gallons of make-up oil. That single unlogged temperature excursion cost the plant $4,700 in waste, rework, and lost throughput—before breakfast. For snack food manufacturers running high-speed lines with tight moisture, color, and texture windows, the gap between a good shift and a bad one is measured in single degrees, seconds, and grams. Closing that gap without hiring an army of data scientists is the challenge this page solves.
Predictive Quality Made Simple: Stop Rejecting Product Before It Happens
iFactory gives snack food operators a turnkey AI that predicts moisture, color, and texture drift 15–30 minutes before it hits the reject gate — no data science team, no cloud, no rip-and-replace of your existing line controls.
How Snack Food Quality Management Changes When AI Runs on the Line
Most snack plants today manage quality reactively: a lab technician pulls a sample every 30 minutes, runs a moisture or color test, and adjusts the fryer or oven after the fact. By the time the test result lands, 500–1,000 pounds of product have already passed through the window. The table below shows what that reactive model costs — and what a predictive model delivers.
Without iFactory
- Quality checked by lab samples every 20–40 minutes — rejects found after the fact
- Operator relies on visual inspection and handwritten logs for fryer temperature, belt speed, and oil age
- Moisture drift of 0.3% triggers a line stop and manual rework of 400–800 lbs of product
- No correlation between upstream variables (oil turnover rate, feed moisture) and final product color
- Each quality incident costs $3,000–$6,000 in scrapped product, lost throughput, and overtime
With iFactory
- AI predicts moisture, color, and texture 15–30 minutes before the reject gate — operator gets an alert with a corrective action
- All line data (temperature, belt speed, oil flow, feed rate) ingested and modeled automatically in one platform
- Predictive model catches drift at 0.1% moisture deviation — operator adjusts before any product is wasted
- iFactory correlates 12+ upstream variables to final quality in real time, identifying root cause instantly
- Quality incidents drop to near zero; the plant saves $1.4M–$2.0M annually in scrap and rework
Three Problems That Drain Your Margin Every Shift
Every snack food plant we walk into shares the same three hidden costs. They don't show up on a P&L as a line item, but they erode throughput, yield, and operator effectiveness shift after shift.
Undetected Moisture Drift
A 0.5% moisture deviation on a tortilla chip line running 2,000 lbs/hr means 20 lbs of over-dried product per hour — 480 lbs per shift. At $1.20/lb that's $576 per shift in lost yield, or $173,000 per year per line.
Color Rejects from Oil Degradation
As fryer oil ages, the free fatty acid (FFA) level rises and product darkens unpredictably. Plants typically change oil on a fixed schedule — not on actual condition. Over-oiling or under-oiling costs $4.50 per gallon of oil and 300–500 lbs of off-color product per oil change cycle.
Unplanned Line Stops for Rework
When a quality check fails, the line stops for 15–45 minutes while the team identifies the root cause and reworks the product. At 2,500 lbs/hr throughput, a 30-minute stop costs 1,250 lbs of lost production — $1,500 in lost margin per incident, and most plants see 3–5 of these per week.
Add these up across three lines and the annual cost of reactive quality management exceeds $1.8M per plant. See how predictive quality eliminates these costs in a 30-minute walkthrough.
From Line Data to Quality Prediction in 6–12 Weeks
iFactory is an end-to-end, turnkey platform. We don't ask your team to learn Python or configure cloud infrastructure. Here is exactly how we go from data access to a working predictive model on your line.
Connect Your Line Data
We connect to your existing PLCs, SCADA, and lab systems — no new sensors or hardware required. iFactory ingests fryer temperature, belt speed, oil flow, moisture readings, and color scores.
AI Trains on Your Process
Our AI learns the relationship between your upstream variables and final product quality. It models moisture, color, and texture drift using your historical data — typically 30–60 days of production data is enough for a robust model.
Operator Gets Predictions & Alerts
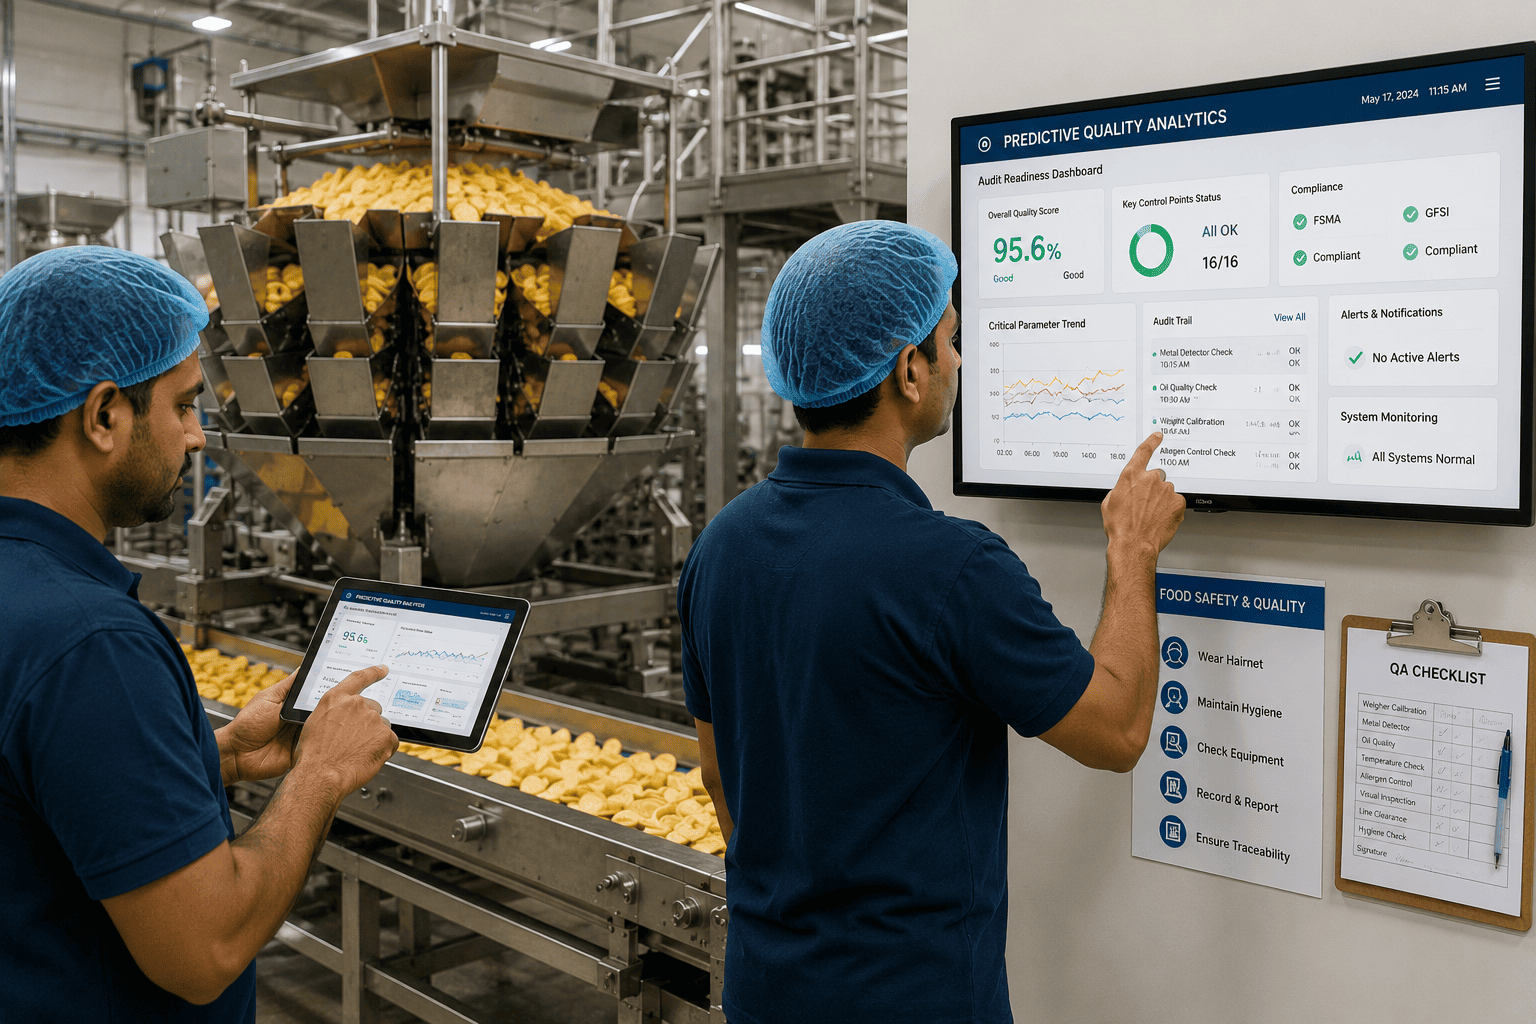
iFactory displays a simple dashboard on the line HMI. The operator sees a 15-minute look-ahead for each quality metric. If drift is predicted, the system sends an alert with a specific corrective action — "Reduce fryer temperature by 2°F" or "Increase belt speed by 3%."
Continuous Learning & Improvement
The model retrains automatically as new data comes in. Every shift, every batch improves the prediction accuracy. Within one quarter, the model reaches 92%+ accuracy on quality predictions.
What iFactory Delivers for Your Snack Food Line
These are the specific capabilities that make predictive quality work on a real production line — not a lab demo.
15-Minute Quality Forecast
iFactory predicts moisture content, color score (L*a*b or Agtron), and texture (hardness, crispness) 15–30 minutes ahead of the reject gate. Operators get a traffic-light dashboard: green (on spec), yellow (drift detected — adjust), red (reject imminent — stop line).
Automatic Root Cause Analysis
When a quality deviation occurs, iFactory traces it back to the upstream variable that caused it — oil temperature, belt speed, feed moisture, or oil age. No more guessing whether the problem is the fryer or the raw material.
Closed-Loop Adjustments
For plants that want full automation, iFactory can write setpoint changes back to the PLC. The system adjusts fryer temperature or belt speed automatically to keep quality within spec — no operator intervention required.
Audit-Ready Quality Logs
Every prediction, alert, and corrective action is logged with a timestamp and operator ID. iFactory generates FDA-compliant quality reports for every shift, batch, and SKU — ready for your next third-party audit.
Predictive quality isn't a science project — it's a $1.7M annual savings opportunity that takes 6–12 weeks to deploy. Book a 30-min walkthrough and we'll show you live on your data.
iFactory Delivers Predictive Quality Without the Headaches
Every promise below is built into the iFactory deployment — not optional add-ons or future roadmap items.
End-to-End Turnkey Deployment
iFactory connects to your line data, builds the AI model, deploys the dashboard, and trains your operators — all in 6–12 weeks. Your team doesn't touch a single line of code.
100% On-Premise — No Cloud Dependency
iFactory runs on an NVIDIA appliance on your plant network. Zero data leaves the facility. No cloud latency, no data egress fees, no cybersecurity exposure.
Pilot-to-ROI in One Quarter
Most pilots show measurable quality improvement and cost savings within the first 90 days. We guarantee a pilot that demonstrates value before you commit to a full rollout.
Works with Existing Line Controls
iFactory connects to Allen-Bradley, Siemens, Rockwell, and any OPC-UA or Modbus-compatible PLC. No rip-and-replace of your existing control system.
24x7 Managed Service
iFactory operations team monitors your models and infrastructure around the clock. If a model drifts or a sensor fails, we detect it and fix it — you don't need an on-site data team.
Absorbs Legacy Plant Systems
If you're migrating off SAP MII / ME / PCo, iFactory absorbs the operational role — real-time quality monitoring, data historian, and reporting — with a lower total cost of ownership.
Real Answers from Snack Food Operations Leaders
Stop Reacting to Quality Problems. Start Predicting Them.
iFactory gives your operators a 15-minute look-ahead on moisture, color, and texture — and saves your plant $1.7M per year in scrap and rework. The pilot takes 6–12 weeks. The ROI shows up in one quarter.