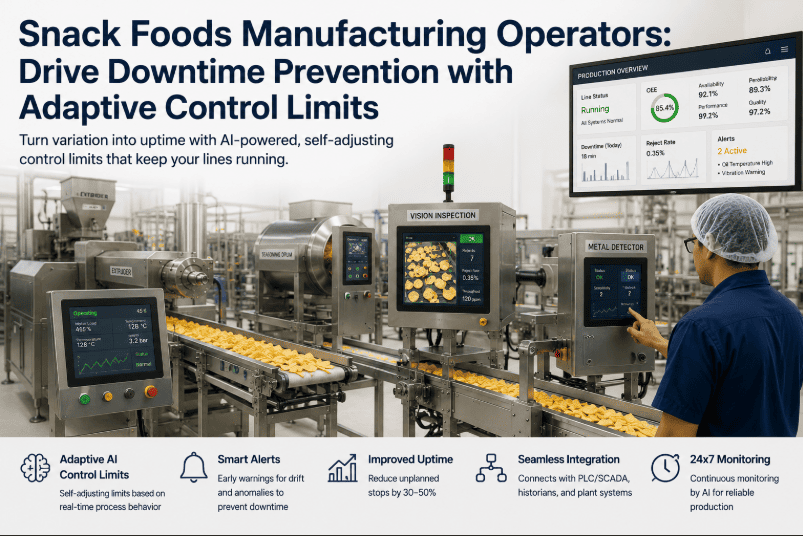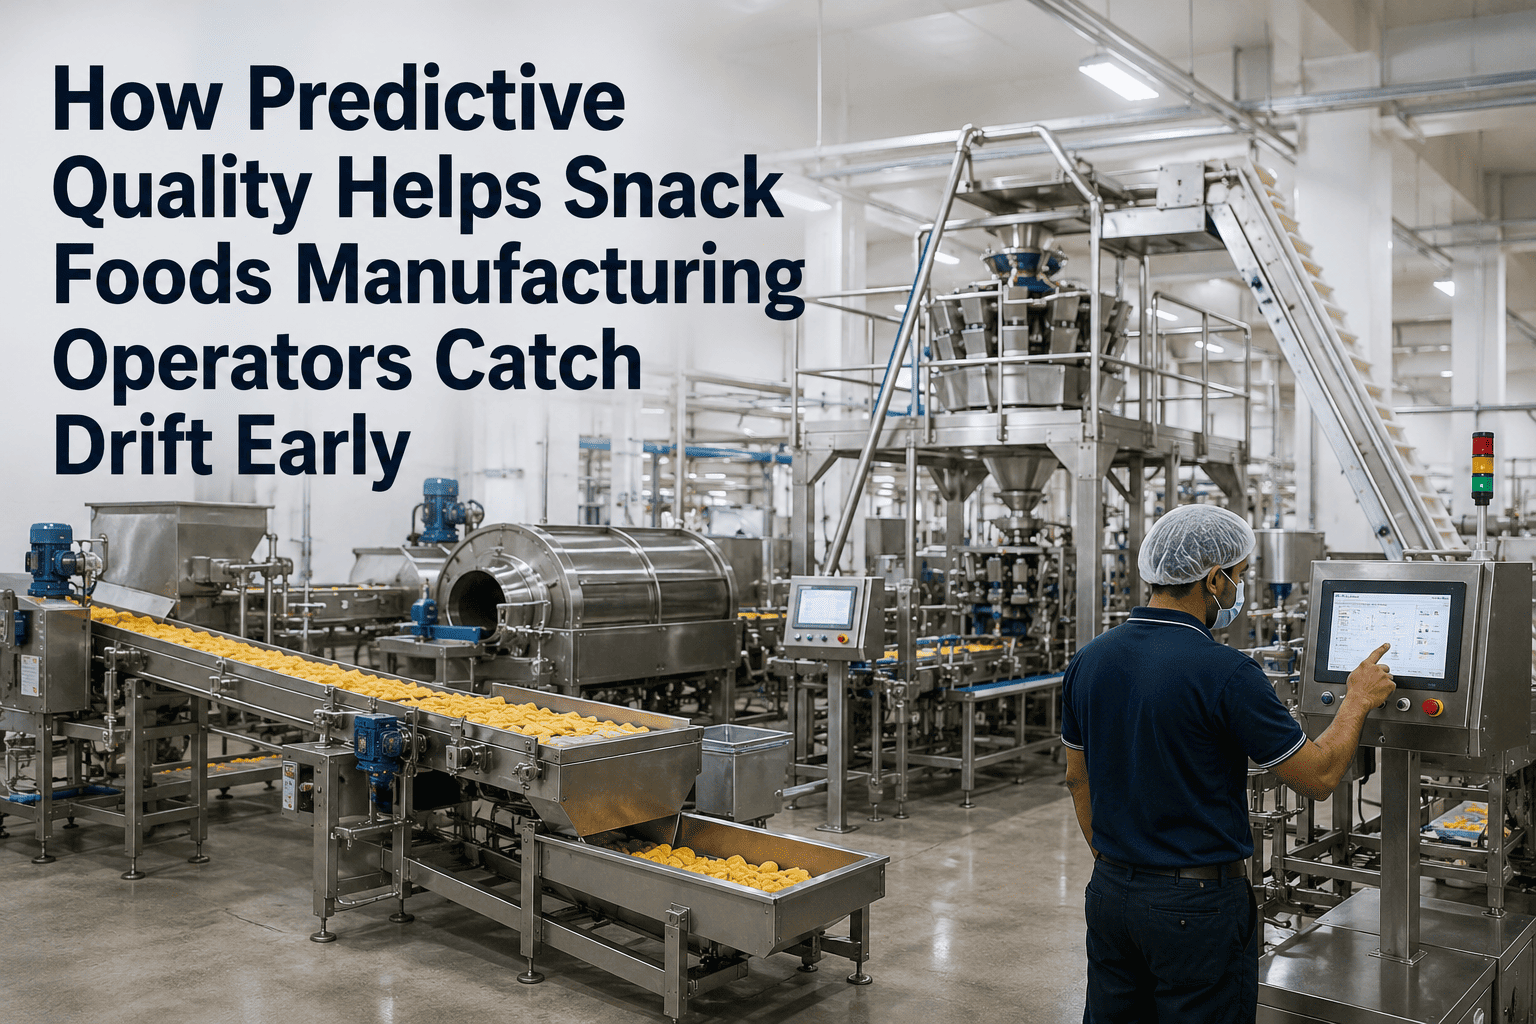
Snack foods lines operate as integrated systems — extruders feed fryers, weighers fill packages, seasoning drums coat product. When any component drifts, the entire line's effectiveness drops. A multi-head weigher drifting ±2% off-spec creates overfill penalties and material waste. An extruder losing SME (specific mechanical energy) produces less-dense product. A fryer temperature creeping up burns 3-5% of the batch. These are not individual equipment problems — they're OEE (Overall Equipment Effectiveness) problems that compound across the shift. Most operators discover OEE losses reactively: "Why is the line running at 68% OEE today instead of yesterday's 82%?" By then, the damage is done. Predictive OEE changes this by continuously monitoring the drivers of equipment effectiveness — speed, material consistency, thermal efficiency, quality yield — and predicting OEE loss before it happens. This shifts operators from reactive fire-fighting to proactive performance management. To see Predictive OEE working on your line, schedule a live demo with our team.
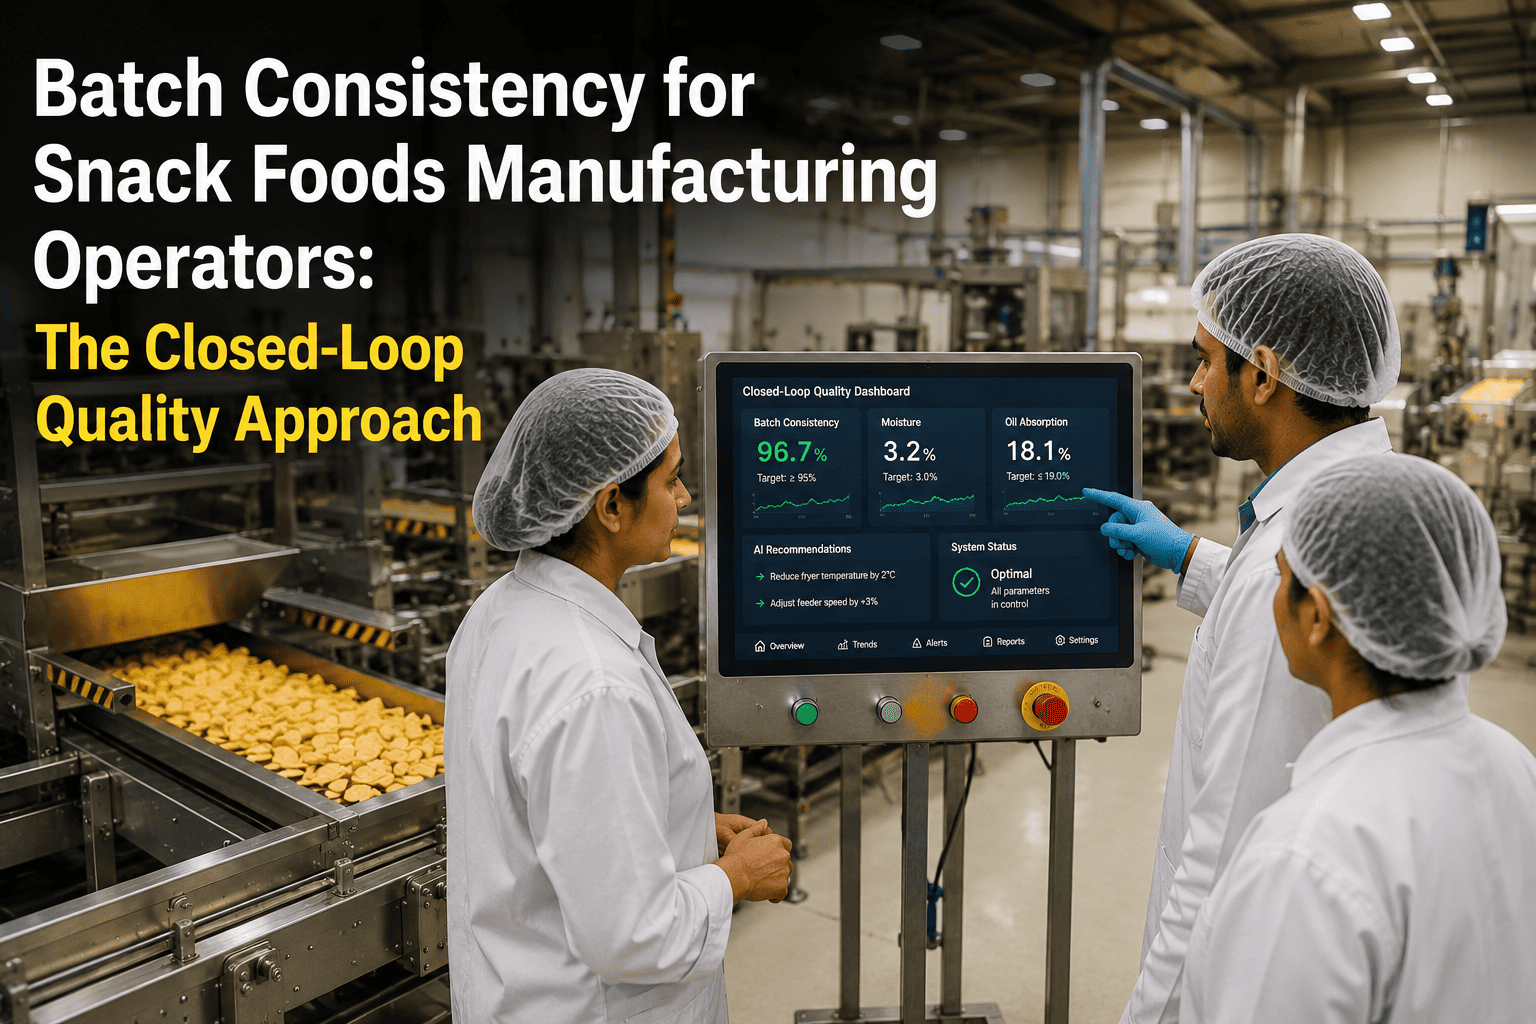
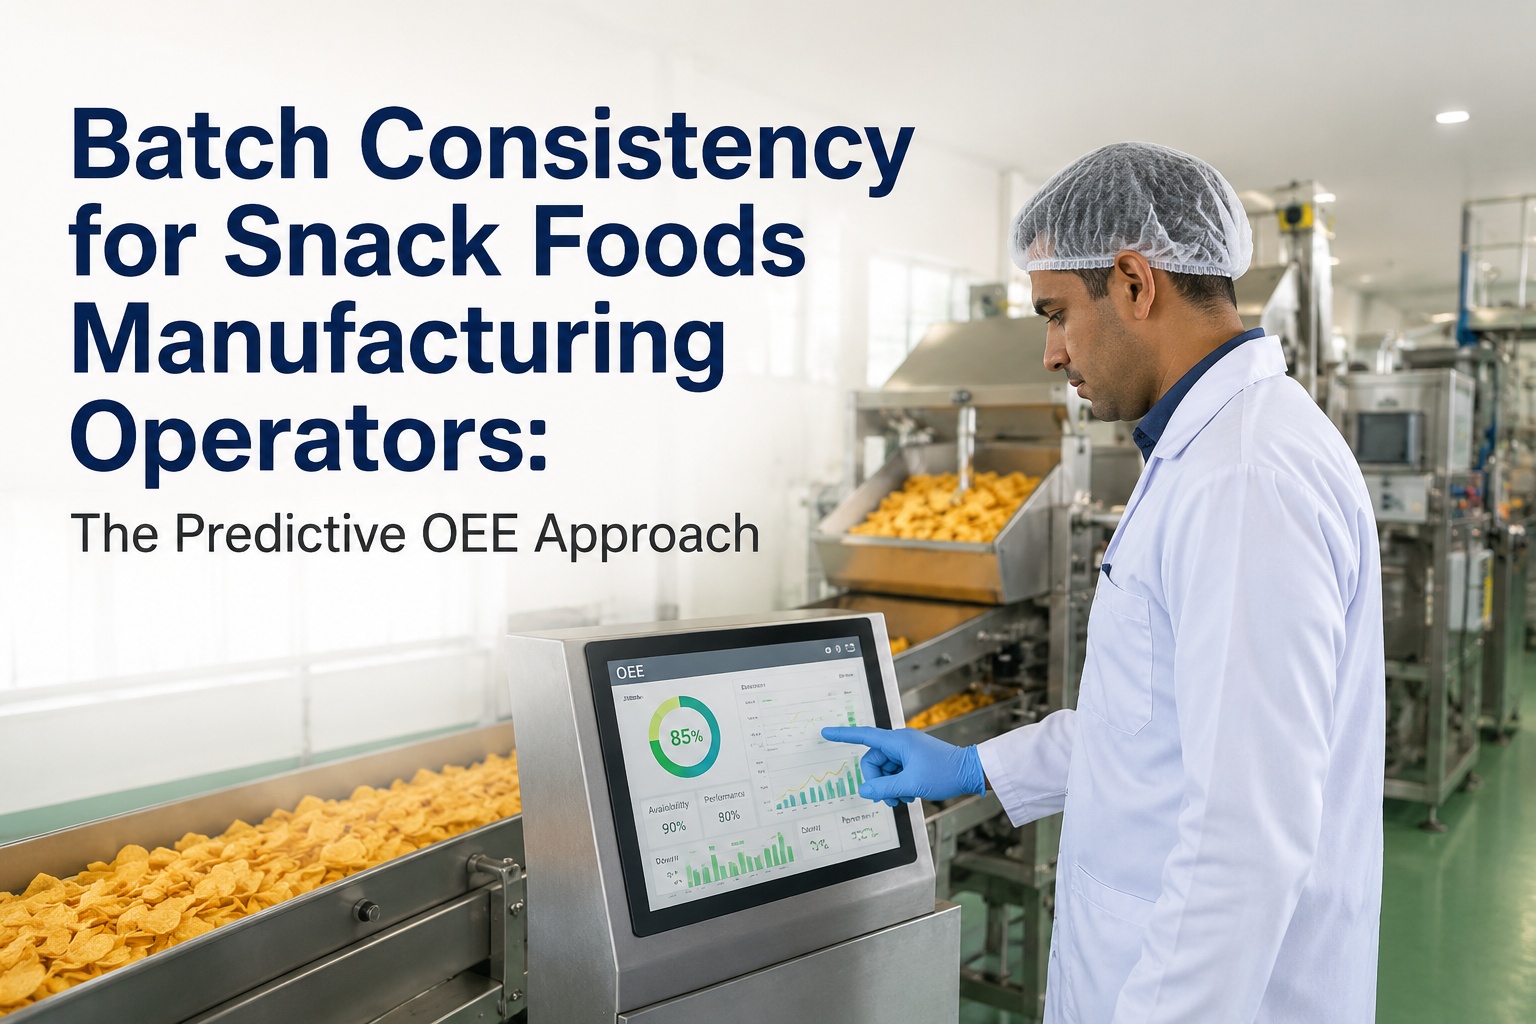
Batch Consistency for Snack Foods Manufacturing Operators: The Predictive OEE Approach
Real-time OEE tracking · Drift prediction 48-72 hours ahead · Multi-head weigher stability · Extruder SME optimization · Fryer quality consistency · Shift-level performance alerts.
The Problem: OEE Losses Are Invisible Until They're Catastrophic
Your line's OEE is the product of three factors: Speed (how fast you run), Quality (how much passes inspection), and Availability (how many hours per shift you actually run). You can see each factor independently — "Line running at 450 units/min" (speed), "98.2% first-pass yield" (quality), "47.5 hours per 50-hour shift" (availability). But you cannot see how these factors interact or predict which one will degrade next. A multi-head weigher starts drifting on Monday — you don't notice because quality is still 98%. By Wednesday, drift reaches ±3%, yield drops to 94%, and you're throwing away 6% of material. An extruder bearing degrades over 72 hours — speed stays constant while material throughput (SME) declines, creating less-dense product. By the time you notice the problem, you've already run 10,000 units through the line. Predictive OEE eliminates this blind spot by continuously analyzing the drivers of OEE — material density, weigher consistency, thermal efficiency, vibration patterns — and predicting which component will fail and when.
How fast the line runs vs. design capacity. Extruder screw speed, fryer conveyor speed, packaging line throughput.
First-pass yield — how much product passes inspection without rework or scrap. Weight variance, color uniformity, density compliance.
Actual production time vs. scheduled time. Unplanned downtime, material jams, changeovers, maintenance stops.
How Predictive OEE Works: Real-Time + Forward-Looking
Weight variance per head, load cell consistency, mechanical wear detection. Predicts drift before ±2% off-spec occurs.
Specific mechanical energy, barrel temperature, motor current, material bulk density. Detects bearing wear, feed inconsistency, recipe drift.
Oil temperature consistency, residence time, thermostat response, oil degradation rate. Predicts temperature creep and color shift.
Drum speed, nozzle pressure, spray pattern consistency. Detects bearing degradation, nozzle clogging, feed hopper issues.
Product flow consistency, seal temperature, carton position, package weight. Predicts jams 5-10 minutes before they occur.
Real-time OEE calculation (Performance × Quality × Availability). Shift-level and day-level trending with driver attribution.
What Changes for You as an Operator
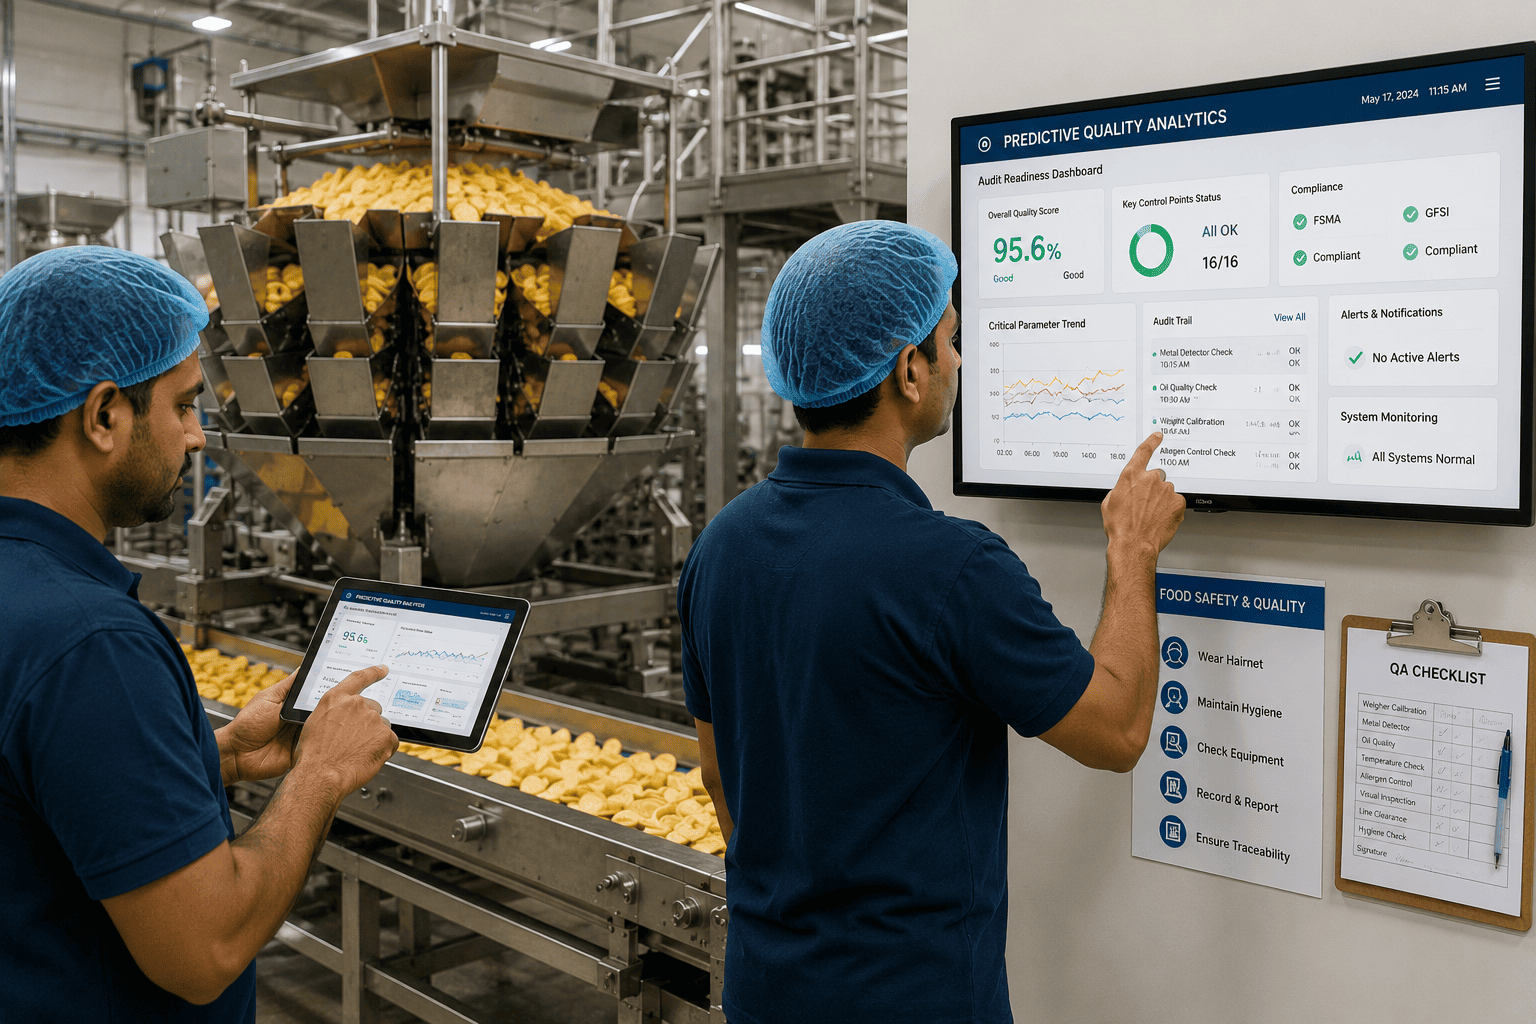
Dashboard shows yesterday's OEE (82.4%), today's target (85%), and predicted shift OEE based on current equipment health (84.6%). You know immediately where you stand.
AI continuously monitors speed, quality, availability in real-time. OEE updates every 5 minutes. You see "OEE: 84.2% (Quality down 2.1% — weigher drift detected)" on your dashboard.
AI predicts: "Weigher head #3 will drift beyond spec within 48 hours if current wear rate continues. Recommend calibration during next break." You have time to plan, not emergency-react.
You notify maintenance, schedule calibration for lunch break. AI confirms equipment health improving. Line continues at 84%+ OEE without unplanned downtime.
Shift OEE: 85.2% — above target. No emergency fixes. No unplanned downtime. Equipment preventively maintained. Dashboard shows OEE trending up across the week.
What Predictive OEE Delivers
From 75% baseline → 85-87% through prediction + prevention
Time to prevent problems before they impact production
Predictive maintenance prevents jams and emergency stops
Speed + Quality + Availability gains = direct revenue impact
See every loss driver instantly, respond immediately
Compare your shift OEE to other lines running same product
Frequently Asked Questions
Deploy Predictive OEE on Your Snack Line
Real-time OEE tracking with 48-72 hour loss prediction. Multi-head weigher drift detection. Extruder SME optimization. Fryer quality consistency. 12-15% OEE improvement in year 1. Deploy in 6-12 weeks and start optimizing immediately.