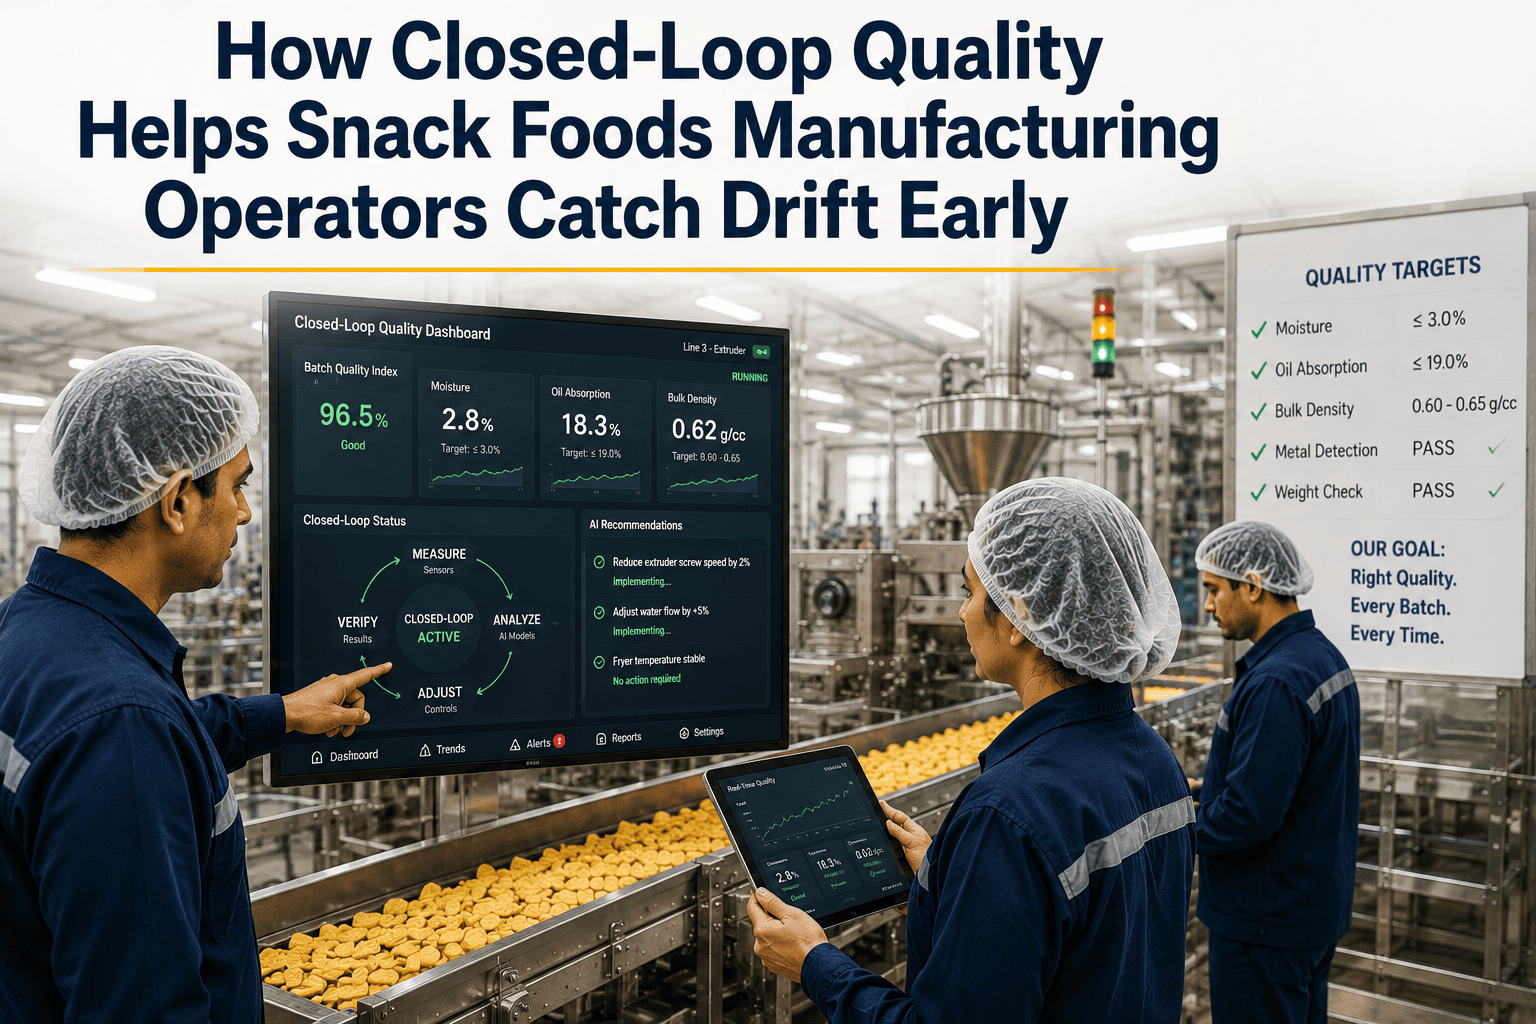
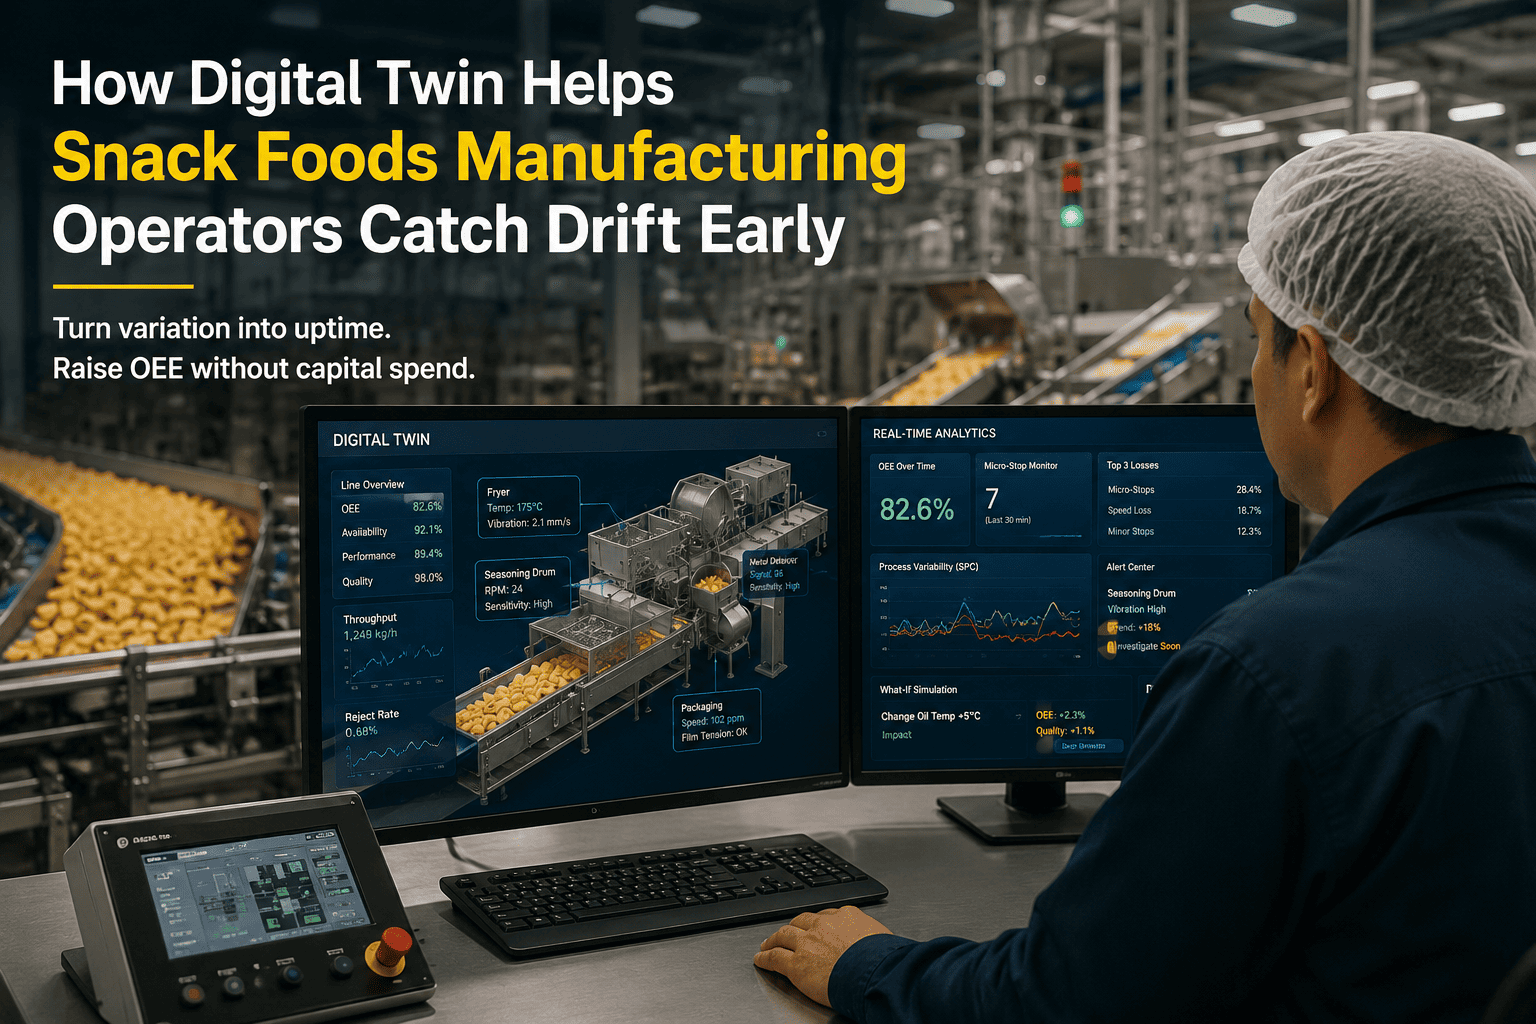
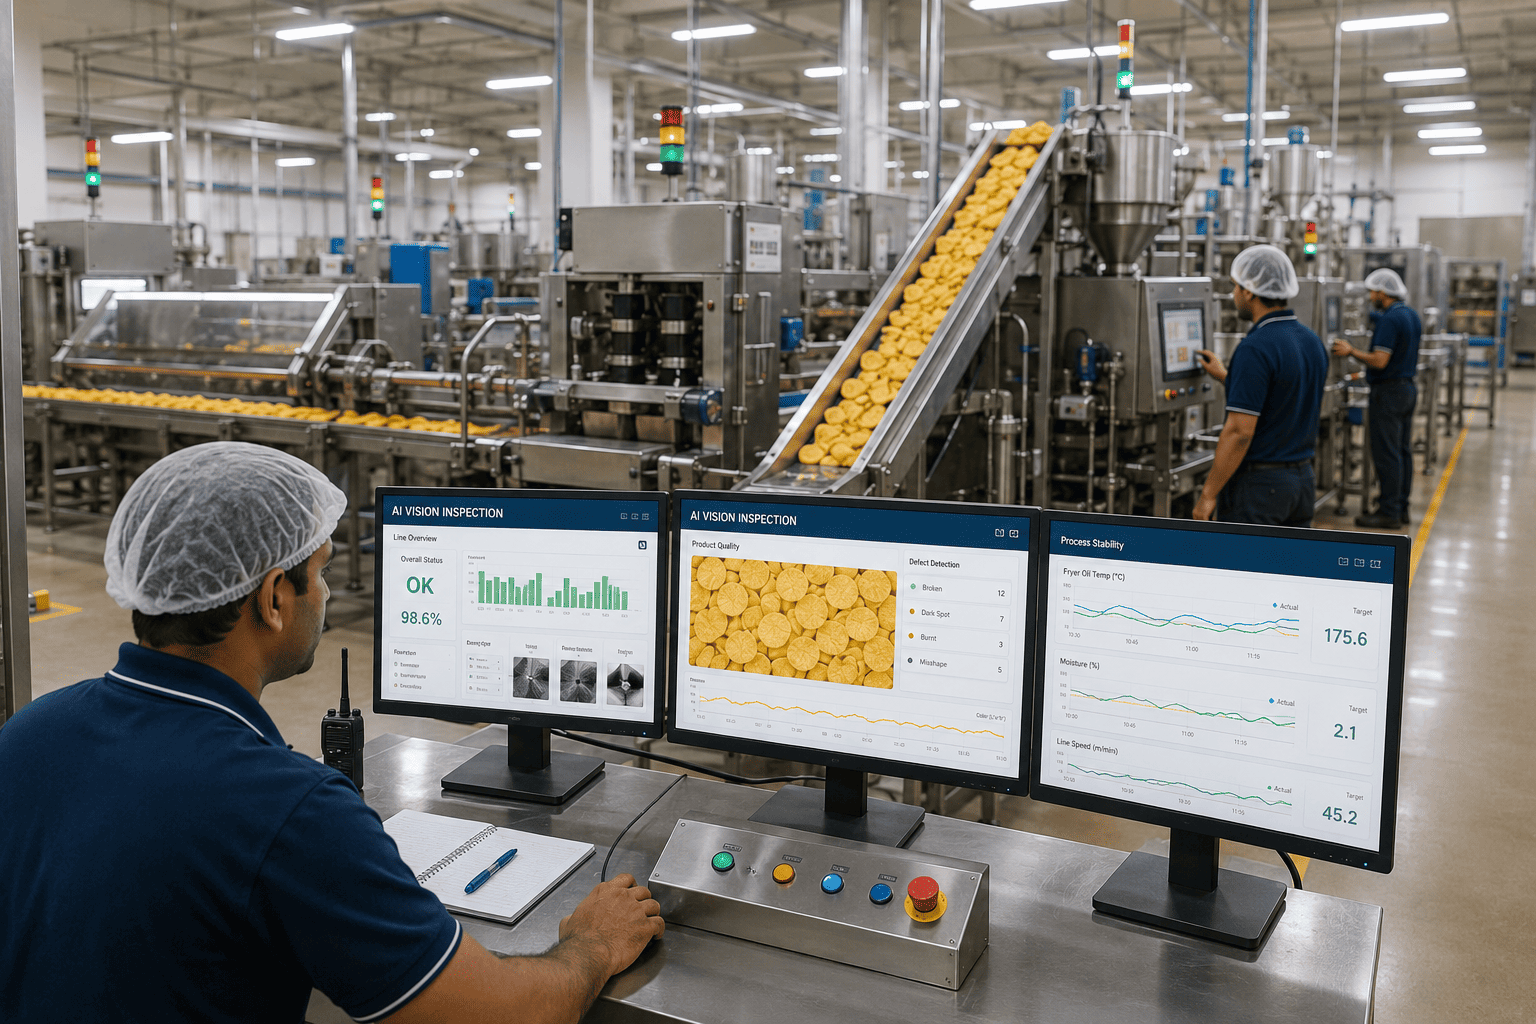
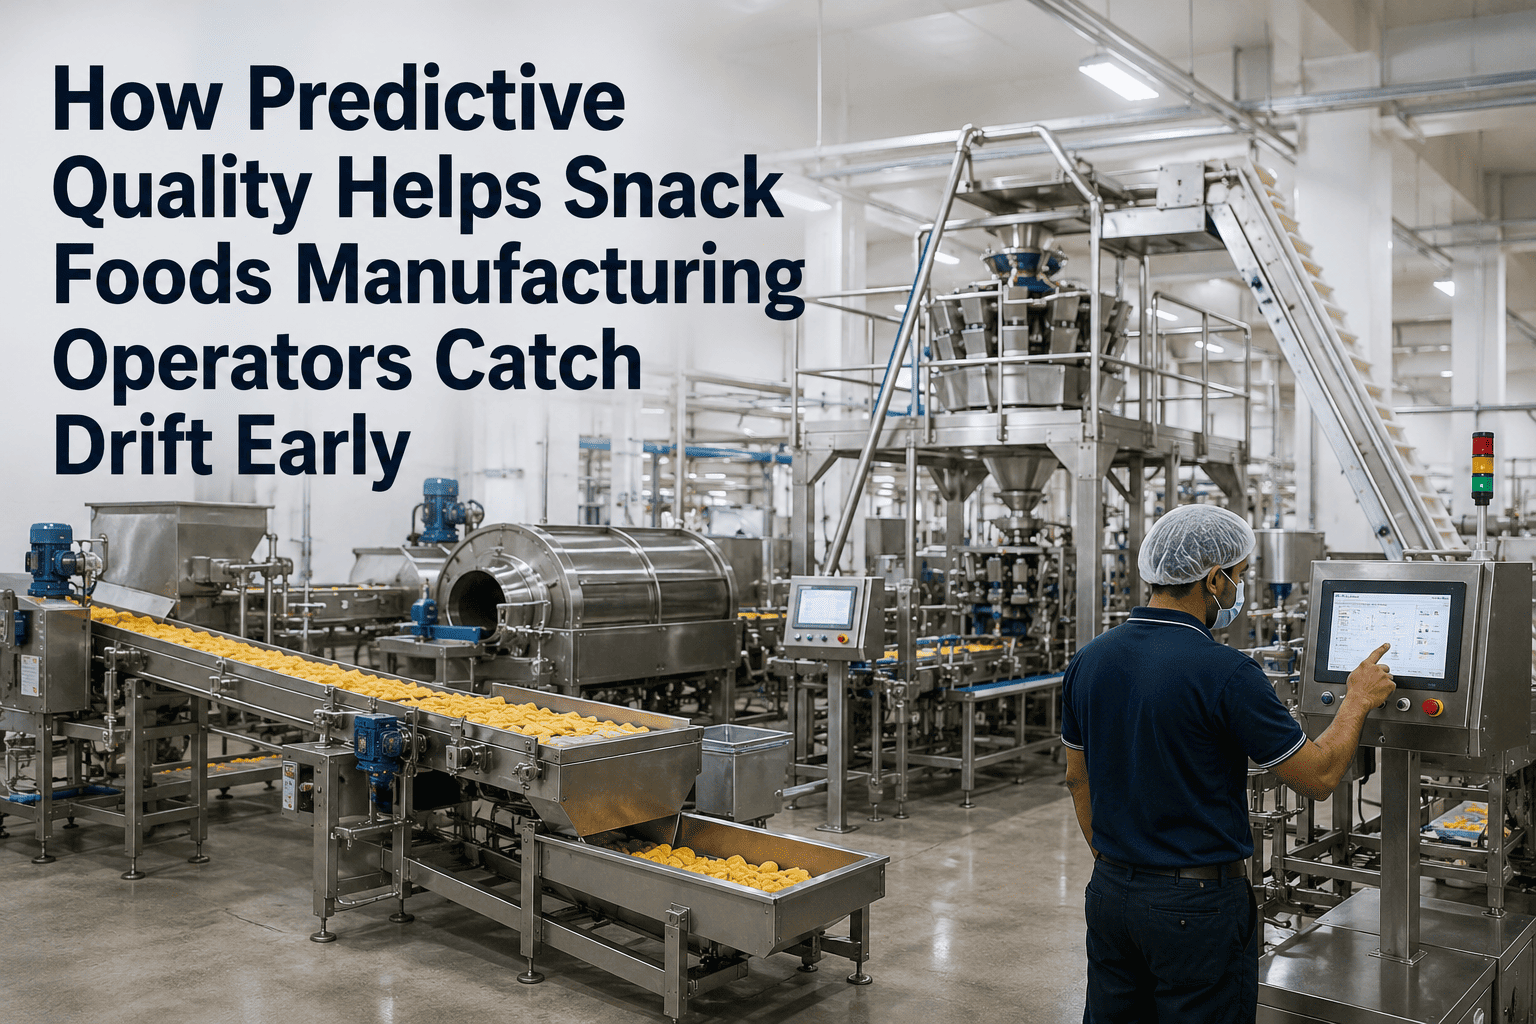
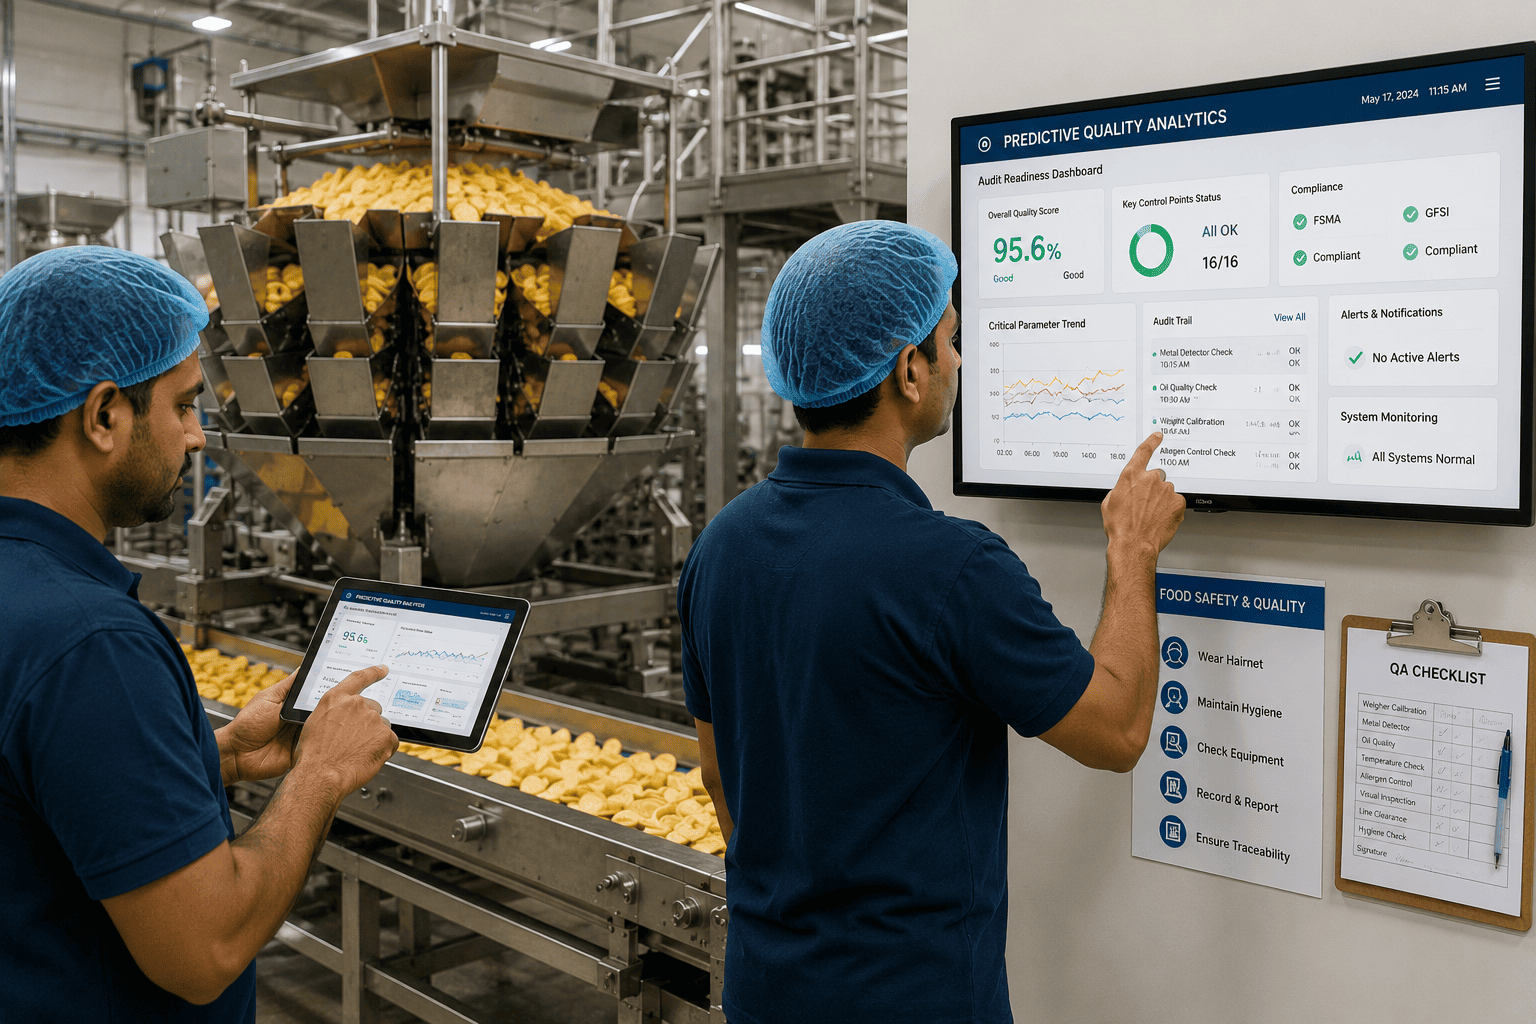
Snack food lines are deceptively stable — until they are not. A fryer oil temperature that drifts 4°C over two hours, a seasoning drum rotating 0.3 rpm below setpoint, a moisture sensor that has not alarmed but is reading outside the last validated range: none of these conditions trip a shutdown, but every one of them compounds quietly into rework batches, out-of-specification colour, and failed final weight checks that operators only see when it is already too late to correct the run. Predictive OEE gives line operators visibility into drift before the specification boundary is breached — not after. See how predictive OEE surfaces drift on your specific snack line — Book a Demo with Us.
Snack foods plants fight colour drift across fryer cycles, moisture variation across seasoning drums, and weight deviation across portioning lines. Predictive OEE keeps these processes in statistical control — giving operators adaptive limits and early warnings, not just post-shift reports.
Why Snack Foods Lines Drift Differently from Other Food Processes
Most snack foods quality defects are not caused by equipment failure in the conventional sense — no alarm fires, no shutdown occurs, no fault code appears. They are caused by gradual process drift across multiple variables simultaneously: fryer oil temperature creeping down as turnover slows, seasoning adhesion dropping as drum speed decays, finished weight drifting as portioning cam wear accumulates across thousands of cycles.
Traditional OEE tracks these losses only after they have become visible in output data — rework percentages, failed check-weights, end-of-shift quality reviews. By that point, the drift has already produced non-conforming product. Predictive OEE tracks the process parameters driving quality loss in real time and alerts operators to the drift trajectory before the specification boundary is reached. See the drift detection model running on a snack line configuration — Book a Demo with Us.
The Drift Patterns Snack Foods Operators Deal with Every Shift
Each of the following drift patterns is detectable by predictive OEE before it causes a quality loss event. Each is also invisible to conventional alarms — because conventional alarms are set at specification limits, not at the early warning thresholds where corrective action is still low-cost.
Fryer zone temperatures drift as oil turnover rate changes with production speed variation. A 3-5°C gradient between entry and exit zones that develops over two hours does not trigger any alarm — but produces colour variation across the batch that fails visual grading. Predictive OEE detects the temperature drift trajectory from PLC zone data and alerts the operator when the gradient is developing, not when the product is already baked to the wrong colour.
Seasoning drum RPM decreases gradually as drive belt wear accumulates or as oil film on the drum surface changes with temperature variation. The result is under-seasoned product that fails flavour intensity checks and generates consumer complaints. The RPM setpoint is met on the control panel while actual drum speed is 2-4% below target — a discrepancy visible in encoder data that predictive OEE surfaces before a full run is under-seasoned.
Exit moisture in baked and extruded snacks drifts upward as oven belt speed increases or burner output degrades across a shift. Inline moisture sensor readings remain below alarm thresholds while the running average climbs toward the shelf-life risk boundary. Predictive OEE monitors the moving average trajectory against adaptive control limits calibrated to your specific product specification — not generic industry defaults — and flags the trend before moisture reaches the hold-or-rework decision point.
Portioning cam wear causes a slow upward drift in mean pack weight that increases give-away without triggering any under-weight alarm. By the end of a 12-hour run, the drift may represent 2-4% excess product per pack — a direct materials cost that compounds across every run until the cam is replaced. Predictive OEE detects the drift pattern in check-weigher data and generates a maintenance alert before the give-away loss accumulates to a cost threshold.
Metal detector sensitivity degrades between scheduled test intervals as product effect changes with moisture and fat content variation across the run. The detector passes scheduled test samples while its actual sensitivity for in-line product detection has degraded below the validated threshold. Predictive OEE monitors test result patterns over time to detect sensitivity drift trends — giving operators an early warning that recalibration is needed before the next scheduled test interval, not after a missed-detection event.
Cooling belt speed variation changes the time product spends in the cooling zone, affecting final texture and moisture equilibration. Belt speed drift of 2-3% from setpoint — caused by drive inverter wear or tension variation — produces products that are either over-cooled and brittle or under-cooled and too soft for target crunch specification. Neither condition triggers an alarm; both conditions are detectable in drive inverter data that predictive OEE monitors continuously.
How Predictive OEE Works for Snack Line Operators
iFactory's predictive OEE platform connects to existing PLC and SCADA infrastructure and layers AI-driven statistical process monitoring on top of the sensor data already being collected. Operators get an adaptive-limit dashboard that shows current process state, drift direction, and time-to-limit estimates — not just current readings against fixed alarm thresholds.
The pre-configured AI server connects to existing PLC tags and SCADA historian without requiring new sensors or control system changes. Fryer zone temperatures, drum encoder signals, belt speed drives, inline moisture readings, and check-weigher outputs are all ingested from the tags already being logged by the control system — no new instrumentation required in most deployments.
Control limits in the predictive OEE platform are not generic industry defaults — they are calculated from your process's own historical behaviour during validated good-quality production runs. This means limits reflect the actual natural variation of your specific line, your specific product mix, and your specific operating conditions — producing fewer false alerts and earlier detection of genuine drift than fixed-limit alarm systems.
The operator dashboard shows each monitored parameter with its current value, its adaptive control limit, and an arrow indicating whether the parameter is drifting toward the limit and at what rate. Operators see at a glance which parameters are stable, which are drifting, and which are approaching a threshold requiring intervention — without having to interpret trend charts or calculate slopes manually during a running shift.
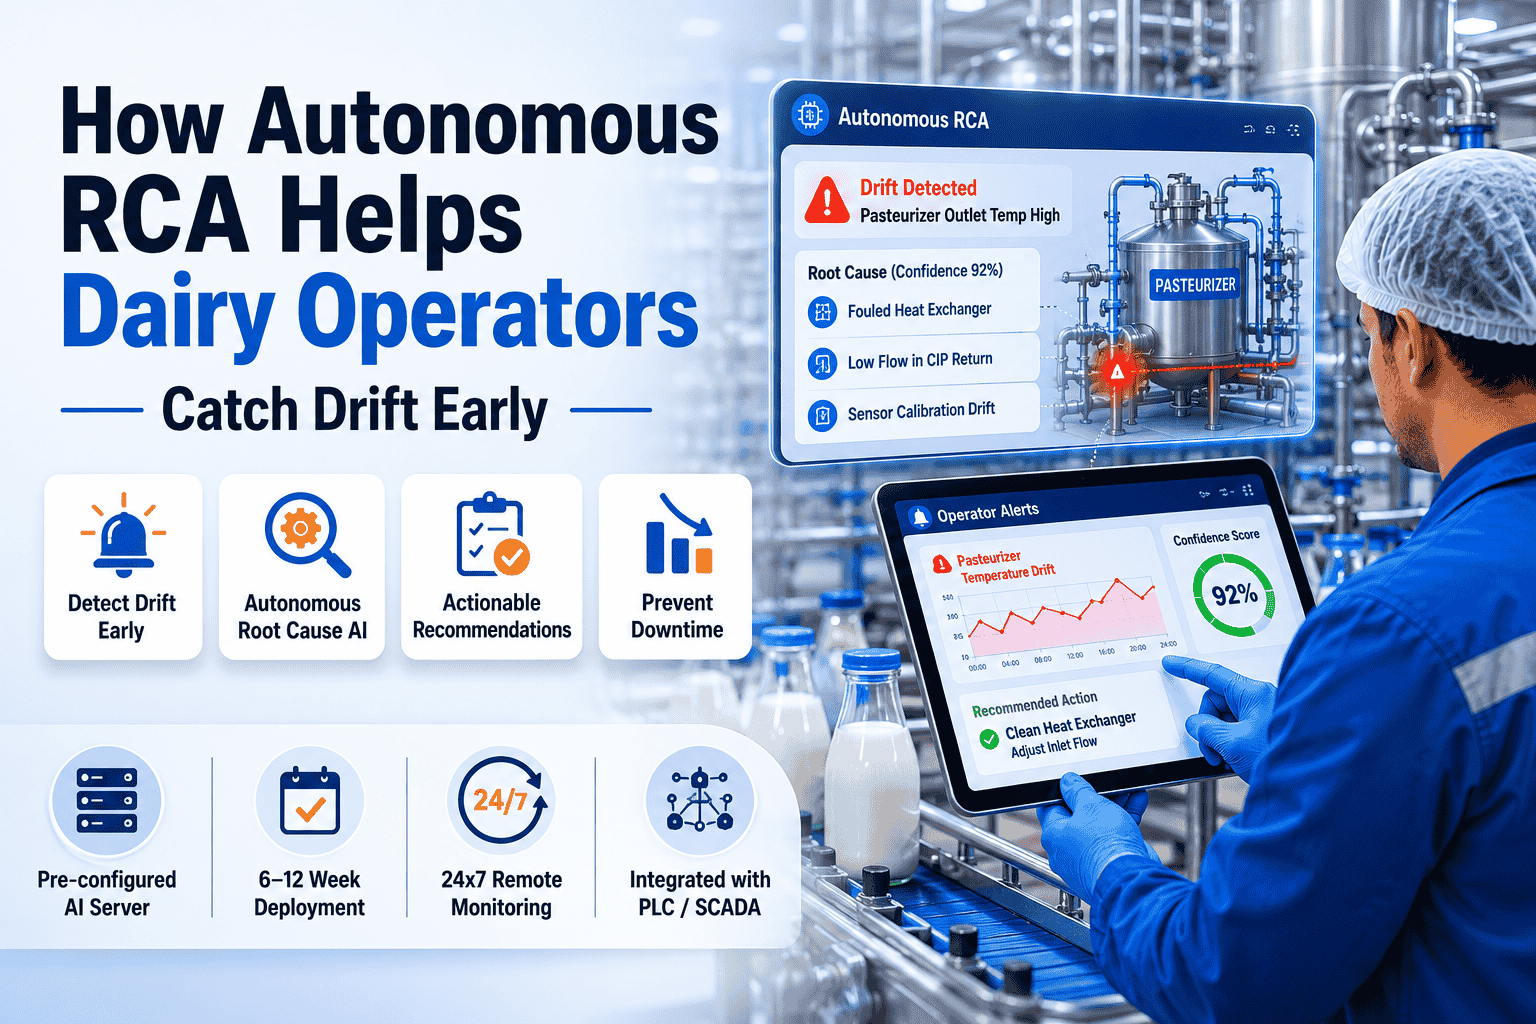
When a parameter approaches its adaptive limit, the platform generates an alert that includes the parameter name, the current drift rate, the estimated time to limit breach, and the OEE loss category the drift is being attributed to — quality, performance, or availability. Operators receive actionable context, not just a notification, so the response to the alert is clear before the process reaches the intervention point.
At the end of each shift, the platform generates a handover summary that lists all drift events detected during the shift, the actions taken, the OEE loss attributed to each event, and any parameters still trending toward limits at handover. Incoming operators start their shift with a complete picture of process state — not a verbal briefing that leaves out the three drift events from the last two hours of the previous shift.
All predictive processing runs on a pre-configured AI server deployed on-site. Real-time drift detection and operator alerts are not dependent on internet connectivity or cloud latency — the system monitors and alerts 24x7 regardless of network state. This matters in food plants where connectivity is inconsistent across production zones, and where regulatory requirements limit where cloud-processed data can reside.
What iFactory Predictive OEE Delivers on Snack Lines
iFactory's OEE analytics platform is deployed across food and beverage manufacturing lines. These outcomes reflect documented platform performance. Individual results depend on line configuration, baseline OEE, and process complexity.
Documented range across food manufacturing deployments. Drift detection converts quality losses into preventable events before specification is breached.
Predictive alerts on equipment drift patterns — drive wear, heater degradation, sensor deviation — convert emergency stoppages into planned interventions.
Continuous timestamped process records from PLC feeds satisfy FDA 21 CFR Part 11, SQF, and BRC process monitoring documentation requirements automatically.
From PLC connection to live operator dashboard in 6 to 12 weeks. Pre-configured AI server. No line modification or production interruption during deployment.
Predictive OEE vs Standard OEE: What Operators Actually See Differently
| Operator Experience | Standard OEE Dashboard | Predictive OEE Dashboard |
|---|---|---|
| Fryer temperature drift | Shows current temperature vs setpoint — no drift direction | Shows temperature trend trajectory and time to adaptive limit breach |
| Quality loss detection | Quality loss appears in end-of-shift OEE report after product is made | Drift alert generated before specification boundary is reached |
| Seasoning variation | Drum RPM shown as on-setpoint from control panel reading | Encoder-based actual speed vs setpoint discrepancy shown with drift rate |
| Moisture creep | Current moisture reading vs fixed alarm limit | Moving average trajectory against adaptive limit with estimated time to exceedance |
| Metal detector status | Last test result shown — pass or fail | Sensitivity trend across last N tests with degradation trajectory flagged |
| Shift handover | Verbal briefing or manual log entry by outgoing operator | Auto-generated handover summary with all drift events, actions, and open trends |
| Loss attribution | Total OEE figure with quality, performance, availability split | Each drift event attributed to specific loss category with estimated product impact |
| Alert context | Alarm fires at specification limit — corrective action is already late | Alert fires at adaptive early warning threshold with recommended response attached |
Frequently Asked Questions
Predictive OEE for snack foods lines. Pre-configured AI server. PLC and SCADA connected. Operator dashboard live in 6 to 12 weeks with no line modification required.