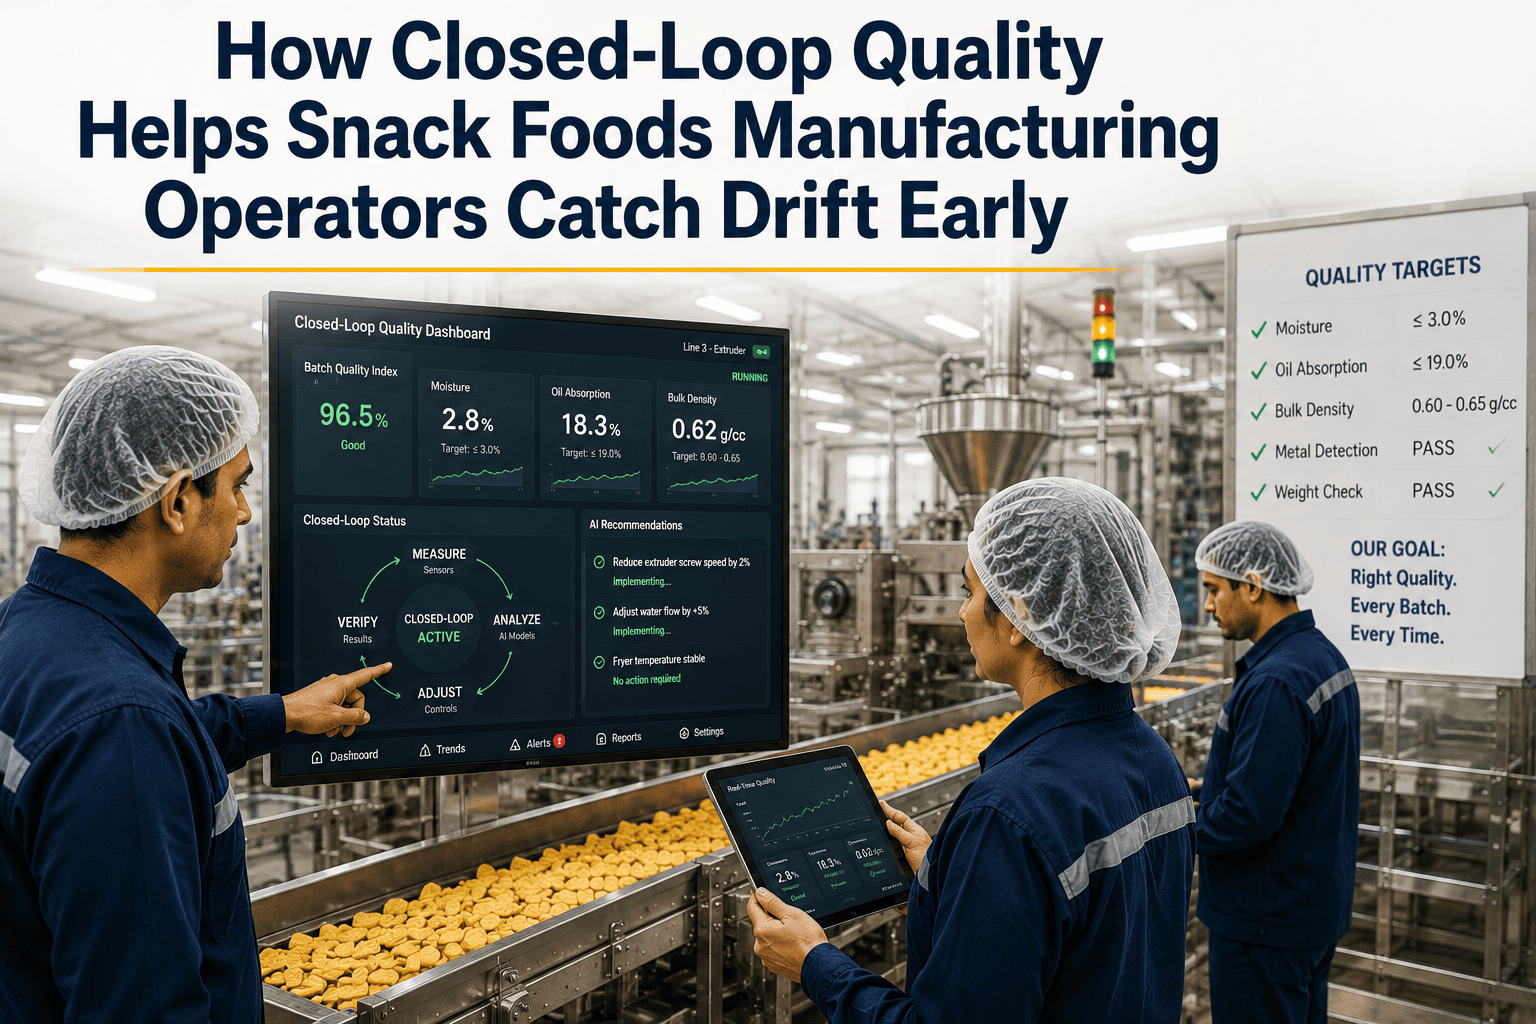
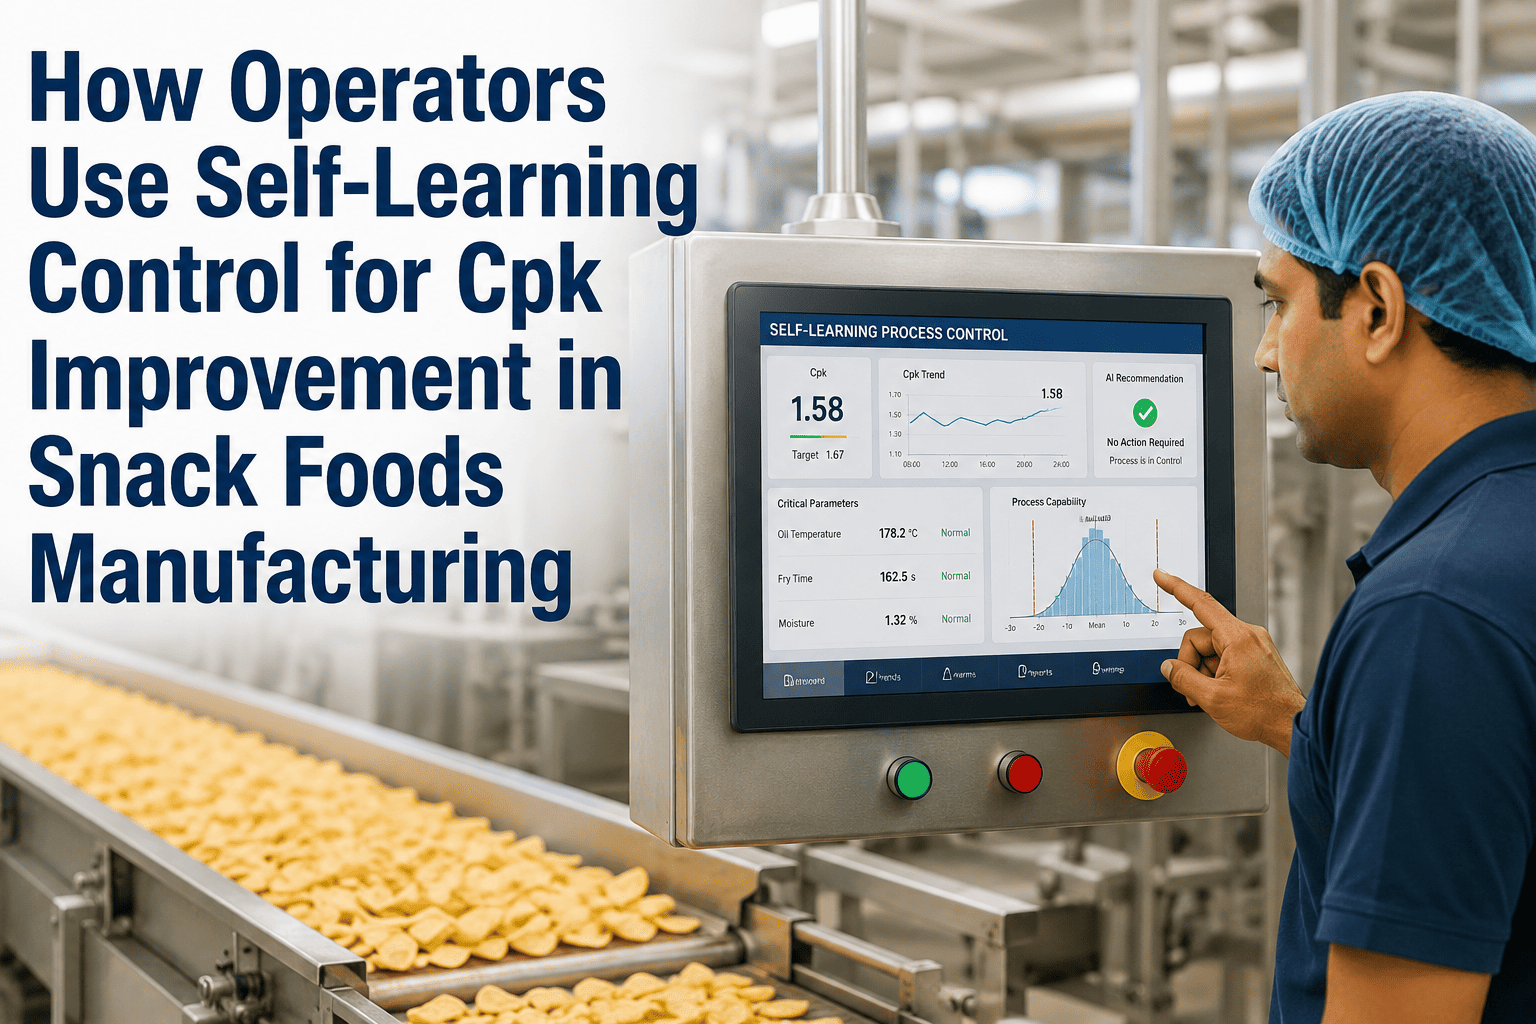
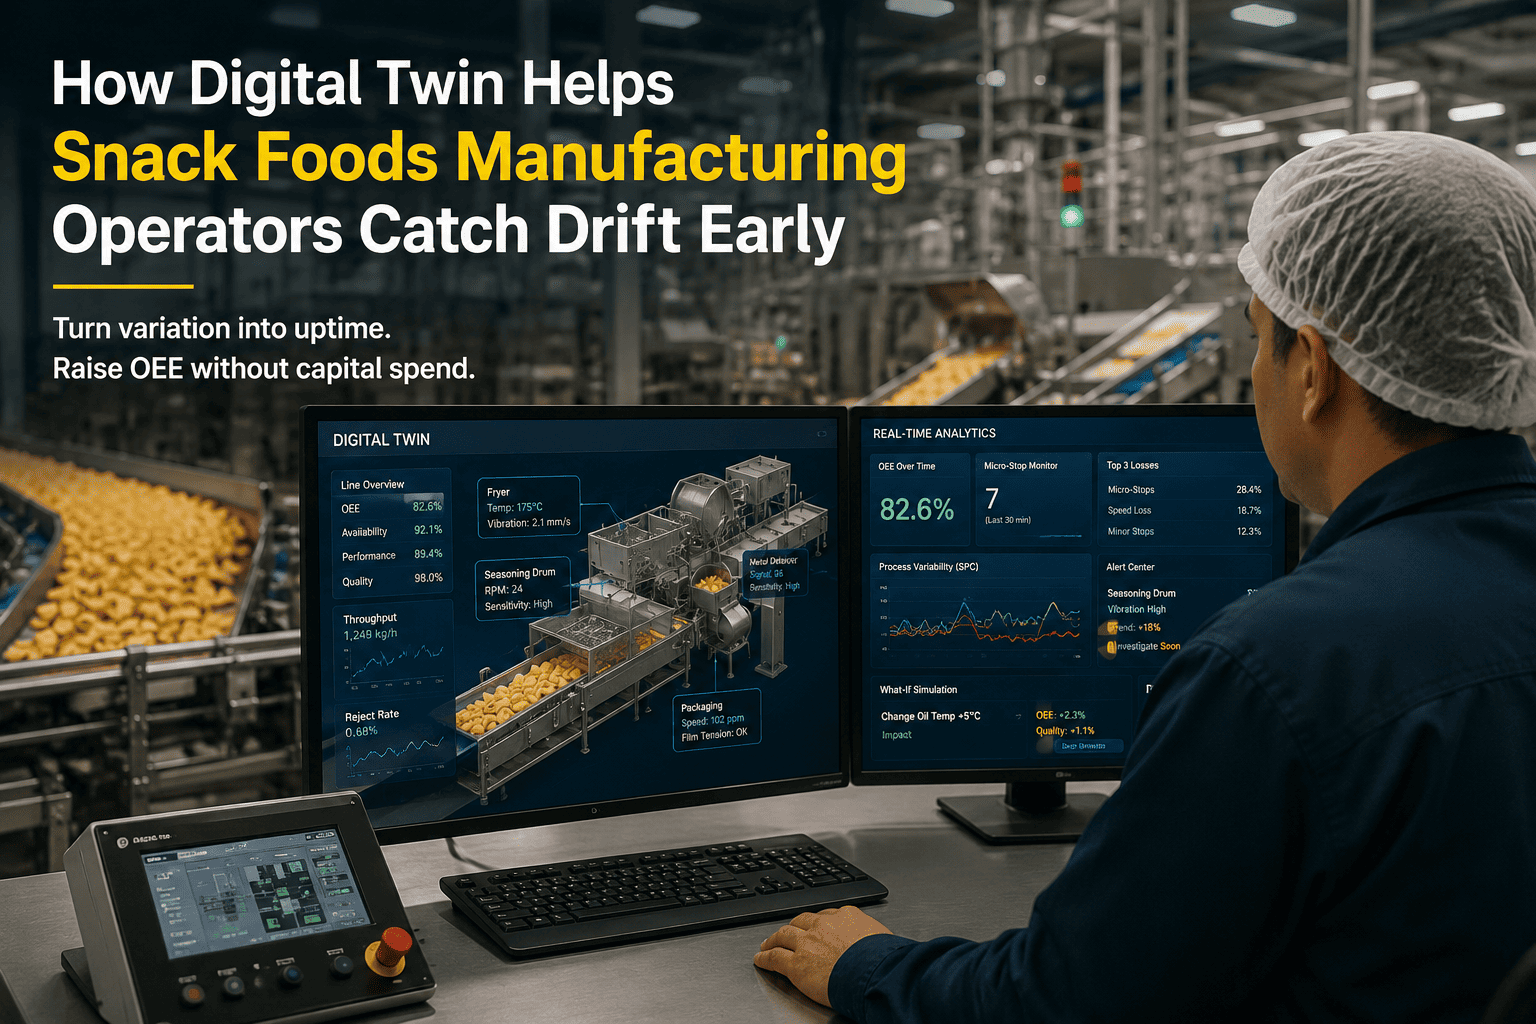
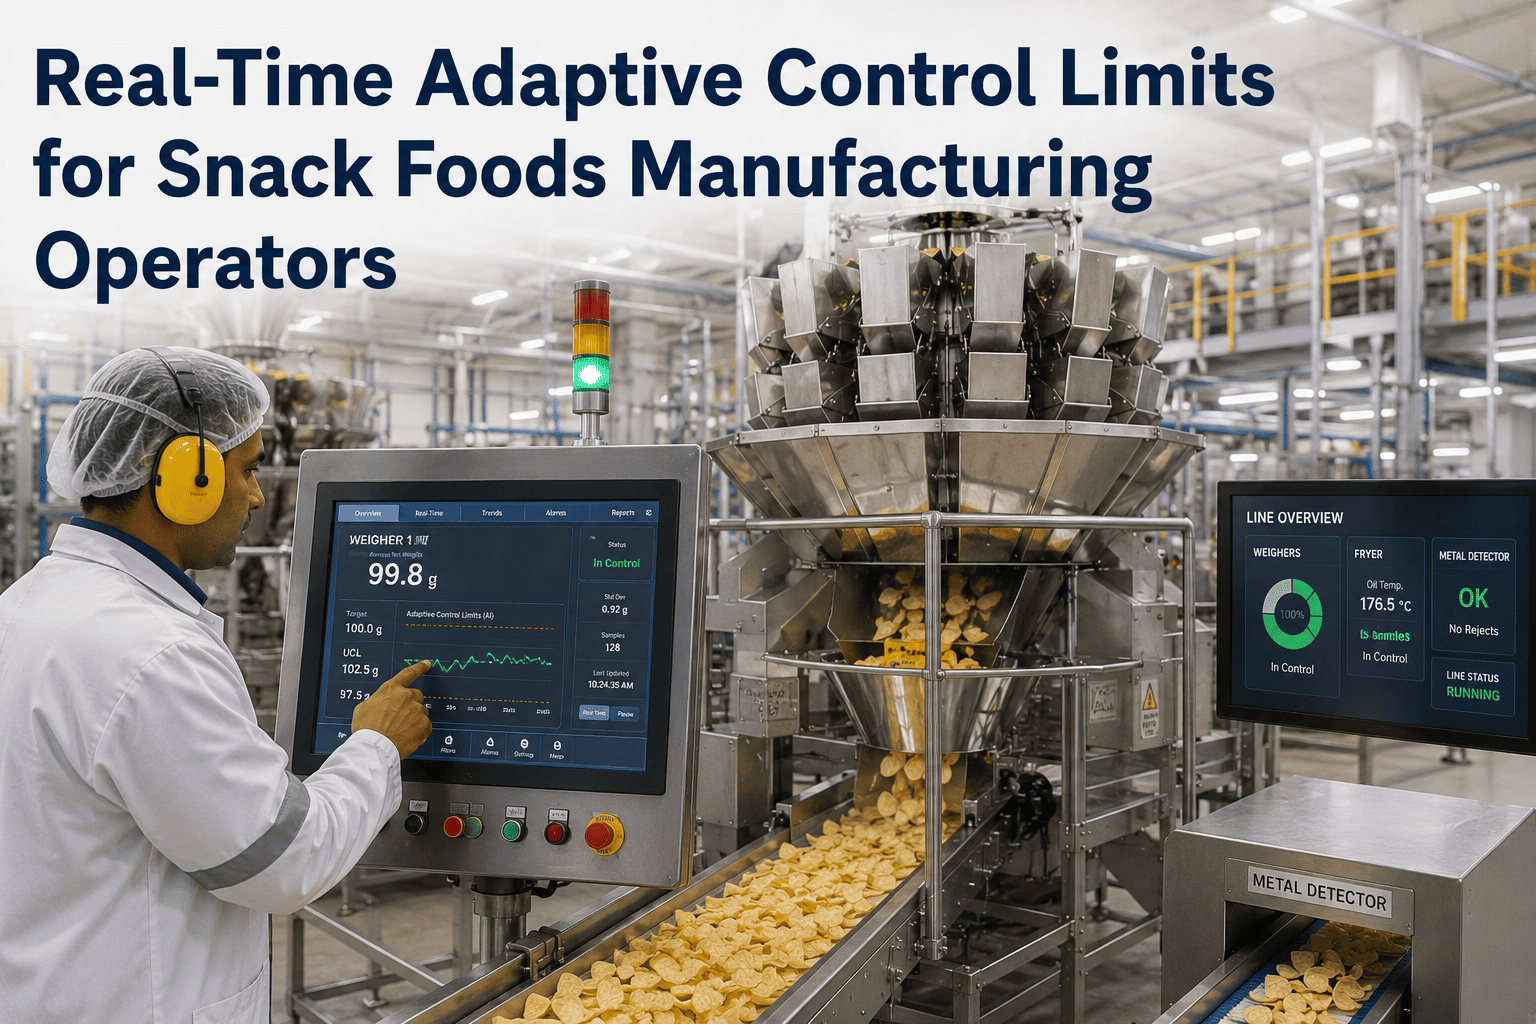
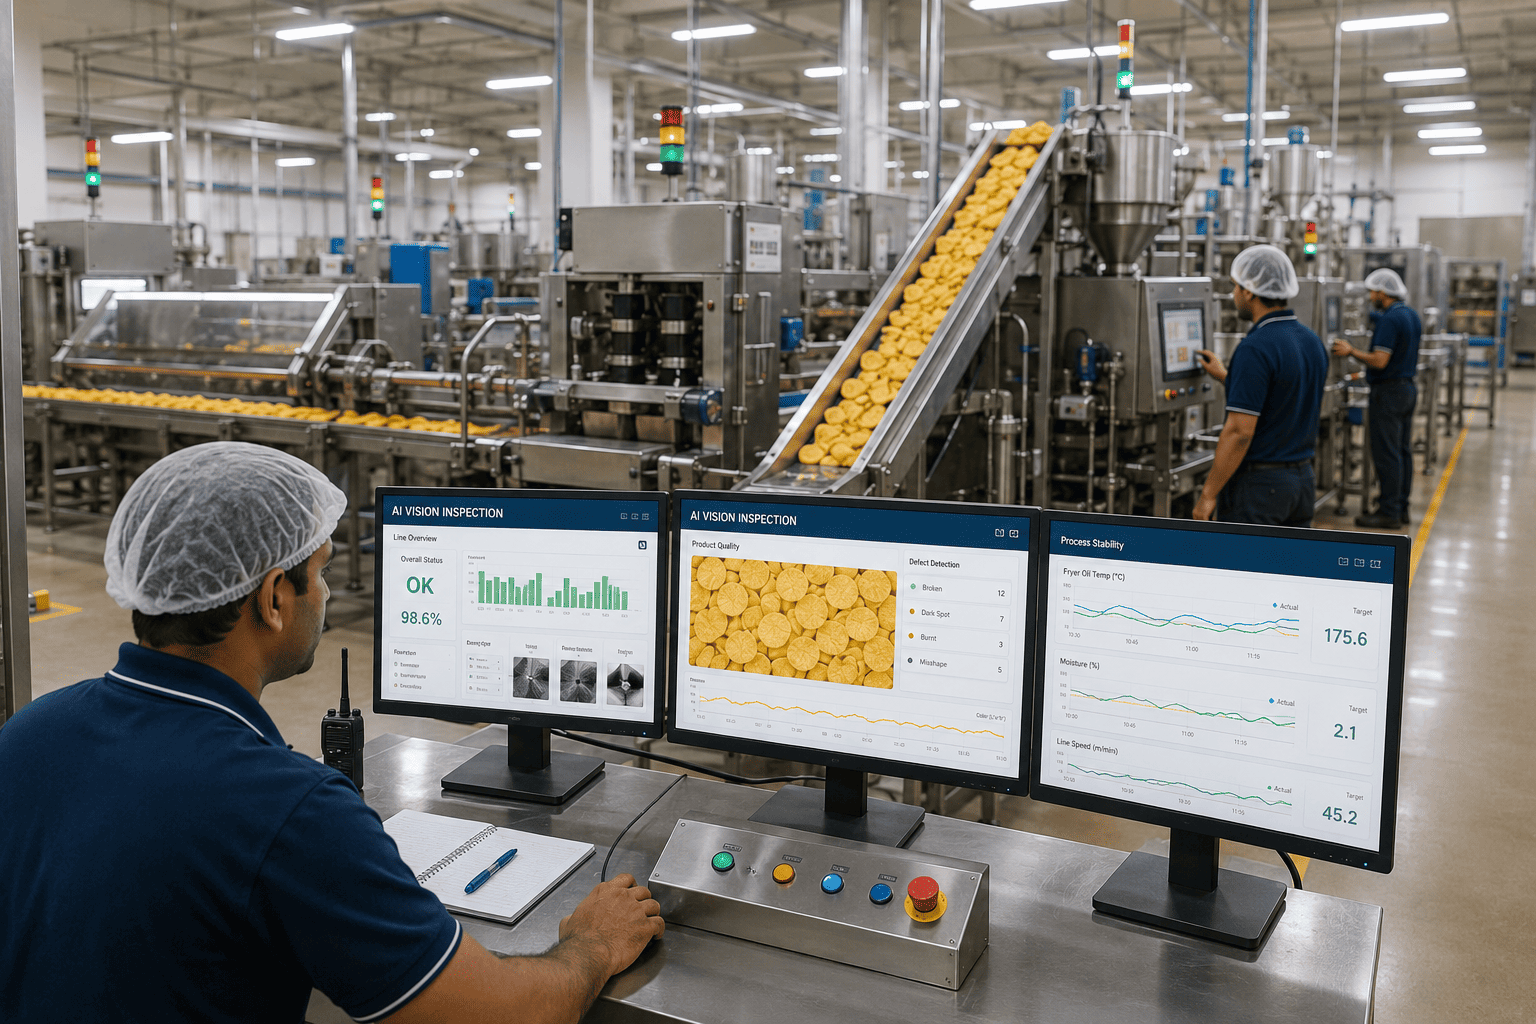
Elena, the fryer operator on the afternoon shift at a regional snack-foods plant, watches the color chart like a hawk. She knows that when the L-value on the fryer's inline color sensor drifts just 0.5 units — a shift too small for the legacy SPC chart to flag — the entire batch of kettle chips starts taking on a pale, under-cooked look. By the time the lab confirms the defect 45 minutes later, 3,200 bags have already been packed and palletized. That's $18,000 in finished goods that will be downgraded to "animal feed" or destroyed. This scene plays out on every shift, at every plant, every single day. The standard approach — waiting for a sample to be pulled, tested, and charted — is a rearview mirror. What operators need is an AI that watches every second of production data and signals the moment a process starts to drift, not after the defect has already been packed.
Stop catching defects. Start catching drift — with AI-powered SPC that watches every second of production.
iFactory's on-premise AI analyzes every data point from every sensor in real time, giving operators a 15- to 45-minute early warning before a process goes out of spec. No cloud dependency. No data egress. No waiting for the lab.
Why traditional SPC is failing your operators — and your P&L
Statistical Process Control has been the backbone of quality in snack foods for decades. But the standard approach — periodic sampling, manual charting, lab confirmation — was designed for an era when data was expensive and computing was slow. Today, every fryer, oven, and seasoning drum generates thousands of data points per minute. The gap between what's happening on the line and what the control chart shows is where money leaks out. Here's how.
The "wait for the lab" cycle costs $18K per incident
In a typical potato chip line, operators pull a sample every 30 minutes. The lab runs moisture, oil, and color — results come back 45 minutes later. By then, any drift has already produced 3,000+ bags of out-of-spec product. At $6 per bag in raw materials and packaging, each incident burns $18,000 in downgrade costs. A plant running three shifts can see 15–20 such incidents per month.
Legacy SPC charts miss the "slow creep" that precedes a crash
Standard X-bar and R charts are designed to detect large, sudden shifts — a sensor failure, a burner outage. But the most common defect pattern in snack foods is gradual drift: oil temperature rising 0.3°F per hour, seasoning application rate dropping 0.1g per bag per shift. These subtle changes fall within the control limits until they don't. By the time the chart signals an out-of-control condition, the process has been drifting for hours and thousands of bags are affected.
Manual data entry introduces human latency and error
Most snack plants still rely on operators to transcribe gauge readings onto paper charts or into spreadsheets. A 2024 industry survey found that 23% of all SPC data points are recorded with a delay of more than 10 minutes, and 7% contain transcription errors. When the data is wrong, the control limits are wrong, and the decisions based on them are wrong. Operators lose trust in the system and start overriding alarms — a dangerous cycle that leads to even more defects.
Multi-variable interactions are invisible to univariate charts
A chip's final color isn't just about fryer temperature. It's a function of oil age, slice thickness, feed rate, and humidity. Traditional SPC treats each variable independently. But the real signal — "this batch is going to be too dark" — lives in the interaction between temperature and oil age. Univariate charts can't see it. By the time the lab reports a color failure, the root cause has already moved on, and the operator has no actionable insight.
Regulatory and customer audits expose the gaps
Food safety and quality standards — from SQF to BRC to major retailer requirements — demand evidence of effective process control. When an auditor sees a control chart that shows a process "in control" but the finished product records show a 2% defect rate, they ask hard questions. The answer — "our SPC wasn't sensitive enough to catch that drift" — is not an acceptable response. It erodes customer confidence and opens the plant to corrective action requests that consume weeks of engineering time.
The problem isn't your operators. It's that your SPC system was designed for a world that no longer exists. Book a 30-min walkthrough and see how AI closes the gap between data and decision.
From reactive charting to predictive process control in four steps
iFactory doesn't replace your existing SPC framework — it supercharges it. Our AI-native platform ingests every data point from every sensor on your line, learns the normal operating envelope of your process, and alerts operators the moment the process begins to drift — before it ever reaches a control limit. Here's how it works in practice.
Connect every data source in under two weeks
iFactory connects directly to your PLCs, inline sensors (color, moisture, thickness, seasoning weight), and lab systems. No middleware, no custom integration work. Data flows into the platform at native sensor frequency — typically once per second or faster.
AI learns your process's "normal" operating envelope
Using the first 2–3 weeks of data, iFactory's AI builds a multivariate baseline of your process — not just individual control limits, but the complex web of interactions between temperature, oil age, feed rate, and humidity. It learns what "normal drift" looks like versus "early warning drift."
Real-time drift detection with 15–45 minute early warnings
Once trained, iFactory analyzes every new data point against the baseline. When it detects a pattern that precedes a defect — a temperature trend that has historically led to color failure 30 minutes later — it sends an alert to the operator's HMI, mobile device, or email. Not a false alarm. A specific, actionable warning with the predicted time-to-failure.
Continuous learning and closed-loop improvement
Every time an operator confirms or rejects an alert, iFactory learns. The model improves. Over 3–6 months, the false-alarm rate drops below 2%, and the early-warning window extends as the AI discovers subtle precursors that even experienced operators miss. The result: a self-improving SPC system that gets better every shift.
What AI-native SPC does that traditional charts can't
iFactory's platform isn't just a faster version of an X-bar chart. It's a fundamentally different approach to process monitoring — one that sees the interactions, learns the patterns, and acts before the defect happens.
Sees the whole picture, not one variable at a time
Traditional SPC treats temperature, moisture, and color as independent. iFactory's AI models the full interaction space. It can detect that a 0.2°F rise in oil temperature combined with a 1% drop in humidity creates a 92% probability of a color failure in 22 minutes — a signal no univariate chart would ever catch.
Forecasts the failure, doesn't just report it
Instead of telling you "the process is out of control" after the fact, iFactory predicts when the process will go out of spec — and by how much. Operators get a countdown: "Color L-value predicted to drop below spec in 34 minutes at current drift rate." That's time to adjust the burner, not time to quarantine pallets.
Control limits that evolve with your process
When you change a recipe, switch suppliers, or adjust a process parameter, iFactory's AI automatically recalibrates its baseline. No manual recalculation of control limits. No period of "unknown" operation. The model adapts within hours — not the weeks it takes a quality engineer to re-validate a traditional SPC chart.
Alerts that say what to do, not just "something's wrong"
iFactory alerts include the predicted root cause and a recommended corrective action. "Color drift detected. Likely cause: oil age approaching 72-hour limit. Recommended action: increase oil turnover rate by 5%." Operators don't need to be statisticians to respond effectively.
Automated SPC documentation for every shift
iFactory generates a complete SPC report for every production run — including all raw sensor data, AI-predicted drift events, operator responses, and final quality outcomes. Auditors see a continuous, tamper-proof record of process control. No more manual charting. No more "lost" data. No more CARs.
Zero cloud dependency — data never leaves your network
iFactory runs on an NVIDIA appliance inside your plant network. All data is processed locally. No internet connection required. No data egress. No cybersecurity exposure. This is critical for snack foods plants that handle proprietary recipes, supplier agreements, or sensitive customer data.
What happens when operators catch drift 30 minutes earlier
These are real results from snack foods plants that deployed iFactory's AI-native SPC. Your numbers will vary — but the pattern is consistent across every deployment.
Everything you need to go from pilot to ROI in one quarter
iFactory is delivered as a turnkey solution. We handle the integration, training, and model tuning. You get a working pilot in 6–12 weeks and full production deployment within one quarter. Here's what's included.
End-to-end deployment — we do the heavy lifting
We connect to your data sources, configure the AI models, train your operators, and validate the results. Your team doesn't need to write a single line of code or learn a new tool.
Turnkey pilot in 6–12 weeks
From kickoff to live alerts on one line in under 12 weeks. We prove the ROI before you commit to a broader rollout. No long sales cycles. No "proof of concept" that takes a year.
On-premise appliance — zero cloud dependency
Your data stays on your network. The NVIDIA appliance sits in your server room, processes everything locally, and requires no internet connection. No data egress. No third-party access.
Pilot to ROI in one quarter
Most customers see a positive ROI within 90 days of going live. The savings from reduced downgrade events alone typically cover the full cost of the pilot in the first two months.
24x7 managed service
iFactory's operations team monitors your deployment around the clock. If a model needs retraining or a sensor connection drops, we handle it. Your operators focus on running the line, not troubleshooting the AI.
Scales across your entire plant network
Once proven on one line, iFactory can be deployed to every line in your plant — and every plant in your network — with minimal incremental effort. The baseline model for one chip line transfers to another with just a few weeks of tuning.
Questions we hear from snack foods operators and engineers
Stop catching defects. Start catching drift.
Your operators already know the system is broken. Give them the tool that finally works the way the process actually works — continuously, adaptively, and ahead of the failure. Book a 30-minute walkthrough and we'll show you live alerts on a snack foods line just like yours.