Snack foods operators hear "Cpk target 1.33" or "improve Cpk to 1.67" but many don't understand what it means or how to achieve it. Cpk is process capability — the ratio of specification width to actual process variation. A weigher with ±0.8g variation on a ±1.0g specification has Cpk = 1.25 (acceptable). The same weigher with ±0.5g variation has Cpk = 1.67 (world-class). Traditional control keeps variation static. Self-learning AI process control continuously observes variation patterns, identifies which control adjustments reduce variation most, and tunes parameters to tighten the distribution. Operators stop fighting specification limits and start optimizing for consistency. Leading snack foods plants are driving Cpk from 1.1-1.3 (reactive control) to 1.5-1.8 (proactive learning control) — transforming products from borderline acceptable to premium quality. This guide explains process capability in operator terms, shows which snack foods processes benefit most from Cpk improvement, and how self-learning control drives step-change improvement in 6-12 weeks. Book Demo with Us to see Cpk improvement in action.
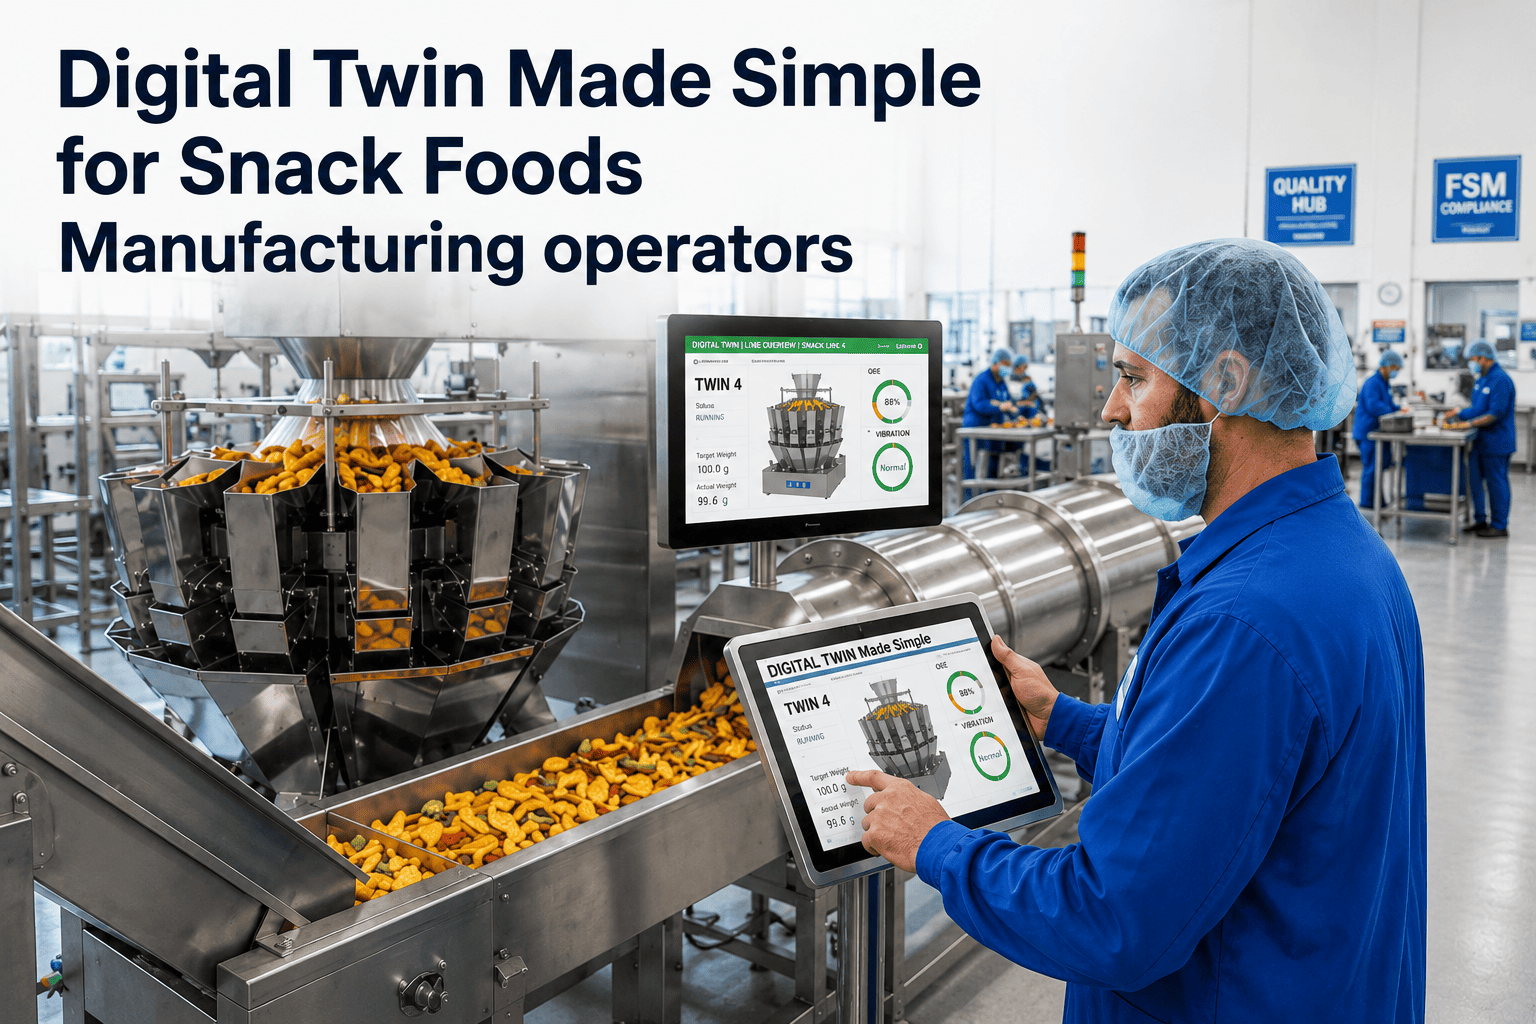
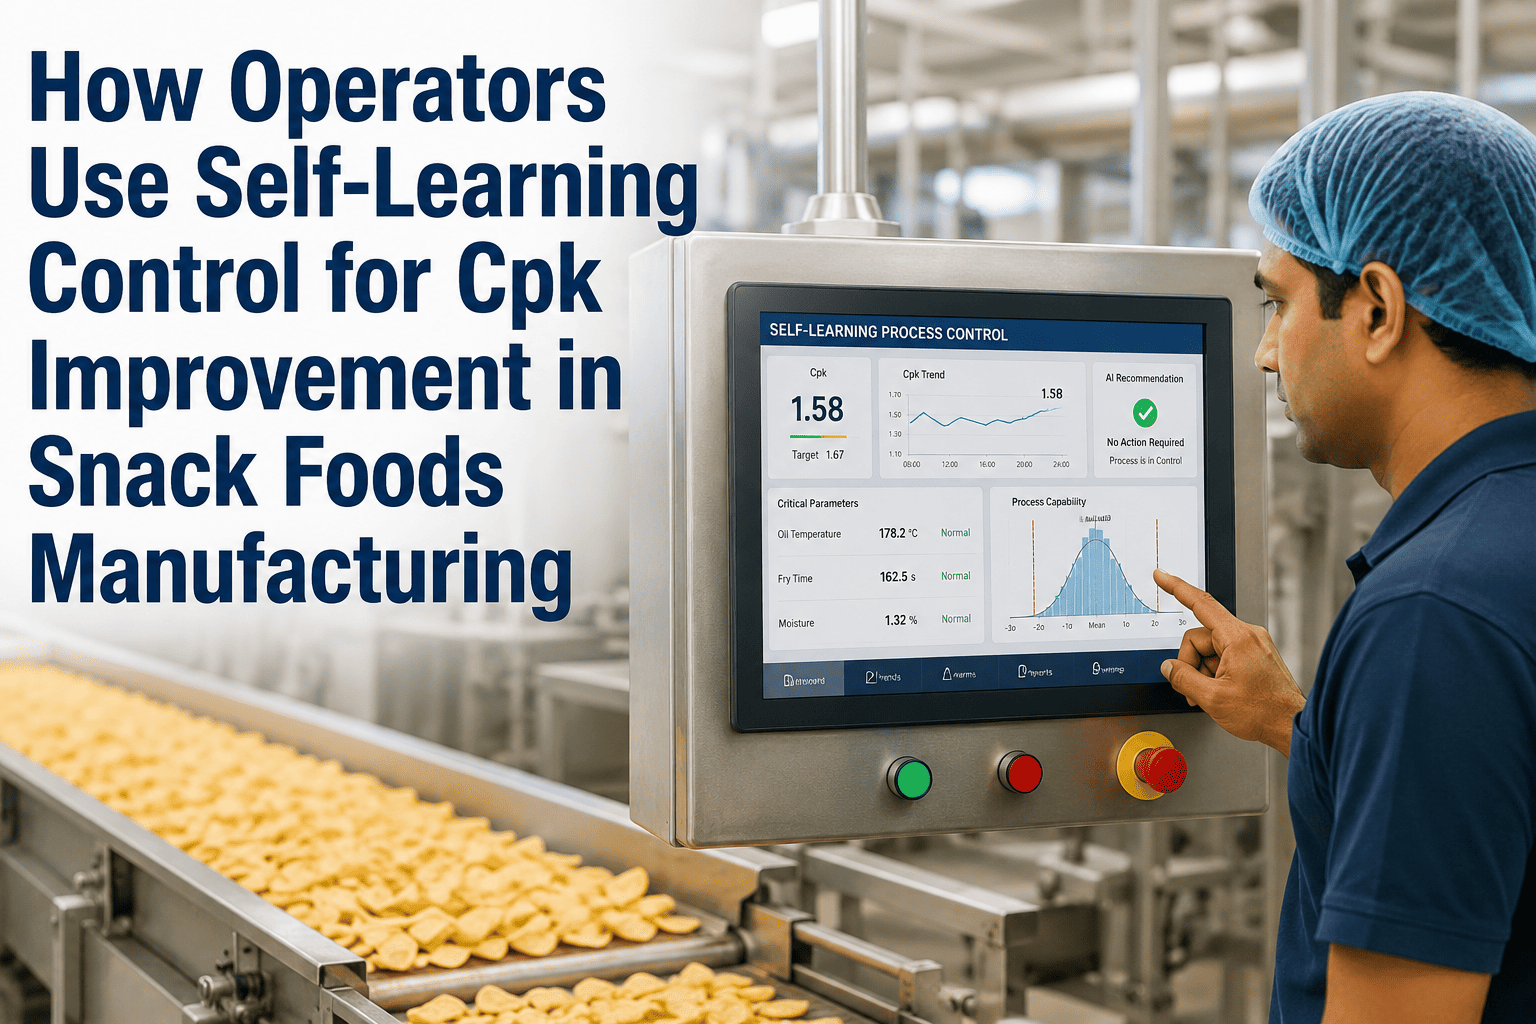
How Operators Use Self-Learning Control for Cpk Improvement in Snack Foods Manufacturing
Process capability explained for operators · Tighten variation, improve Cpk · 1.33 → 1.67 world-class · Self-learning tuning · Real-time capability dashboard.
What Is Cpk? An Operator's Guide to Process Capability
Process Capability (Cpk) measures how consistently your line produces product within specification. It answers: "How close are we to the limits, and how much do we bounce around?" A specification width is fixed: weigher target 28.5g ±1.0g = 27.5–29.5g allowed range. Process variation is your output distribution. If weigher consistently produces 28.3–28.7g (tight), you're far from limits. If it bounces 27.8–29.2g (loose), you're cutting it close. Cpk is the math that captures this: Cpk = (Specification Width) ÷ (2 × Process Variation). Cpk 1.0 means your process variation exactly fills half the specification. Cpk 1.33 (automotive standard) means you're safe from occasional excursions. Cpk 1.67 (world-class) means your process is so tight that excursions are rare. Higher Cpk = higher quality, fewer rejects, more confidence in consistency. Operators typically inherit a Cpk of 1.1–1.3 (tight margin for error). Self-learning control improves Cpk by reducing variation — moving toward 1.5–1.8 (safe, premium quality).
Three Process Capability Bottlenecks in Snack Foods
Multi-head weighers drift with temperature, moisture, and mechanical wear. A weigher calibrated to 28.5g at 8 AM drifts to 28.7g by 11 AM and 28.9g by 2 PM. This creep consumes specification margin (moving mean toward upper limit). It also increases variation: some heads drift faster, creating head-to-head inconsistency. Cpk degrades from 1.35 to 1.10 over a single shift. Manual control requires operator intervention every 2-3 hours. Self-learning control detects drift patterns and applies micro-adjustments every 15 minutes, keeping mean centered and variation tight. Result: Cpk maintains 1.35–1.4 all shift without manual adjustment.
Self-learning impact: Cpk +0.25–0.30 pointsFryer temperature controlled by proportional valve: target 185°C ±3°C. Proportional controllers swing: 183°C → 187°C → 183°C in a cycle. This oscillation directly affects product: crisping changes with temperature swings. Cpk degrades because variation increases (wider distribution around mean). Traditional tuning adjusts proportional gain: higher gain reduces overshoot but increases response lag. Self-learning control models fryer thermal response, predicts temperature trajectory, and applies predictive adjustments instead of reactive corrections. Oscillation amplitude reduces 40–50%. Variation tightens. Cpk improves from 1.20 to 1.50.
Self-learning impact: Cpk +0.25–0.35 pointsRaw material moisture batch A: 11.8%. Batch B: 12.4%. Same extruder settings produce different density and texture. Extruder controller doesn't know moisture changed — it only sees screw torque and temperature. Process drifts. Cpk drops because specification interpretation shifts: what was 28.5g ±0.5g for batch A becomes 28.8g ±0.7g for batch B (different effective specification). Manual control requires operator to estimate batch moisture and adjust injection rate. Self-learning control receives material moisture data (from incoming QC or sensor), predicts process response, and pre-adjusts extruder parameters for incoming material. Process stays centered. Cpk stays stable across material batches.
Self-learning impact: Cpk +0.15–0.25 points across material changeHow Self-Learning Control Improves Cpk Step-by-Step
Starting Cpk: 1.15 (typical snack foods line with reactive control)
System observes: weigher drift patterns, temperature oscillation, material impact on process. Collects 100+ adjustment cycles and their variation impact.
Operator sees: Cpk dashboard showing current 1.15. System begins making recommendations: "increase screw speed by 2 rpm to center distribution" (no automatic adjustment yet).
Cpk improving: 1.20–1.25
System identifies key control relationships: "weigher drift rate = 0.3g/6hrs; fryer oscillation magnitude = ±2°C; material moisture impact = ±0.4g." System builds predictive model of how adjustments affect variation.
Operator sees: Recommendations becoming more specific: "detected material batch 12.3% moisture → recommend -0.5°C barrel temp + -0.2g moisture injection." Operator approves recommendations; system learns from outcomes.
Cpk target reached: 1.33–1.40
System has sufficient model accuracy (90%+) to make autonomous adjustments. It continuously tunes 2-3 key parameters (weigher calibration, fryer PID, extruder speed) without operator approval. Variation tightens. Cpk stabilizes.
Operator sees: Cpk chart climbing. System manages day-to-day tuning. Operator monitors and overrides only if product quality concern detected.
Cpk world-class: 1.50–1.67
System has learned seasonal patterns, material library, product-specific optimal control curves. It continuously explores small adjustments to push Cpk higher: "can we reduce fryer oscillation further?" "is there a faster weigher settling time if we adjust actuator speed?" System incrementally improves.
Operator sees: Cpk sustained 1.50+. Monthly reports show improvement trajectory. System owns process optimization.
Real Operator Scenarios: Cpk Improvement in Action
Current State: Weigher Cpk 1.20 (drift-driven). Specification: 28.5g ±0.8g. Actual variation: ±0.53g, but mean creeps 28.3 → 28.9g throughout shift. Operator manually recalibrates every 2 hours. Between calibrations, early batches are light, late batches are heavy.
With Self-Learning: System detects drift pattern (0.3g/4hrs for this weigher on this product). Applies micro-calibration every 15 minutes (+0.05–0.1g adjustment). Mean stays centered 28.5g ±0.2g. Variation tightens to ±0.48g. New Cpk = 1.50 (world-class). Operator no longer calibrates manually — system owns it.
Current State: Fryer Cpk 1.10 (oscillation-driven). Temperature target 185°C ±3°C. PID controller proportional gain set for response speed, causing oscillation: ±2.2°C actual swing. Crisping varies with temperature cycles. Cpk = 1.10 (dangerously close to limits).
With Self-Learning: System learns fryer thermal inertia and response curve. Instead of reactive PID corrections, system applies predictive adjustments: "in 90 seconds, temperature will drop to 183°C, so apply heat now." Oscillation amplitude reduces to ±1.2°C. Cpk = 1.40. Product crisping becomes consistent across every batch.
Current State: Product A (light): Cpk 1.35. Product B (dense): Cpk 1.18. Product C (oily): Cpk 1.22. Manual changeovers require re-tuning each SKU. Cpk varies widely. During changeover ramp-up, Cpk dips to 1.05–1.10.
With Self-Learning: System has learned optimal control curve for each SKU. Upon changeover, system loads Product B parameters. First batch hits Cpk 1.32 (near target). System fine-tunes within 2-3 batches to Cpk 1.35. All SKUs maintain 1.33+ baseline. Zero ramp-up Cpk loss.
Cpk Improvement Summary: Before & After Self-Learning Control
| Aspect | Before Self-Learning | After Self-Learning (Week 12) | Improvement |
|---|---|---|---|
| Weigher Cpk | 1.20 (drift-driven variation) | 1.50 (centered, tight) | +0.30 |
| Fryer Cpk | 1.10 (oscillation-driven) | 1.40 (smooth, predictive) | +0.30 |
| Line Average Cpk | 1.18 (reactive control) | 1.42 (learning control) | +0.24 |
| Product Reject Rate | 0.8–1.2% out-of-spec | 0.2–0.4% out-of-spec | 60–75% reduction |
| Changeover Ramp-Up Cpk Loss | Dips to 1.05–1.10 per change | Maintains 1.30+ from batch 1 | Zero loss |
| Customer Quality Complaints | 2–3% texture/weight variation | <0.5% variation complaints | 80% improvement |
| Operator Manual Calibration | 6–8 events per shift | 0 (fully autonomous) | 100% time freed |
Frequently Asked Questions
Drive Process Capability Toward World-Class With Self-Learning Control
Improve Cpk from 1.1–1.3 (reactive) to 1.5–1.8 (proactive). Tighten variation, center distribution, eliminate manual calibration. Self-learning system learns your process and continuously optimizes for consistency and capability. 6-12 week improvement trajectory.