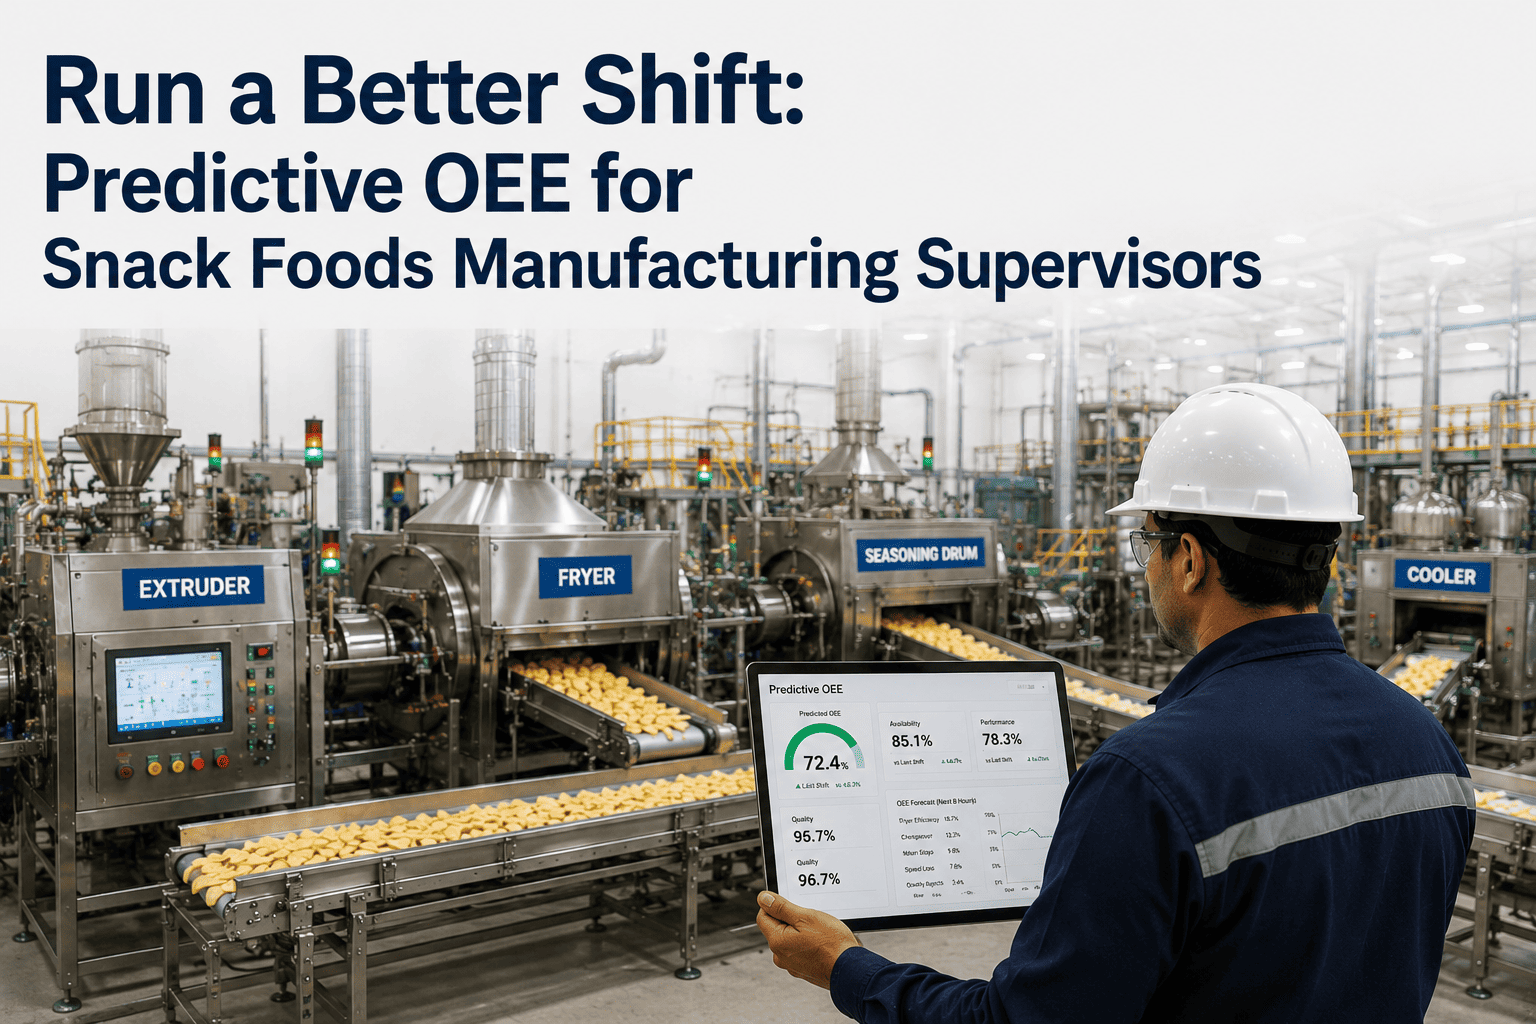
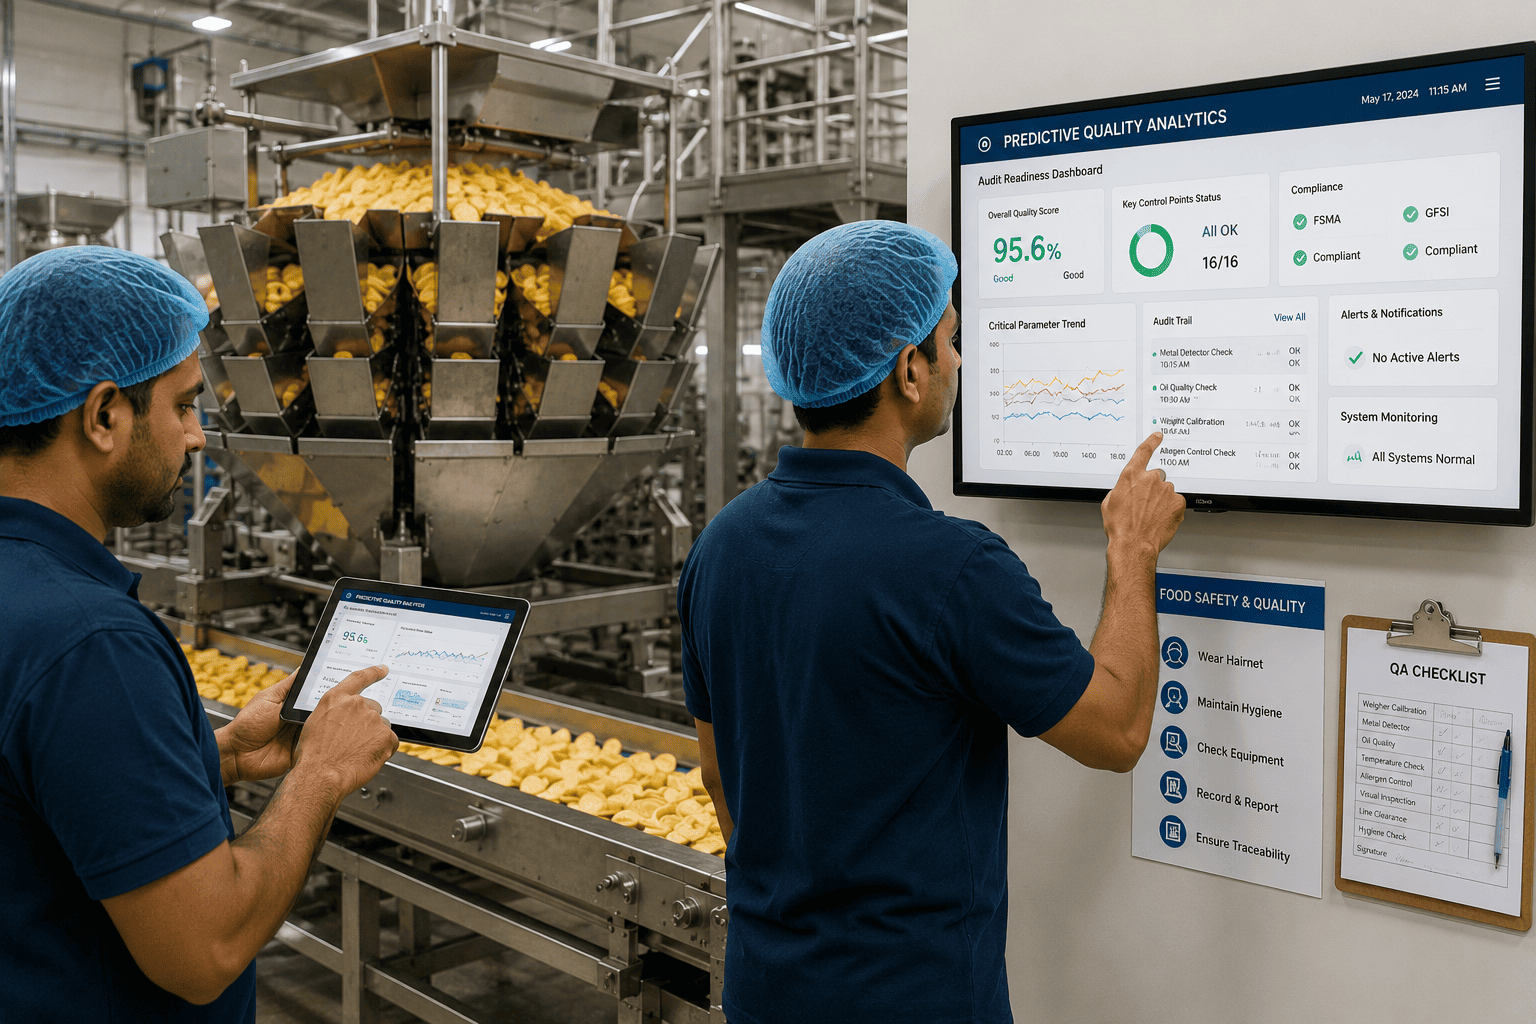
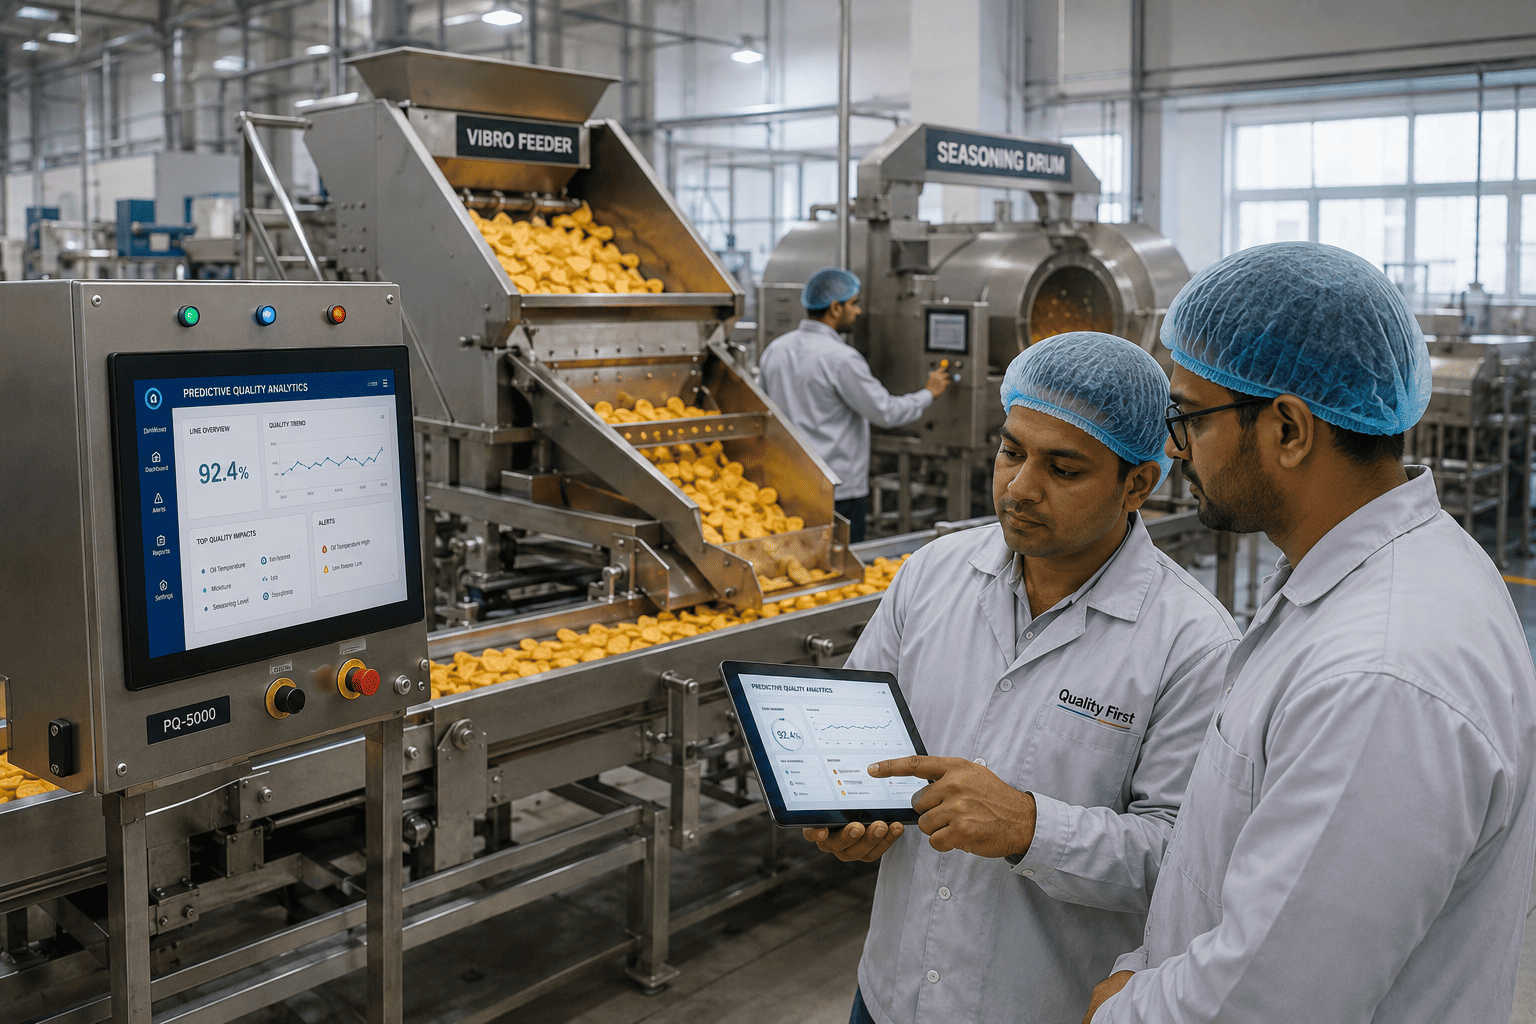
OEE numbers on a snack line tell you how much you lost. They rarely tell you where you lost it, why it happened, or — critically — that it was about to happen before it did. For operators running chip lines, pretzel extruders, or coated nut lines, the gap between a 71% and an 83% OEE is not usually one big problem. It is twelve small ones: a weigher running 0.8% give-away above target, a seasoning tumbler losing coverage as oil temperature drops, a packaging film tracking slightly off-centre across three hours. Predictive OEE shows you each of those losses as they open — not in the end-of-shift report. See predictive OEE running on a snack line configuration similar to yours — Book a Demo with Us.
What OEE Actually Measures on a Snack Line — and Where the Number Hides
OEE — Availability multiplied by Performance multiplied by Quality — is the right metric for a snack line. The problem is not the formula. The problem is the timing. A standard OEE dashboard shows you where efficiency went after it went there. By the time a quality loss event appears in your OEE figure, the product causing it has already been made, bagged, and potentially palletised.
On a typical snack line the Quality component hides the most recoverable losses. Breakage on chip lines, weigher give-away on portion-packed snacks, and seasoning coverage gaps are all quality losses that compound quietly across a shift before they become visible in rework counts or consumer complaint rates. Predictive OEE surfaces these losses as contributing factors — in real time, with the specific process variable driving each loss identified — so operators can close the gap while the run is still running. See how loss attribution works on your specific line type — Book a Demo with Us.
The Six OEE Loss Sources Snack Foods Operators Can Close with Predictive Monitoring
Each loss source below represents a recoverable OEE gap that standard dashboards report after the fact. Predictive OEE detects each one while it is developing — giving operators the information and the time to correct it before the shift OEE is already written.
Multihead weighers running 0.5-1.5% above target weight represent direct materials cost that accumulates invisibly across thousands of packs. Weigher drift caused by head timing variation, load cell calibration creep, or gate wear is detectable in weigher data before the mean weight has moved enough to trigger an alarm. Predictive OEE tracks the mean weight trajectory and attributes the give-away cost to the Performance and Quality OEE components in real time.
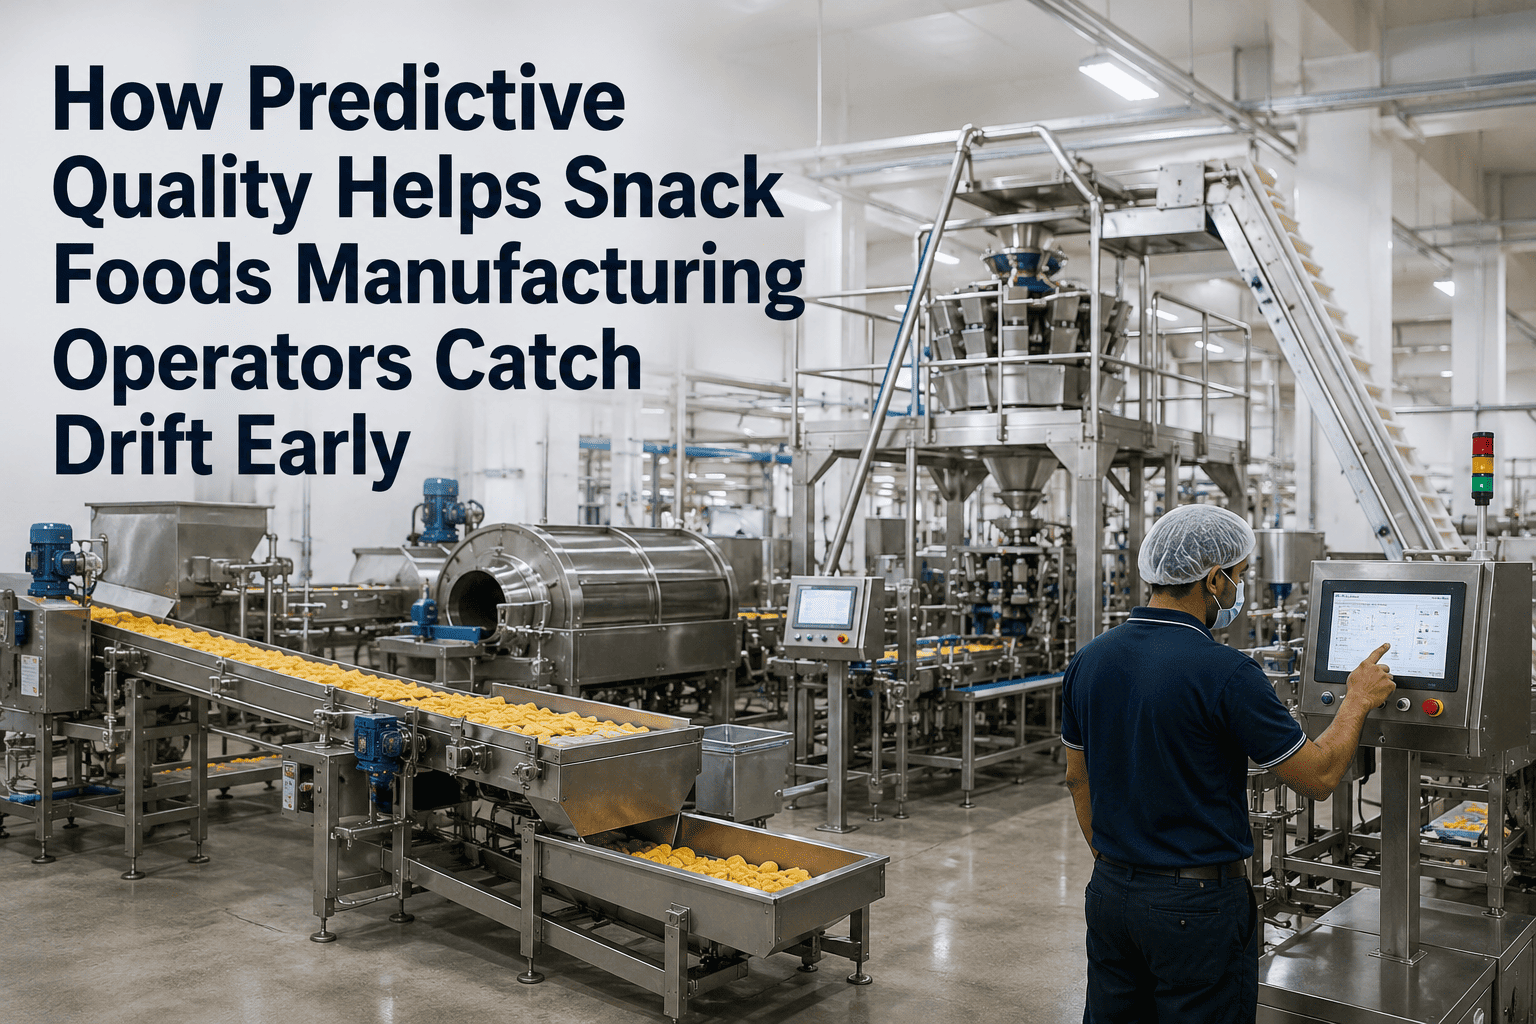
Seasoning application consistency depends on tumbler RPM, oil spray rate, and product throughput staying in a defined ratio. As any one of these variables drifts — tumbler belt wear reducing RPM, oil pump pressure dropping, line speed creeping up — coverage becomes uneven across the product bed. The result is flavour intensity variation that fails sensory panels and generates consumer complaints. Predictive OEE monitors the ratio between these variables and flags coverage risk before under-seasoned product is packed.
Breakage on chip and pretzel lines is driven by moisture content at the point of transfer, conveyor belt tension variation, and discharge height changes caused by line configuration drift. Inline moisture above target increases brittleness; transfer drops from slightly mis-aligned guides cause mechanical fracture. Predictive OEE correlates exit moisture data with breakage rates detected at vision checkpoints or weight-sort rejection to identify which upstream variable is driving the breakage event.
Extruder screw wear causes a gradual reduction in output rate over the screw's service life that is masked by operators compensating with incremental speed adjustments. The line appears to be running at rate while the extruder is actually working harder to maintain throughput — consuming more energy, generating more heat, and approaching a point where die plugging risk increases sharply. Predictive OEE tracks the relationship between screw speed, motor current, and actual output rate to detect this wear pattern before it converts to a stoppage.
Packaging film tracking drift of 2-3mm from the centreline causes incomplete seal formation that either produces rejected packs at the downstream seal checker or passes through to create consumer-visible seal defects. Film roll tension variation, former wear, and dancer arm calibration drift all contribute. Predictive OEE monitors seal jaw temperature, film registration mark timing, and rejection rate trajectory to flag tracking issues before they generate a reel-change stoppage or a batch of leaking packs.
Fryer oil total polar compound (TPC) levels rise as oil turnover rate drops relative to production throughput. Rising TPC increases darkening rate, producing darker product toward the end of a fryer cycle that fails colour grading even though fryer temperature setpoints have not changed. Predictive OEE correlates oil addition rate, production throughput, and downstream colour measurement data to predict when TPC is approaching the visual grading boundary — giving operators time to increase oil addition before the product fails inspection.
The Operator Dashboard: What Predictive OEE Puts in Front of You
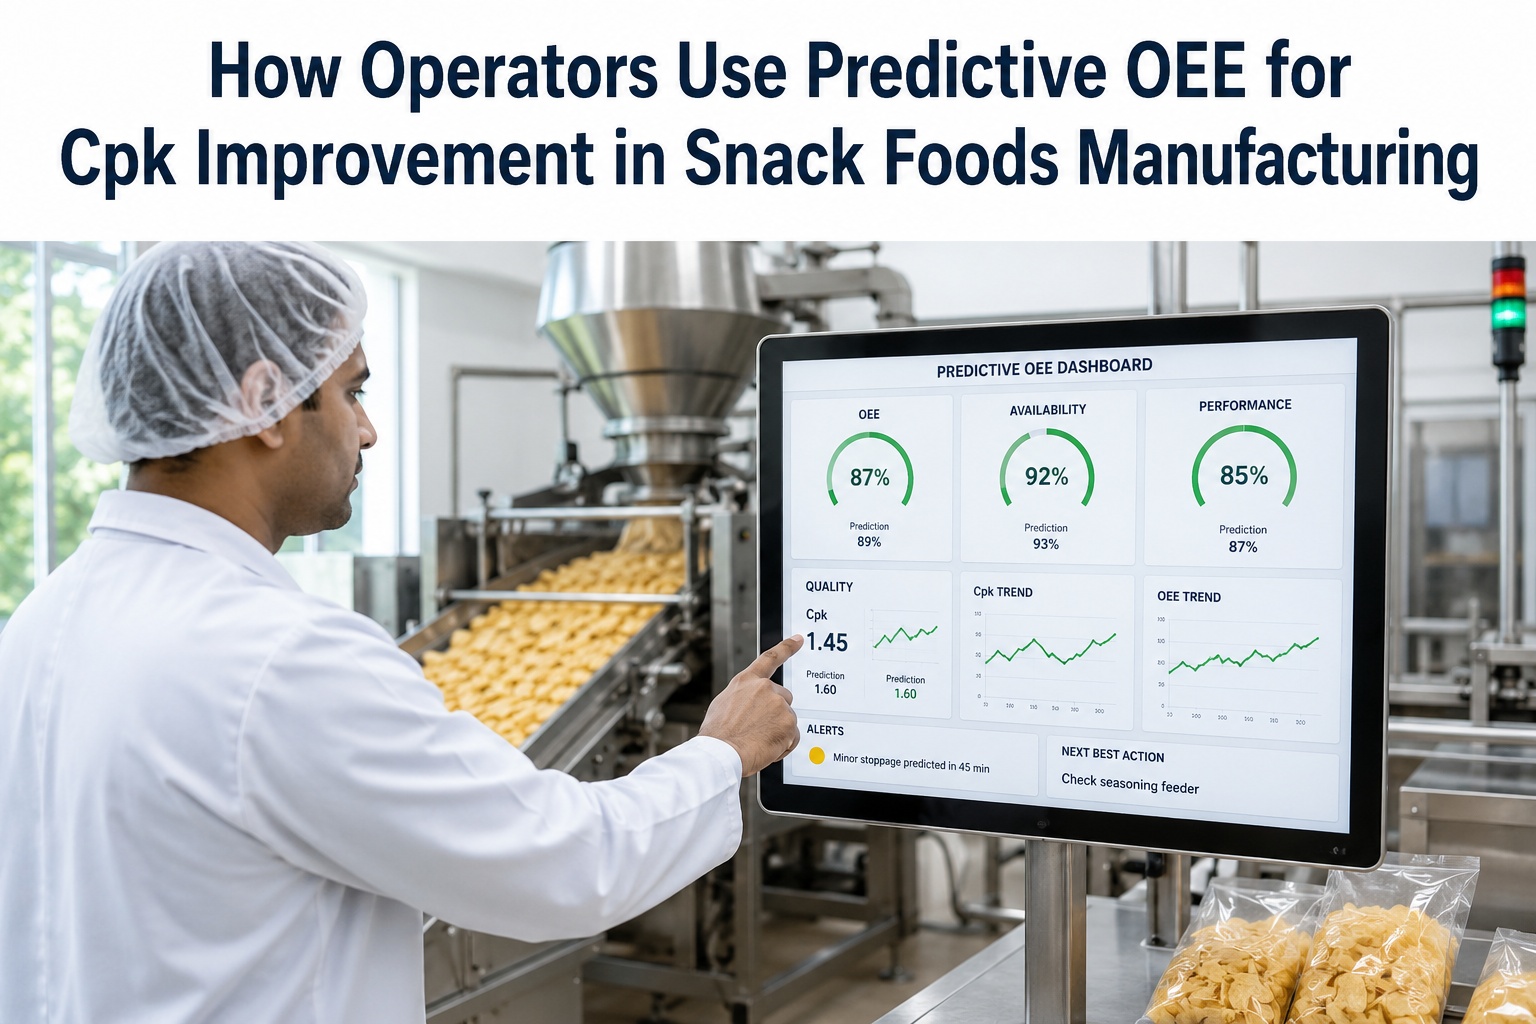
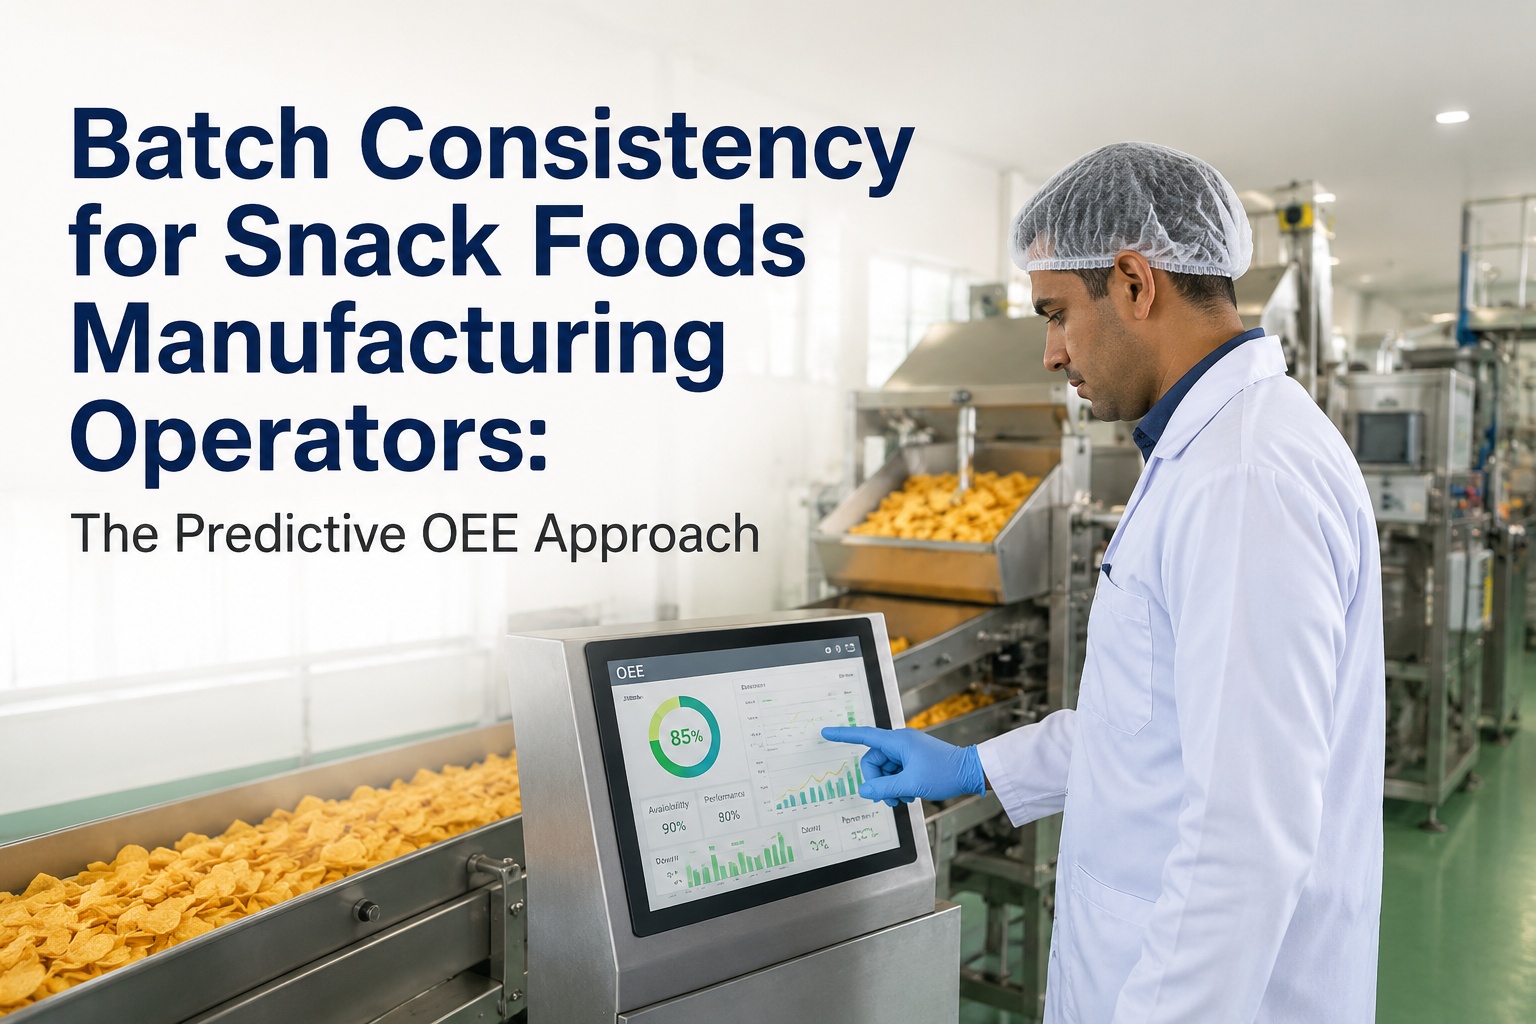
The iFactory predictive OEE dashboard is designed for operators running a line — not analysts reviewing data after the fact. Every element on the dashboard answers the question an operator needs answered in the first three seconds: what is running correctly, what is drifting, and what needs attention before the next quality event.
Current shift OEE broken into Availability, Performance, and Quality in real time — not as a post-shift calculation. Each component shows its contribution to the running OEE figure and which specific events are driving loss in each category at this moment in the shift.
Each monitored process parameter displayed with its current value, adaptive control limit, and a directional indicator showing whether it is stable, drifting toward the limit, or already in the early warning zone. Operators see at a glance which parameters need attention without interpreting trend charts.
Every OEE loss event attributed to a specific cause — weigher drift, seasoning tumbler RPM, film tracking — as it occurs, not in a batch report at shift end. Operators know which action to take because the dashboard tells them what is causing the loss, not just that a loss is occurring.
Based on the current drift rates and loss attribution at any point in the shift, the platform generates a projected end-of-shift OEE. If current drift patterns continue, the operator sees where the shift will finish — giving them a target and a reason to make the correction now rather than waiting to see the final figure.
When a drift pattern indicates an equipment wear issue — weigher load cell calibration, extruder screw wear, tumbler belt degradation — the dashboard generates a maintenance alert with the specific parameter, drift rate, and estimated time to impact. The operator has context for the alert, not just a notification.
At the end of each shift, a handover summary is generated automatically: OEE achieved, each loss event with cause and duration, maintenance alerts raised and actioned, and any parameters still trending at handover. Incoming operators start with a complete picture — not a verbal briefing.
What iFactory Delivers on Snack Manufacturing Lines
From food and beverage manufacturing deployments. Individual results depend on line configuration and baseline OEE. iFactory does not guarantee specific OEE figures — outcomes are documented ranges from deployed installations.
Documented range across food manufacturing deployments from live loss attribution and drift detection.
Predictive wear detection converts emergency stoppages to planned maintenance across line assets.
Continuous PLC-sourced records satisfy FDA 21 CFR Part 11, SQF, and BRC process documentation requirements.
PLC connection to live operator dashboard. Pre-configured AI server. No line modification required.
How Predictive OEE Connects to Your Existing Snack Line Infrastructure
iFactory does not require new sensors or control system replacement. The platform reads from PLC tags and SCADA historian data your line is already collecting — fryer zone temperature registers, weigher head data, extruder motor current, seasoning drum encoder signals, packaging machine servo positions. The pre-configured AI server processes this data on-site at 24x7 without cloud dependency.