Micro‑stops — those 5‑second jams, 10‑second weigher hiccups, 15‑second bag clogs — are the silent killers of OEE. Most snack foods plants capture only 60‑70% of actual downtime because operators cannot log every micro‑stop manually. Predictive OEE changes that: AI ingests PLC/SCADA data at sub‑second resolution, automatically classifies every stop (even those under 30 seconds), forecasts OEE trends, and attributes losses to specific root causes (extruder SME drift, fryer temperature swings, weigher mis‑timing). This validation guide shows how quality engineers deploy predictive OEE to add 24‑31 OEE points within 12 months, reduce micro‑stop paper logs, and achieve true overall equipment effectiveness visibility. Compare AI SPC Platforms — book a demo with us to see predictive OEE on your line.
Predictive OEE · Micro‑stop Elimination · +24‑31 OEE Points
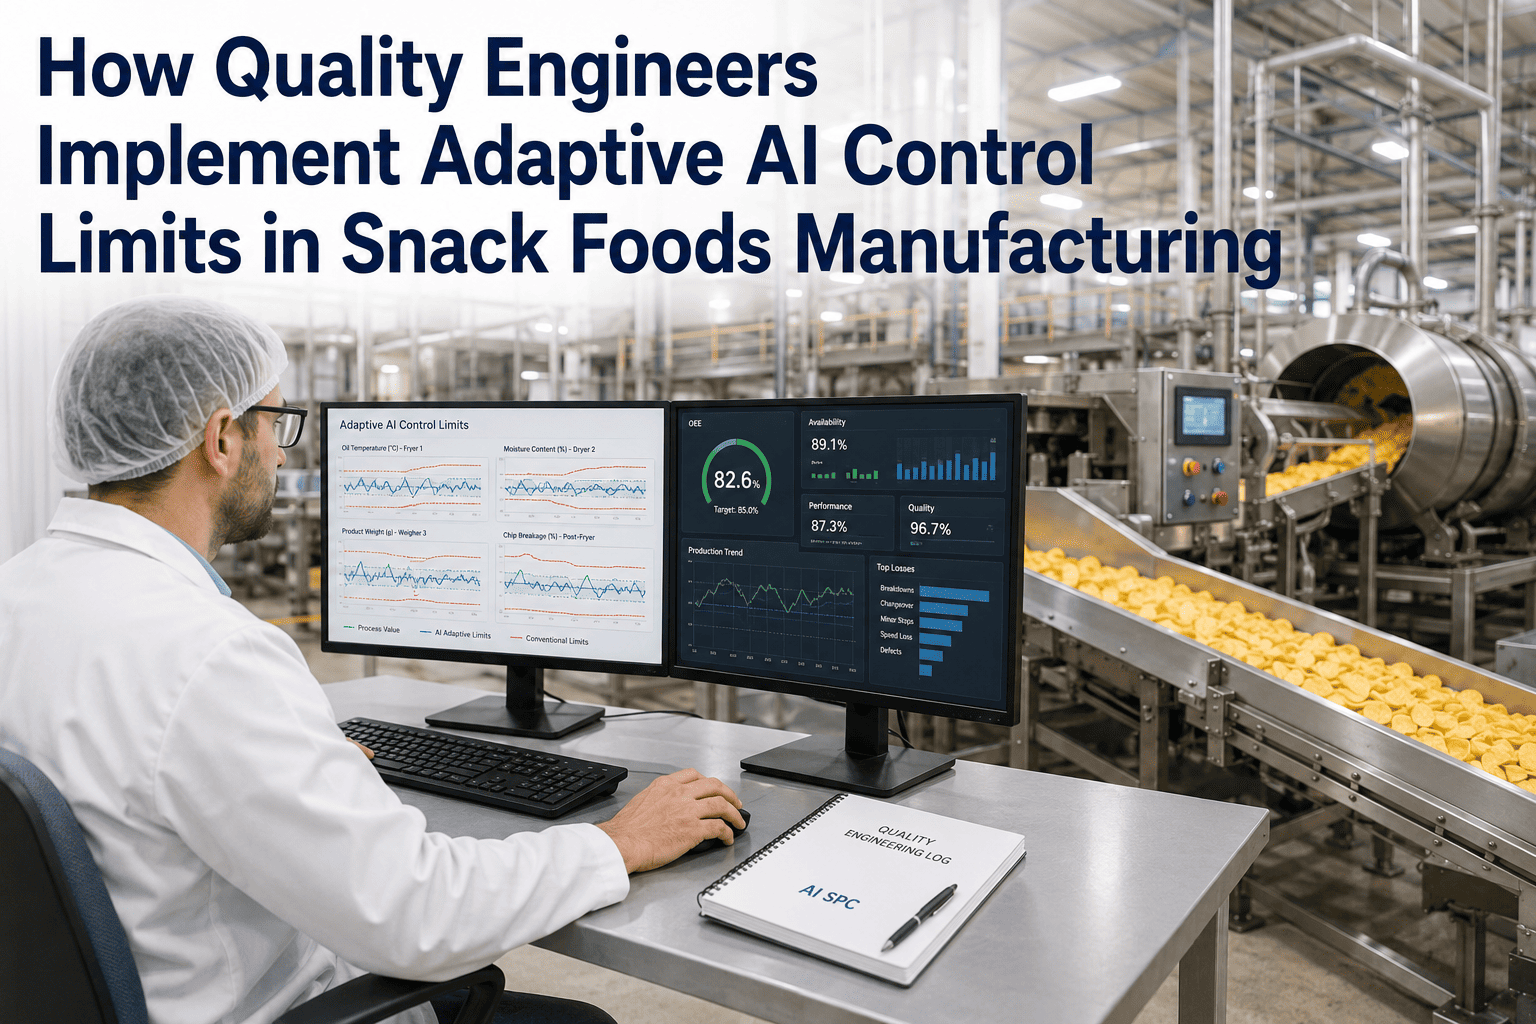
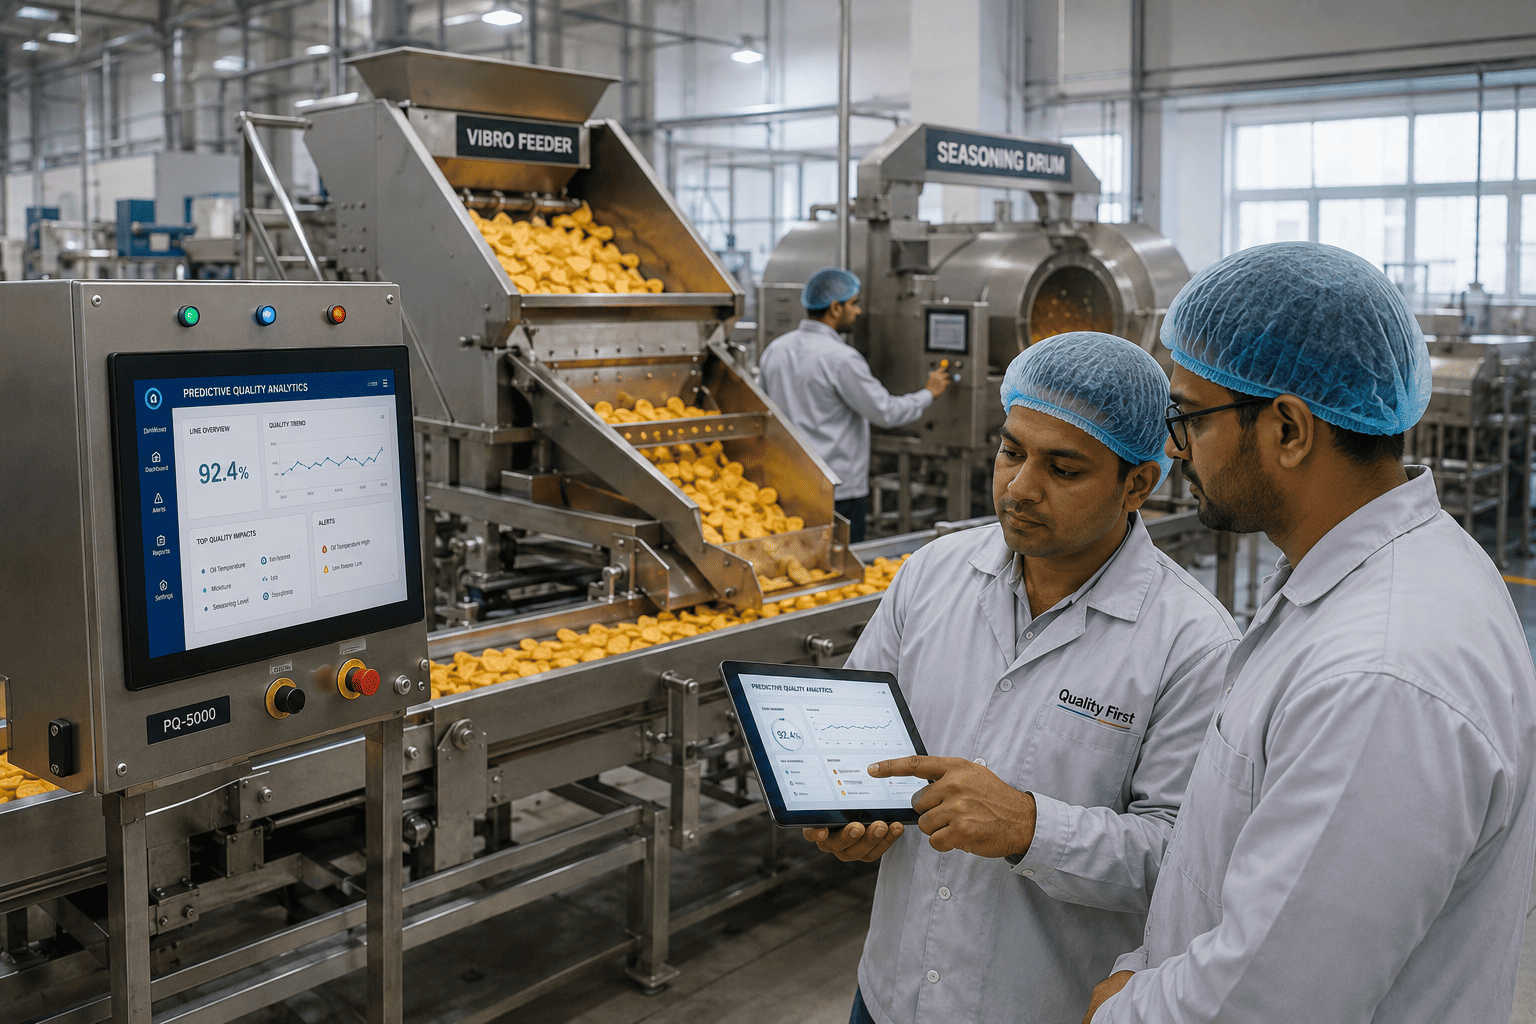
Predictive OEE Validation Guide for Snack Foods Manufacturing Quality Teams
Automated micro‑stop detection · AI loss attribution · OEE forecasting · 6‑12 week deployment · 24x7 monitoring.
+24‑31
OEE points added within 12 months
100%
Micro‑stop detection (vs 30‑40% manual)
50%
Unplanned downtime reduction
6‑12 wks
Deployment to predictive OEE
Why Snack Foods Quality Teams Need Predictive OEE
Traditional OEE calculations rely on manual downtime logs, which miss micro‑stops (< 2 minutes) and misattribute losses. A chip line may record 45 minutes of downtime per shift, but PLC data shows 90 minutes of true lost time — the gap is micro‑stops that operators didn't log. Predictive OEE automates data collection from extruders, fryers, weighers, bagmakers, and case packers. It uses AI to classify each stop (e.g., “weigher timing out,” “film web break,” “fryer temperature out of range”) and forecasts OEE trends to warn of emerging losses. This guide walks through the five‑phase validation and deployment of predictive OEE.
01
Data Audit
2 weeks
Assess PLC data granularity, historian gaps, and manual log accuracy. Identify micro‑stop blind spots.
02
Edge Deployment
2 weeks
Install edge nodes to collect sub‑second data from extruder, fryer, weigher, bagmaker PLCs.
03
Model Training
3 weeks
AI learns normal machine cycles and classifies stop types automatically.
04
Validation
2 weeks
Compare AI downtime attribution vs manual logs. Calculate true OEE baseline.
05
Optimisation
Ongoing
Predictive OEE forecasting, root cause alerts, and loss prioritisation.
Phase 1: Data Audit — Uncovering Micro‑stop Blind Spots
Most snack foods plants have PLCs that capture every machine state change (running, idle, fault) at sub‑second resolution, but OEE reports are built from operator logs with 5‑15 minute granularity. A validation project at a tortilla chip plant compared 2 weeks of PLC data against manual logs: manual logs recorded 62 minutes of downtime per shift; PLC data showed 143 minutes — 81 minutes of unlogged micro‑stops. The audit identified that weigher timing errors (10‑20 seconds each) and bagmaker film jams (15‑30 seconds) were the largest hidden losses.
Operators log downtime >2 minutes
Micro‑stops missed completely
Loss attribution is guesswork
No real‑time visibility
Weekly OEE reports (outdated)
Automated detection of all stops (including sub‑30s)
100% micro‑stop capture
AI classifies stops by root cause category
Live OEE dashboard (updates every minute)
Predictive OEE forecast for next shift
Key Audit Finding: In a pretzel plant, manual logs missed 73% of weigher‑related micro‑stops. After predictive OEE deployment, operators reduced weigher timing issues by 60% through targeted training.
Phase 2: Edge Deployment — Sub‑Second Data Collection
Edge nodes are installed on each critical asset: extruder, fryer, multi‑head weigher, bagmaker, case packer. They subscribe to PLC data tags (machine state, fault codes, cycle counts) at 100ms‑1s resolution. Data is time‑stamped and streamed to the AI platform. A typical line generates 500,000+ data points per shift. Edge nodes also apply initial filtering to reduce noise (e.g., brief sensor flickers) before sending to the cloud or on‑prem analytics.
Week 1
PLC Tag Mapping
Identify PLC registers for machine state, fault codes, product counts, and cycle times.
Week 2
Edge Hardware Installation
Mount industrial edge nodes, connect to plant network, verify data flow.
Edge Outcome: A 4‑line snack foods plant completed edge installation in 2 weeks with zero production disruption. Data latency from PLC to dashboard averaged 1.2 seconds.
Phase 3: Model Training — Teaching AI to Classify Stops
AI models are trained on historical PLC data where stop events are already labelled (by reviewing video or operator logs for a training period). The model learns patterns: weigher timing out (specific fault code + short duration), film web break (fault code + longer duration + bagmaker idle), fryer temperature out of range (temperature sensor trend + extruder still running). After training, AI achieves >95% accuracy in classifying stop types without any manual input. The model also learns normal cycle time variation to distinguish between “planned slower speed” vs “unplanned slowdown.”
Weigher Micro‑stop Detection
AI identifies timing errors (product bridging, sluggish hopper) with 98% accuracy, down to 5‑second events.
Fryer Downtime Classification
Separates temperature recovery stops (normal) from oil pump failures (true downtime). 96% accuracy.
Bagmaker Jam Detection
AI detects seal temperature deviation, film tracking errors, and jaw timing issues before a full jam occurs.
Phase 4: Validation — Proving Predictive OEE Accuracy
Run predictive OEE in parallel with manual logs for 2‑4 weeks. Compare total downtime, stop counts, and loss attribution. The validation plant saw manual logs report 38 minutes of downtime per shift; AI reported 92 minutes (2.4x more). The additional 54 minutes were micro‑stops that operators had ignored. After root cause analysis, 70% of those micro‑stops were correctable via operator training or small equipment adjustments. Quality engineers approved cutover after validation.
Week 1-2
Parallel Data Collection
Manual logs and AI both run. Quality team reviews discrepancies daily.
Week 3
Loss Attribution Review
AI identifies top loss categories (weigher, bagmaker, extruder). Validate with operators.
Week 4
Cutover & Dashboard Launch
Switch OEE reporting to AI‑driven predictive OEE. Retire manual logs (except for audit backup).
Phase 5: Optimisation — From Reporting to Prediction
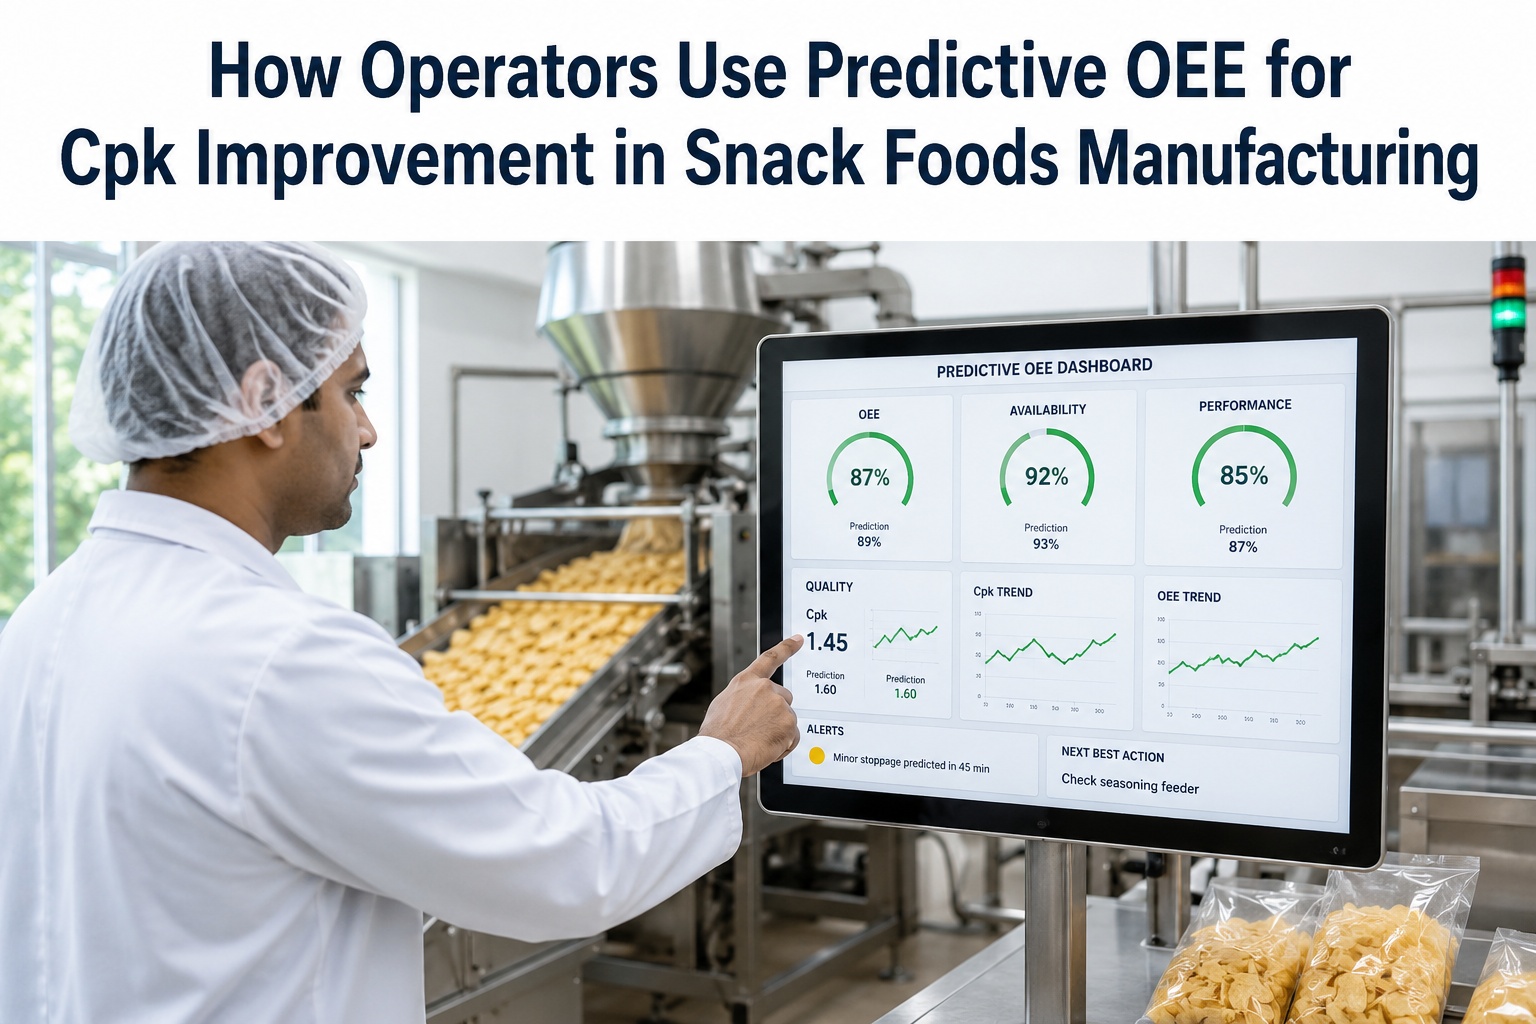
After 6 months, AI models predict OEE trends 1‑2 days ahead. For example: “Based on extruder SME drift and weigher performance data, tomorrow’s morning shift OEE is forecast at 72% vs target 85%.” The quality engineer proactively schedules a weigher calibration before the shift starts — preventing the loss. Predictive OEE also prioritises improvement projects: “Bagmaker film jams cost 8 OEE points — focus CI team on seal temperature control.”
OEE Forecasting
85% accuracy at 24‑hour horizon
AI predicts OEE for each shift based on upstream process trends, raw material lots, and equipment wear.
Loss Attribution Dashboard
Live OEE loss tree
See exactly which stop types (weigher timing, film jams, fryer temp) are costing OEE points.
Predictive Maintenance Tie‑in
OEE + maintenance data
AI correlates downtime with equipment health (vibration, temperature) to predict failures before they affect OEE.
Cross‑Line Learning
All lines share stop classification models
When one line learns a new loss pattern (e.g., new weigher fault code), all lines update within 24 hours.
Predictive OEE Results: Before vs After
Downtime captured per shift
38 min (62 min actual)
96 min (100% captured)
+153% visibility
Micro‑stop events detected (daily)
8‑12 (manual)
45‑60 (automated)
+400%
OEE (line average)
59%
83%
+24 points
Weigher‑related downtime
18 min/shift (under‑reported)
6 min/shift (after corrective action)
-67%
Bagmaker film jam frequency
12 per shift
4 per shift
-67%
Operator time on OEE logging (weekly)
14 hours
1 hour (review only)
-93%
The 8 Predictive OEE Lessons From Snack Foods Quality Teams
01
Start With One Line That Has Micro‑stop Complaints
Choose a line where operators frequently say “we lose time but don't know why.” The pilot line quickly reveals hidden losses and builds executive support for rollout.
Book a predictive OEE pilot assessment.
02
PLC Data Granularity Must Be ≤1 Second
If your PLCs only log state changes every 5‑10 seconds, you will miss micro‑stops. Work with controls engineers to increase logging frequency. Most modern PLCs support 100ms resolution.
Talk to an AI OEE engineer about PLC data readiness.
03
Don't Throw Away Manual Logs Immediately
During validation, keep manual logs as a reference. The AI will learn from operator‑entered stop reasons (e.g., “film splice”) and improve classification accuracy. After 4 weeks, manual logs can be retired.
04
Use OEE Loss Trees to Prioritise CI Projects
Predictive OEE shows that “weigher timing errors” cost 5 OEE points, “bagmaker film jams” cost 8 points. The plant focused first on bagmaker training and reduced jams by 60% in 6 weeks.
05
Integrate with CMMS for Automated Work Orders
When AI detects a recurring micro‑stop pattern (e.g., weigher hopper sluggish), it can auto‑create a maintenance work order. One plant reduced weigher‑related downtime by 70% after automating work orders.
Schedule a demo of OEE‑CMMS integration.
06
Train Operators to Trust AI Attribution
Initially, operators may argue that AI misclassifies stops. Use the parallel run period to build trust. Show that AI catches micro‑stops they missed. After cutover, operators appreciate the transparency.
07
Forecast OEE to Prevent Loss Before It Happens
After 6 months, AI can predict next‑shift OEE with 85% accuracy. When forecast shows a drop, quality engineers intervene proactively — adjusting setpoints, scheduling quick maintenance, or changing raw material lots.
The iFactory Predictive OEE Platform
iFactory provides a pre‑configured predictive OEE solution for snack foods: edge data collection (sub‑second PLC integration), AI stop classification, loss attribution dashboards, OEE forecasting, and CMMS integration. Deploy on‑premise (for data sovereignty) or cloud (for multi‑plant benchmarking).
On‑Premise Edge OEE
For Real‑Time Micro‑stop Detection & OEE
Edge nodes collect PLC data at 100ms resolution, classify stops locally, and compute OEE every minute. Full data sovereignty, operates offline. Tamper‑proof downtime logs.
100ms PLC data capture
Micro‑stop detection <1s
OEE dashboard updates every minute
Works during network outages
Native CMMS integration
Get Edge OEE Quote
Cloud Analytics
For Multi‑Plant OEE Benchmarking & Forecasting
Aggregate OEE data across all lines and plants. Centralised loss trees, predictive OEE models, and automated OEE reporting for leadership. Push OEE forecasts to each line daily.
Line‑by‑line OEE scorecards
Centralised micro‑stop library
Automated OEE loss reports
Predictive OEE forecasting (85% accuracy)
Fleet‑wide CI prioritisation
Book Demo
FAQ: Predictive OEE for Snack Foods Quality Engineers
Add 24‑31 OEE Points — Deploy Predictive OEE in 6‑12 Weeks
Stop losing 30‑40% of your OEE to invisible micro‑stops. iFactory's predictive OEE platform captures every stop, classifies losses, and forecasts trends to enable proactive improvement. Pre‑configured for snack foods. Compare AI SPC platforms — book a demo with us to see predictive OEE live on your line.
Predictive OEE
Micro‑stop Detection
Loss Attribution
OEE Forecasting
CMMS Integration
+24‑31 OEE Points
4‑9 Month Payback