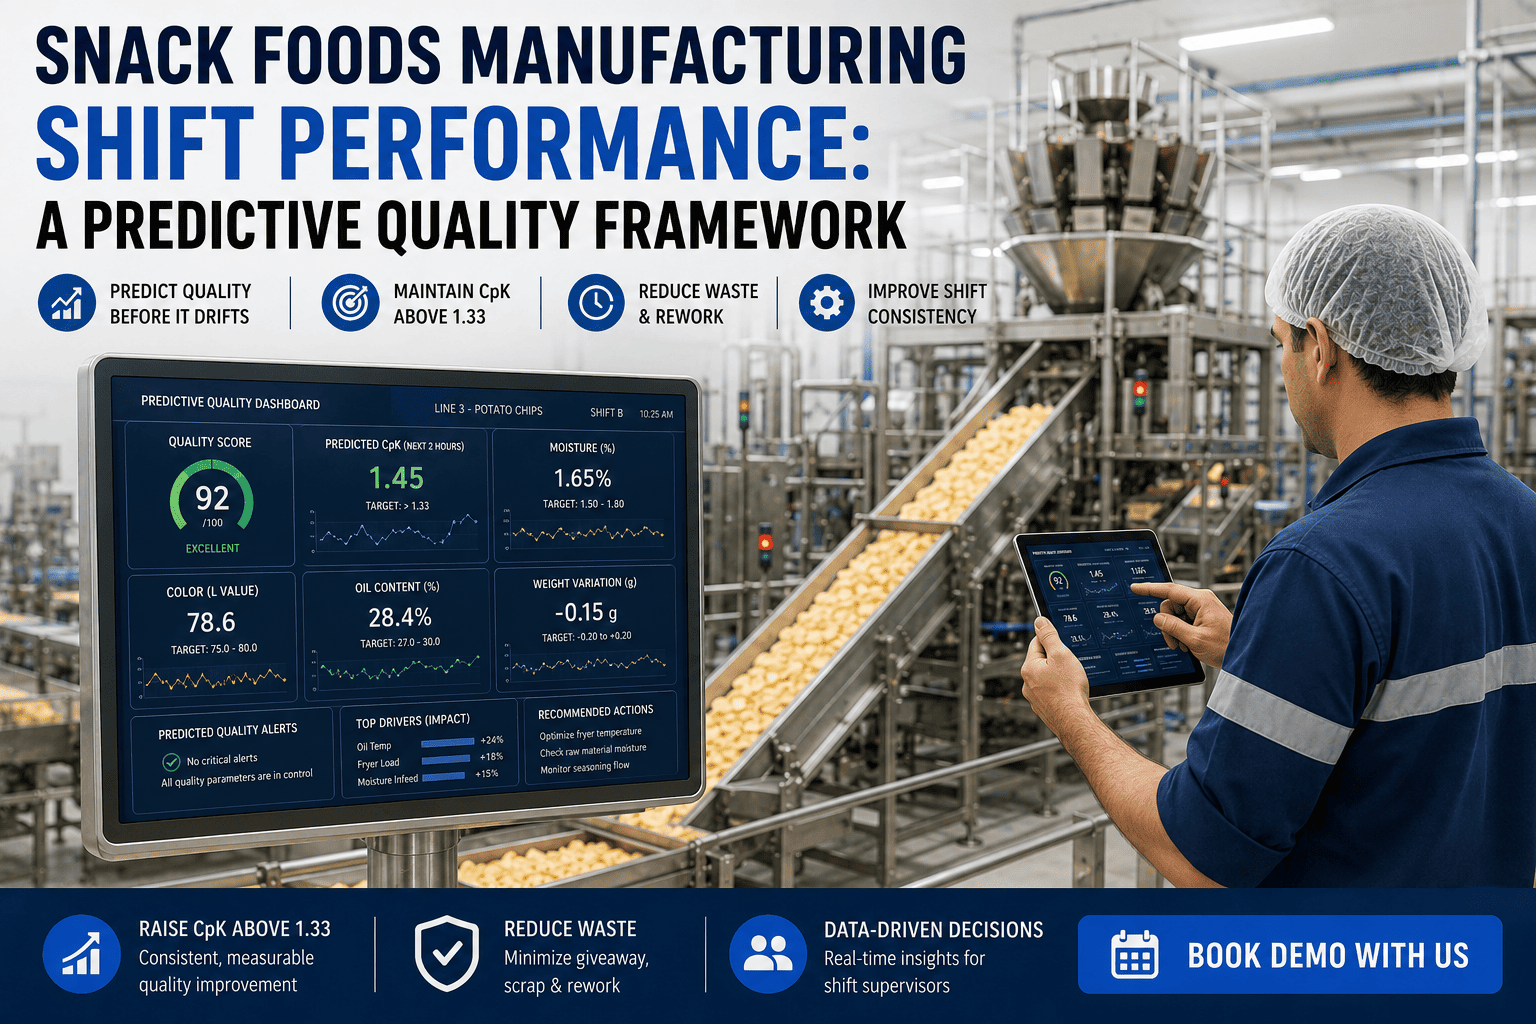
Your shift runs on gut feel. Fryer temperature drifts. You adjust by eye. Moisture creeping up. You manually dial back oven. Multi-head weigher giving away product. You compensate. Color's off on one line. You investigate. You're solving problems in real-time instead of preventing them. By the time you notice a quality shift, you've already produced 500+ cases out of spec. Cpk is stuck at 1.0-1.15. You're capped below 1.33 industry threshold. Predictive quality analytics changes this. AI monitors fryer temperature, moisture sensors, weigher output, color profile, every line every second. Detects drifts before they produce bad product. Predicts color deviation 30 minutes before it happens. Warns you when moisture's trending wrong. Recommends weigher adjustment before giveaway occurs. Your shift prevents quality problems instead of fixing them. Cpk rises to 1.4+. Giveaway drops 30-40%. You're managing quality by forecast, not reaction. This guide shows shift supervisors how predictive quality works, what data drives it, and why leading snack foods manufacturers are automating shift performance to hit Cpk targets consistently. To see predictive quality in action on your line, book a shift performance demo with our team.
Snack Foods · Predictive Quality · Shift Performance
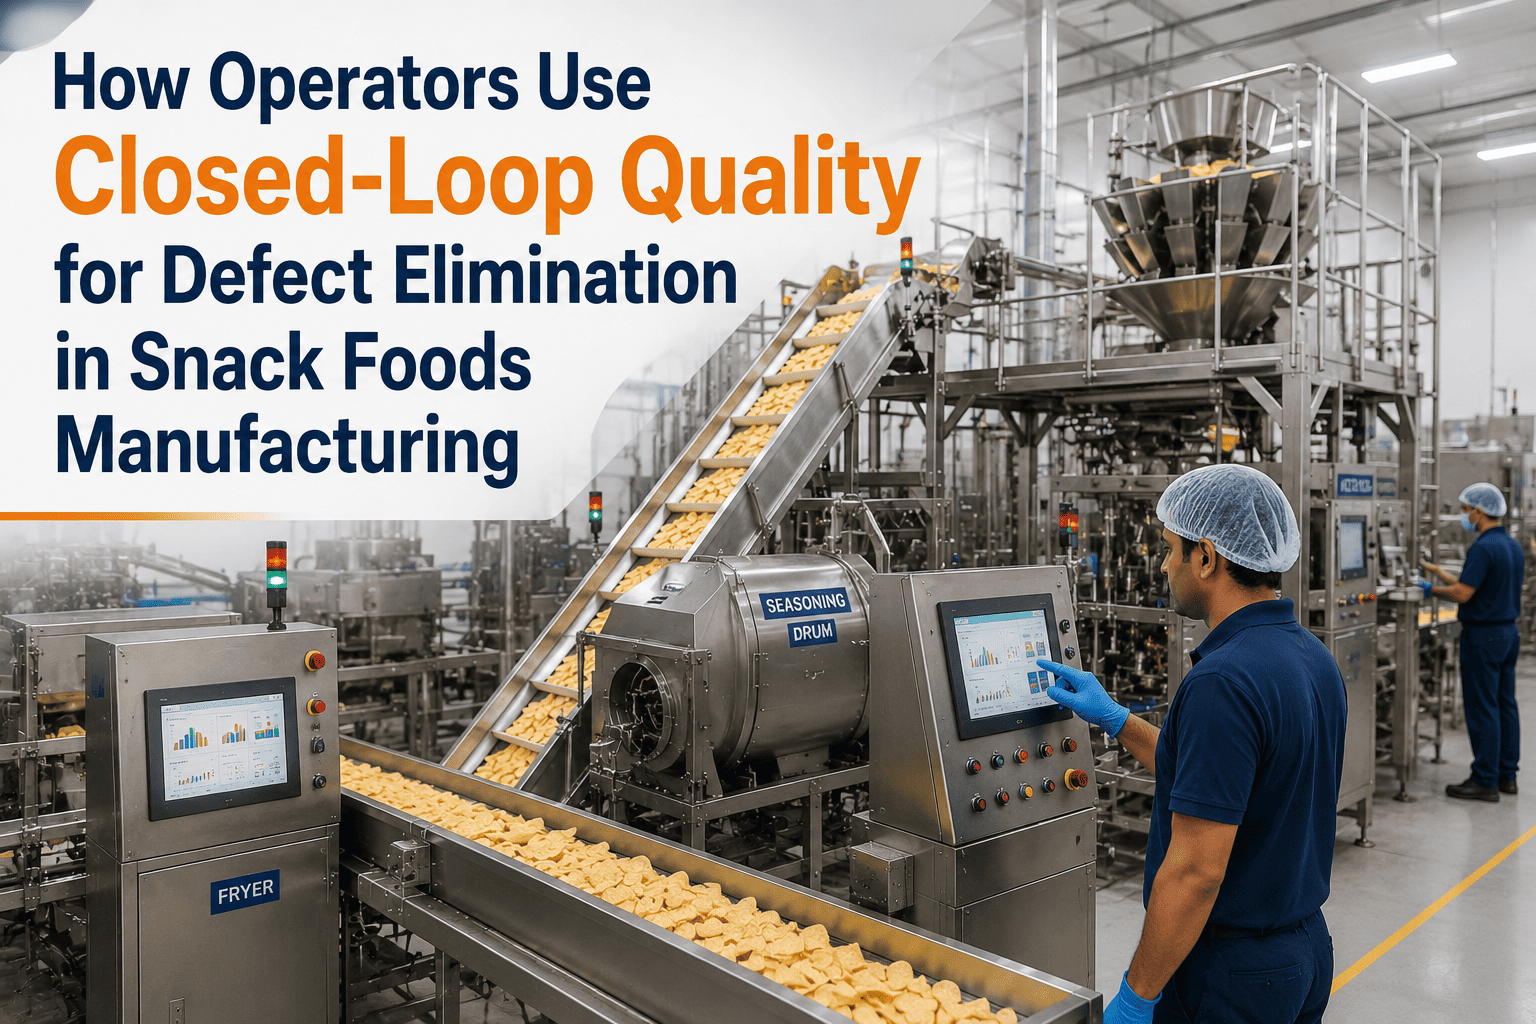
Snack Foods Manufacturing Shift Performance: A Predictive Quality Framework
Real-time quality prediction · Color drift prevention · Moisture optimization · Weigher giveaway elimination · Cpk above 1.33.
1.4+
Cpk target (above industry 1.33 threshold)
30-40%
Giveaway reduction vs manual control
30 min
Early warning before quality deviation
24/7
Continuous shift performance monitoring
Why Shift Supervisors Struggle with Quality and How AI Helps
Your job is simple in theory: keep the line running, maintain quality, hit production targets. In practice, you're managing dozens of variables simultaneously. Fryer oil temperature drifting. Moisture sensors showing upward trend. Multi-head weigher calibration sliding. Color scanner showing slight shift from spec. You catch some problems. You miss others. By the time your lab confirms out-of-spec product, you've made 400-600 cases. Downtime to investigate. Lost production. Off-spec cases sold at discounts. Your Cpk sits at 1.05-1.15. You know it should be 1.33+. You're operating reactively. Predictive quality changes this. AI analyzes your line data in real-time — fryer temperature, moisture trend, weigher drift, color profile, every parameter simultaneously. When any variable starts drifting, AI predicts where it's headed and alerts you 30+ minutes before quality is actually affected. You adjust before bad product is made. Problems prevented instead of reacted to. Cpk climbs to 1.4+. Giveaway drops to minimal levels. You're managing by prediction, not reaction.
Manual Quality Control vs Predictive Quality Automation
1. Monitor & React (throughout shift)
Watch fryer temp gauge. Check moisture sensor reading. Look at weigher output. Manually check color. Adjust by gut feel. By the time you notice a problem, it's already producing out-of-spec product.
2. Spot-Check Quality (random intervals)
Pull samples every 30-60 minutes. Weigh. Check color. Most problems discovered hours after they occur. 300-600 cases already produced out of spec.
3. Lab Confirmation (1-2 hours delay)
Send samples to lab. Wait for results. If out-of-spec, investigate root cause. Line stops. You troubleshoot. Downtime. Lost production. Giveaway.
4. Manual Adjustment (trial & error)
Adjust temperature. Adjust oven. Adjust weigher. Sometimes works. Sometimes doesn't. Takes multiple attempts to correct. More off-spec product. More downtime.
Result: Reactive control. Cpk 1.0-1.15. High giveaway. Production delays.
1. Continuous Monitoring (real-time)
AI monitors all quality parameters every second: fryer temp, moisture trend, weigher drift, color profile. Analyzes 1000s of data points simultaneously.
2. Predictive Alerts (30+ min early warning)
AI detects drift trend. Forecasts where it's headed. Alerts you: "Moisture trending up. Will exceed spec in 28 minutes if current trend continues." You adjust before bad product happens.
3. Recommended Actions (AI-guided)
AI recommends specific adjustment: "Reduce oven to 285°F to stabilize moisture." You make adjustment. Quality prevented.
4. Automatic Documentation (real-time)
Every adjustment logged. Why made. When made. Impact tracked. Your shift performance data captured automatically.
Result: Proactive control. Cpk 1.4+. Minimal giveaway. Consistent production.
Four Quality Problems Shift Supervisors Face — How AI Solves Each
01
Color Drift Across Fryer Cycles — Late Detection, Lost Product
Color varies as fryer oil ages, temperature fluctuates, products cook differently. You spot-check every hour. In that hour, you've made 1,200+ pieces. If color drifts 5 minutes into the cycle, you don't know until your 60-minute check. 1,000+ pieces out of spec. All scrapped or sold as off-color inventory. Predictive quality monitors color in real-time. When it starts to shift, AI forecasts "Color will exceed Delta E tolerance in 22 minutes if current trend continues." You adjust fryer immediately. Color prevented, not discovered after damage done.
Real-time color monitoring30+ min early warningZero color giveaway
02
Moisture Creep — Slow Drift Goes Unnoticed Until Samples Fail
Moisture control is critical for shelf life and crunch. Your oven settings are nominal 280°F. Ambient humidity changes. Air circulation varies. Moisture gradually creeps from 1.2% to 1.8% over 90 minutes. You check samples every hour. By the time lab confirms high moisture, you've produced 1,500+ pieces at wrong moisture. All off-spec. Predictive quality has continuous moisture sensors. Detects 1% drift in 5 minutes. Forecasts "Moisture at current trend will exceed 1.5% spec in 45 minutes. Recommend oven +5°F." You adjust preemptively. Moisture prevented.
Continuous moisture trackingTrend analysisPreventive adjustment
03
Multi-Head Weigher Giveaway — Calibration Creep Costs Thousands
Multi-head weighers drift. You target 50g. Over a shift, calibration creeps. You're actually dispensing 51.2g. Giveaway of 1.2g x 60,000 pieces = 1,200kg lost product per day. You catch it during spot-check. By then, 30,000+ pieces overweight. Predictive quality monitors weigher output every cycle. Detects 0.3g drift. Forecasts "At current trend, next check will fail. Recommend scale adjustment now." You adjust before overweight product is made. Giveaway prevented.
Cycle-by-cycle monitoringDrift detectionGiveaway elimination
04
Cpk Stuck Below 1.33 — Manual Control Can't Achieve Capability
Your process capability is limited by reaction time. You can't adjust fast enough to prevent variation. Cpk stuck at 1.05-1.15. You're missing the 1.33 threshold. Predictive quality enables capability improvement. By preventing problems before they occur, variation shrinks. Your process becomes tighter. Cpk climbs to 1.35-1.50. Capability improves because you're controlling by prediction, not reaction. Same equipment. Same line. Better capability through smarter control.
Variation reductionCpk 1.4+ achievableProcess capability improvement
How Predictive Quality Works: The Real-Time Analytics Engine
Color Profile
Real-time color scanner on line. Captures Delta E every cycle.
Detects Delta E shift. Forecasts time to out-of-spec if trend continues.
Adjust fryer temperature before color drifts out. Zero off-color product.
Moisture Content
Continuous moisture sensors in oven. Data every 2-5 minutes.
Tracks moisture trend. Predicts when it exceeds spec.
Adjust oven settings before moisture problem. Maintain spec consistently.
Multi-Head Weigher
AI integrates PLC data from weigher. Monitors every fill cycle output.
Detects calibration drift. Forecasts when next QC check will fail.
Adjust weigher settings preventively. Eliminate giveaway.
Line Temperature
Integrated SCADA temperature sensors. Real-time monitoring.
Tracks temperature stability. Alerts if trending outside optimal range.
Make micro-adjustments to stabilize. Keep process centered.
Three Shift Performance Scenarios Optimized by Predictive Quality
Your fryer line is running. Color is in spec at 8:00 AM (Delta E 2.1). By 9:15 AM, fryer oil has aged, temperature drifted slightly. Color starts shifting (Delta E 3.2 → trending to 4.5+, which exceeds spec). Manual process: you won't check samples until 9:30 AM. By then, 1,300 pieces made at Delta E 3.8-4.2. All off-spec. Predictive quality detects Delta E trend at 9:17 AM. Forecasts "At current drift rate, you'll hit Delta E 4.5 in 19 minutes. Recommend fryer temperature -2°F." You adjust immediately. Delta E comes back to 2.8 by 9:25 AM. Zero off-color product made. Line stays in spec.
Detection methodReal-time scanner (vs hourly manual checks)
Early warning19 minutes before out-of-spec
Off-color product prevented1,300 pieces (8+ kg product value)
Downtime impactZero. Preventive adjustment made on-the-fly.
Schedule Shift Demo
Mid-morning shift. Ambient humidity increased (seasonal weather change). Your oven is still set to 280°F. Moisture is creeping up: 1.25% → 1.35% → 1.45%. At 10:30 AM, you check samples. Lab comes back high moisture. You've made 1,800 pieces at 1.4-1.6% (over 1.35% spec). Downtime to troubleshoot. Giveaway. Predictive quality has continuous moisture sensors. Detects moisture trend at 10:05 AM: "Moisture rising 0.05% every 10 minutes. At current trend, will exceed 1.35% in 35 minutes." You adjust oven to 285°F. Moisture stabilizes at 1.32%. Zero moisture giveaway. Problem prevented 30+ minutes before it became a quality failure.
Monitoring frequencyContinuous sensors (vs 1-hour manual checks)
Early warning35 minutes before out-of-spec
High-moisture product prevented1,800 pieces (shelf life risk eliminated)
Root cause preventionOven adjustment made before problem occurs
Schedule Shift Demo
Afternoon shift. Multi-head weigher is running. Target: 50.0g nominal, 50.5g max before giveaway penalty. AI integrated with PLC monitors every fill: 50.0, 50.1, 50.2, 50.3, 50.4, 50.5, 50.6g trend. At 2:47 PM, AI detects drift: "Weigher averaging 50.6g (above 50.5g spec). Trend shows continued drift. Next QC check at 3:15 PM will fail unless adjusted now." You check weigher. Finds calibration has crept. Adjusts immediately. At 3:15 PM, QC check passes. Zero overweight pieces. Zero giveaway. Zero downtime. If you'd waited until QC failure, you'd have 3,000+ overweight pieces (150kg+ giveaway) and line stoppage for investigation and recalibration.
Detection methodAI cycle monitoring (vs manual QC checks)
Early warning28 minutes before QC failure
Giveaway prevented150+ kg product (cost: $2,000+)
Downtime preventedZero. Preventive maintenance before failure.
Book Demo
What Predictive Quality Delivers to Shift Supervisors
1.4+
Cpk achievable (above 1.33 threshold)
Shift supervisors using predictive quality consistently hit Cpk 1.35-1.50.
30-40%
Giveaway reduction
Color drift, moisture problems, weigher giveaway prevented before product made.
30+ min
Early warning before quality fails
AI forecasts problems 30+ minutes before they impact production.
Shift Control
Proactive instead of reactive
Prevent problems. Don't discover them after damage done.
Frequently Asked Questions
Hit Cpk 1.4+ With Predictive Quality Analytics
Shift supervisors in leading snack foods manufacturers are hitting Cpk 1.35-1.50 consistently by controlling with prediction instead of reaction. Predictive quality gives you 30+ minutes warning before quality problems occur. Prevent color drift, moisture problems, and weigher giveaway before they impact your shift.
Predictive Quality Analytics
Color Drift Prevention
Moisture Optimization
Weigher Giveaway Elimination
Cpk 1.4+ Achievement