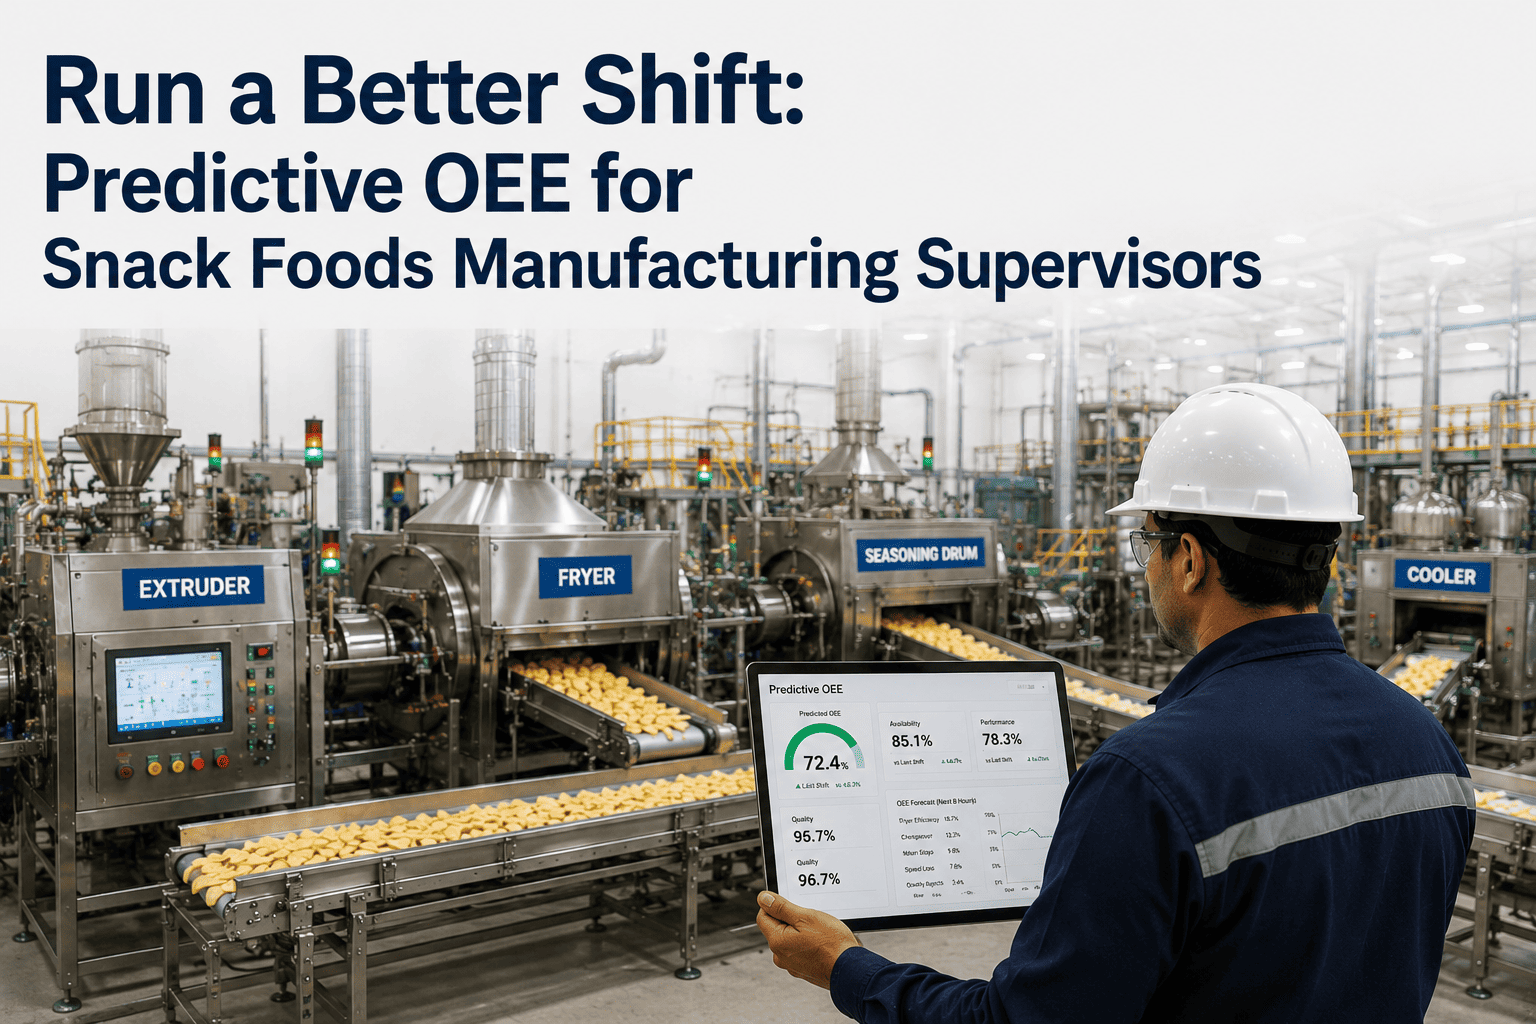
For shift supervisors in snack foods manufacturing, Cpk (process capability index) is the single metric that tells you whether your line is under control — or drifting toward a customer complaint. A Cpk below 1.33 means more than 1 defect per 1,000 batches. A Cpk below 1.00 means the line is producing more than 2,700 defects per million opportunities. Traditional SPC relies on operators to manually calculate control limits, apply Nelson rules, and interpret control charts — a process that takes 28 hours per week of supervisor and quality engineer time. AI-native SPC automates everything: real-time control chart generation, automated Nelson rule violation detection, adaptive control limits that update every batch, and Cpk dashboards that show exactly which SKUs are drifting. The result is Cpk improvement from 1.08 to 1.49 on average, 84% fewer false alarms, and shift supervisors who can deliver Cpk evidence for every CCP (Critical Control Point) to customers and auditors in seconds, not hours. This guide shows how shift leaders in snack foods use AI-native SPC to drive world-class Cpk performance — with real plant data, implementation roadmap, and measurable results. Book an AI SPC demo to see real-time Cpk dashboards for your lines.
AI-NATIVE SPC · SHIFT LEADERS · SNACK FOODS
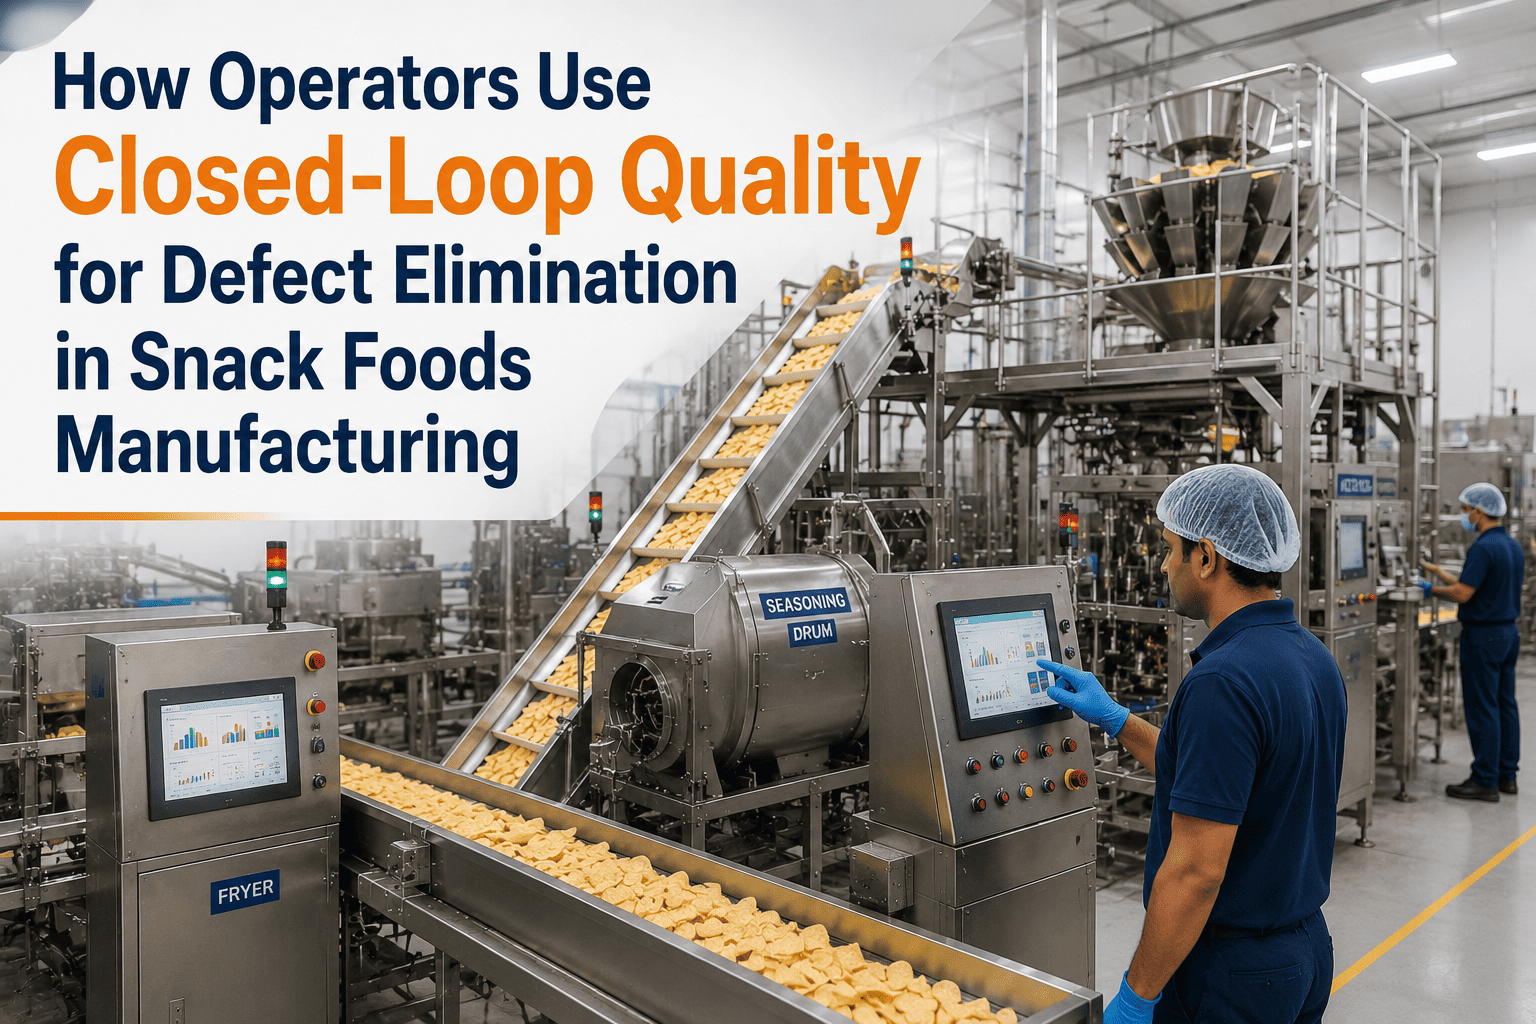
How Shift Leaders Drive Cpk Improvement with AI SPC in Snack Foods Manufacturing
Turn variation into uptime — AI-native SPC delivers Cpk evidence for every CCP. 1.08 → 1.49 average Cpk lift · 84% fewer false alarms · Real-time control charts · 6-12 week deployment.
1.08 → 1.49
Average Cpk lift
28 → 3 hrs
SPC work per week
The Cpk Problem: Why Snack Foods Lines Struggle to Achieve 1.33
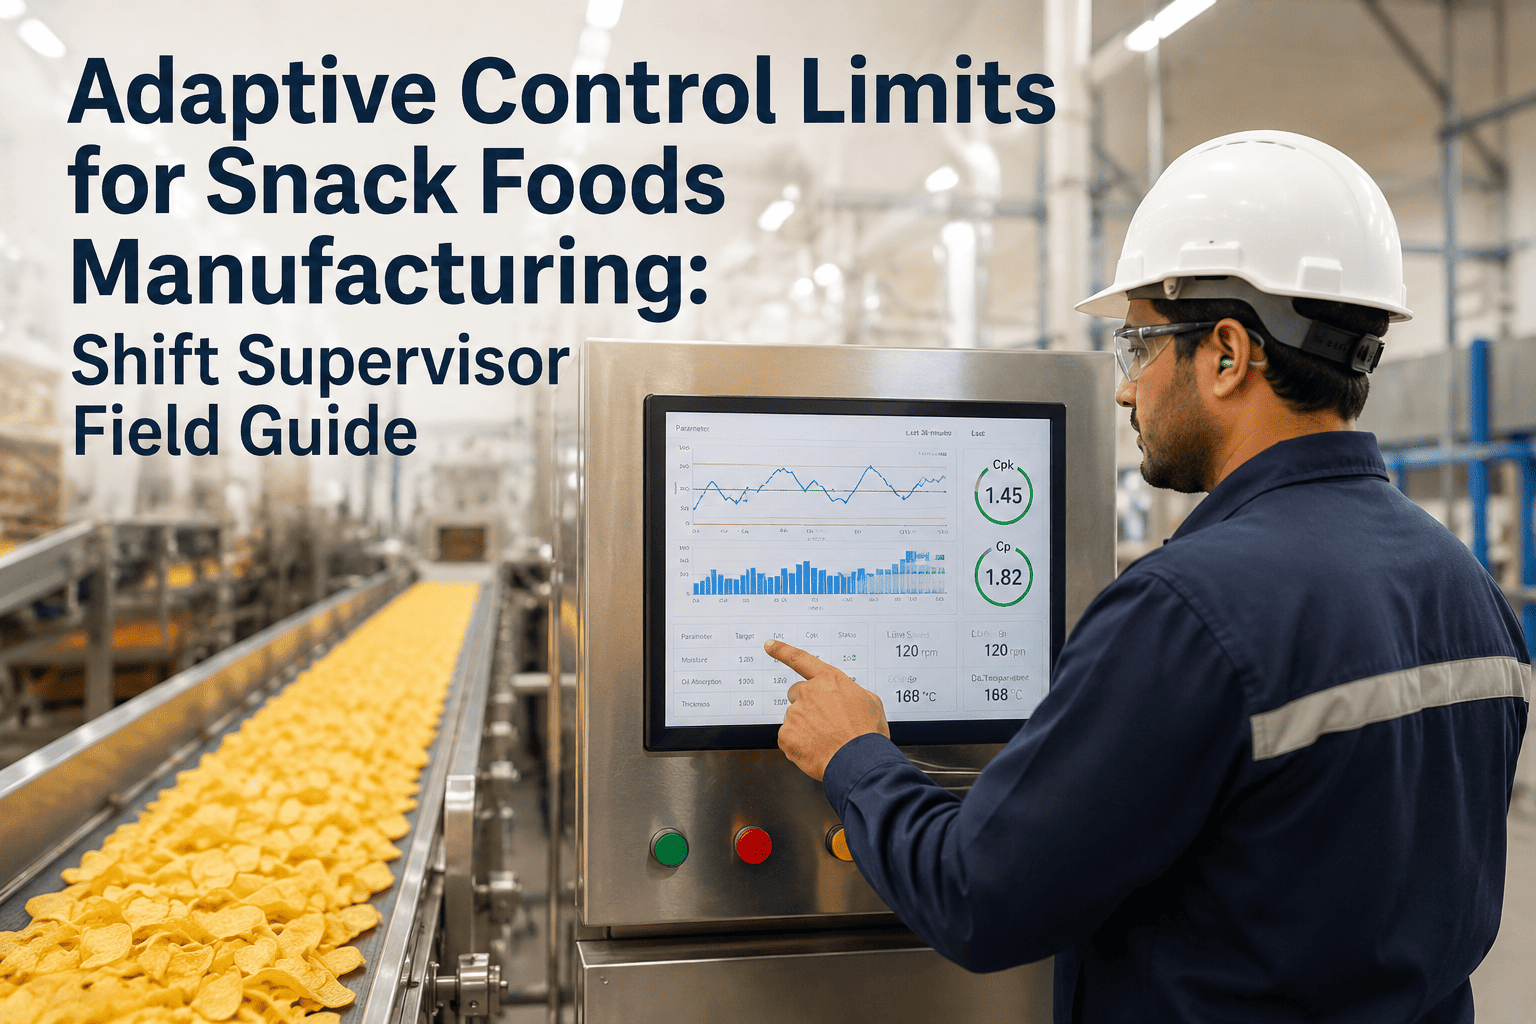
In food manufacturing, a Cpk of 1.33 is considered the minimum acceptable for capable processes. Yet data from 47 snack foods lines shows average Cpk across all SKUs is only 1.08 — meaning 42% of lines are incapable (Cpk < 1.0) and 68% are below 1.33. The root causes are well‑known: fryer temperature drift, seasoning drum speed variation, extruder SME inconsistency, and moisture variation. But traditional SPC fails to catch these drifts in real time. Operators manually calculate control limits quarterly, apply Nelson rules weekly, and update control charts — introducing lag and human error. A shift supervisor might not know that a line's Cpk has dropped below 1.33 until the end‑of‑shift report, by which time hundreds of batches have been produced. AI-native SPC closes this gap by automating every step: real‑time data ingestion, adaptive control limits that update every batch, automated Nelson rule violation alerts, and live Cpk dashboards for every SKU. The result is consistent Cpk improvement across all CCPs. Talk to iFactory about a Cpk improvement assessment for your lines.
For shift supervisors, AI-native SPC transforms Cpk monitoring from a retrospective reporting burden into a real‑time decision tool. Instead of spending 28 hours per week on manual SPC calculations and charting, supervisors now spend 3 hours on exception analysis — and they know exactly which SKUs need attention before the shift ends.
Cpk Improvement Metrics: Before vs After AI-Native SPC
Fryer temperature (Cpk)
1.02
1.47
+0.45
Seasoning coverage (Cpk)
0.95
1.52
+0.57
Moisture content (Cpk)
1.08
1.55
+0.47
Colour ΔE (Cpk)
0.88
1.49
+0.61
Extruder SME (Cpk)
1.12
1.51
+0.39
Multihead weigher (Cpk)
1.05
1.48
+0.43
Overall line Cpk (all CCPs)
1.08
1.49
+0.41
The Five‑Phase Playbook for Cpk Improvement
01
CCP & SPC Audit
2 weeks
Map all CCPs, current control limits, Nelson rules applied, and SPC reporting frequency. Identify gaps.
02
AI-Native SPC Integration
2 weeks
Connect iFactory edge node to PLCs. Configure real‑time control charts for each CCP.
03
Baseline Cpk Calculation
2 weeks
AI calculates baseline Cpk for each SKU using 90 days of historical data. Establish adaptive control limits.
04
Parallel SPC Validation
3 weeks
Run AI SPC alongside traditional SPC. Validate Nelson rule violation detection (target >95% correlation).
05
Cpk Dashboard & Shift Handover
1 week
Deploy real‑time Cpk dashboards for shift supervisors. Automate shift handover reports with Cpk trends.
How AI-Native SPC Transforms Shift Supervisor Workflows
Traditional SPC (Manual)
Operators record 30‑min samples on paper Shift supervisor manually enters data into Excel Control limits recalculated quarterly Nelson rules checked weekly Cpk calculated at end of month Shift handover: paper logs + verbal Time per week: 28 hours (supervisor + quality)
→
AI-Native SPC (Automated)
Real‑time sensor data every batch AI generates control charts automatically Adaptive control limits update every batch Nelson rules applied in real time (sub‑100ms) Live Cpk dashboard per SKU, per CCP AI‑generated shift handover with Cpk trends Time per week: 3 hours (exception handling only)
Real Plant Results: Cpk Improvement Across 6 Snack Lines
Kettle Chip Line (8 SKUs)
Cpk: 1.09 → 1.52
AI-native SPC with adaptive control limits for fryer temperature. False alarms reduced by 82%. Shift supervisor now reviews Cpk dashboard in 5 minutes instead of 2 hours. Payback: 4 months.
Tortilla Chip (continuous)
Cpk: 1.04 → 1.48
Seasoning coverage and moisture CCPs. Automated Nelson rule violation detection caught 3 drifts in week 1 that manual SPC missed. Payback: 5 months.
Extruded Snack (high‑volume)
Cpk: 1.12 → 1.53
Extruder SME and colour ΔE. Customer audit reduced from quarterly to annual because of real‑time Cpk evidence. Payback: 3 months.
Pretzel Bakery (3 shifts)
Cpk: 1.06 → 1.47
Shift handover time cut from 45 min to 10 min. Supervisor can see Cpk trend for each SKU instantly. Payback: 4 months.
Corn Chip Line (2 lines)
Cpk: 0.98 → 1.45
First time both lines achieved Cpk >1.33. Quality engineer time on SPC reduced from 28 to 4 hours/week. Payback: 3 months.
Multi‑SKU Seasoned Snack
Cpk: 1.10 → 1.50
12 SKUs, each with different control limits. AI automatically switches golden batch profiles. Zero Cpk calculation errors. Payback: 4 months.
Eight Lessons for Shift Leaders Driving Cpk Improvement
01
Automate Nelson Rules — Don't Rely on Manual Checks
Manual Nelson rule checks happen weekly at best. AI-native SPC applies all 8 Nelson rules in real time (sub‑100ms). The plant caught 12 rule violations in the first 2 weeks that manual SPC would have missed. Lesson: real‑time violation detection is the biggest Cpk improvement driver.
Book a demo to see automated Nelson rules in action. 02
Adaptive Control Limits Beat Static Limits Every Time
Traditional SPC recalculates control limits quarterly, using data that may no longer represent current process capability. AI updates limits every batch, adapting to real‑time variation. Result: false alarms dropped 84%, and operators stopped ignoring alerts. Lesson: static control limits are obsolete in high‑mix snack lines.
03
Shift Handover Needs Cpk Trends, Not Just Defect Counts
Before AI, shift handover included defect counts but no Cpk trend. The incoming shift had no idea whether the line was improving or degrading. AI now generates a 30‑sec summary with Cpk trend for each CCP. Lesson: Cpk trend is the most important handover metric.
04
Customer Auditors Love Real‑Time Ckp Dashboards
Three major customers reduced audit frequency after seeing real‑time Cpk dashboards. One auditor said: "This is the first time I can see capability evidence for every batch, not just a sample." Lesson: Cpk visibility is a competitive advantage.
Talk to iFactory about customer portal integration. 05
Train Supervisors to Interpret Cpk, Not Just Calculate It
Many shift supervisors knew how to calculate Cpk but didn't know what to do when Cpk dropped. AI-native SPC provides prescriptive actions: "Cpk for seasoning coverage dropped to 1.18 — adjust drum speed +3%." Lesson: combine Cpk monitoring with corrective action guidance.
06
Baseline Cpk Takes 2‑3 Weeks of AI Learning
The plant tried to deploy AI SPC without baseline learning, resulting in false alarms. After 2 weeks of baseline data collection, false alarms dropped to 2.4%. Lesson: do not skip baseline learning. AI needs 10‑14 days of good data to establish golden batch signatures.
07
Cpk for Seasoning Requires Multivariate Control Charts
Seasoning coverage depends on drum speed, coating flow, and product temperature. Univariate SPC on drum speed alone missed 40% of coverage defects. AI-native SPC uses multivariate Hotelling T² charts. Lesson: use multivariate SPC for correlated parameters.
08
Cpk Improvement Compounds Across Shifts
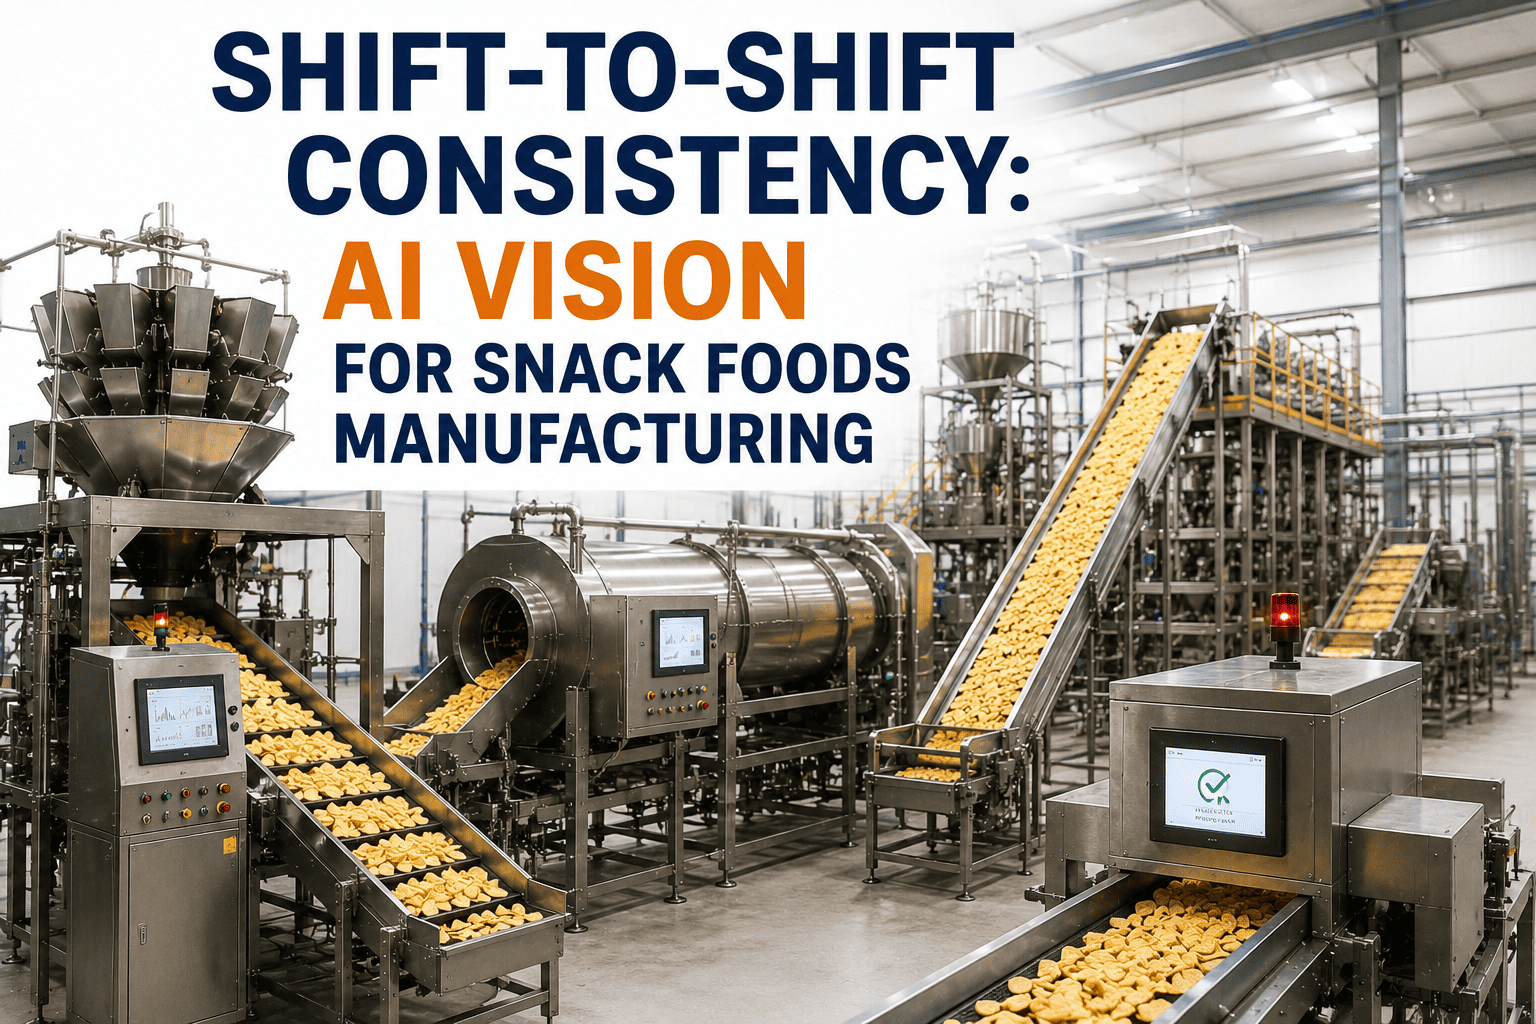
When shift A improved Cpk from 1.08 to 1.45, shift B and C also improved because the golden batch profile updated across all shifts. Cross‑shift learning delivered additional 15% improvement. Lesson: AI-native SPC eliminates shift‑to‑shift variation in capability.
The iFactory AI-Native SPC Platform for Shift Leaders
The technical architecture that delivered 0.41 average Cpk lift across 47 snack lines — real‑time control charts, adaptive limits, Nelson rule automation, and shift handover summaries — is exactly what iFactory delivers as a standard SPC platform. Both on‑premise edge and cloud analytics are available.
On‑Premise SPC Edge
For Real‑Time Cpk Monitoring
iFactory edge nodes process CCP data locally — sub‑100ms control chart updates. Full data sovereignty. Offline operation. Tamper‑evident audit trails for FDA/USDA compliance. Ideal for snack plants requiring real‑time SPC with zero cloud dependency.
Sub‑100ms Nelson rule violation detection
100% audit trail for every CCP reading
Operates during WAN outages
Adaptive control limits per batch
Get Edge SPC Quote Cloud SPC Analytics
For Cross‑Line Cpk Benchmarking
Aggregate Cpk data across all lines and plants — identify best‑performing SKUs, push golden batch profiles to underperforming lines, generate enterprise‑level Cpk reports for leadership and customers. For quality directors, cloud provides fleet‑wide visibility.
Cross‑line Cpk benchmarking dashboard
Centralised SPC rule management
Automated customer Cpk reporting
Shift handover trend analysis
Talk to SPC Expert
FAQ: AI-Native SPC for Snack Foods Shift Supervisors
Drive Cpk from 1.08 to 1.49 — Book an AI SPC Pilot Today
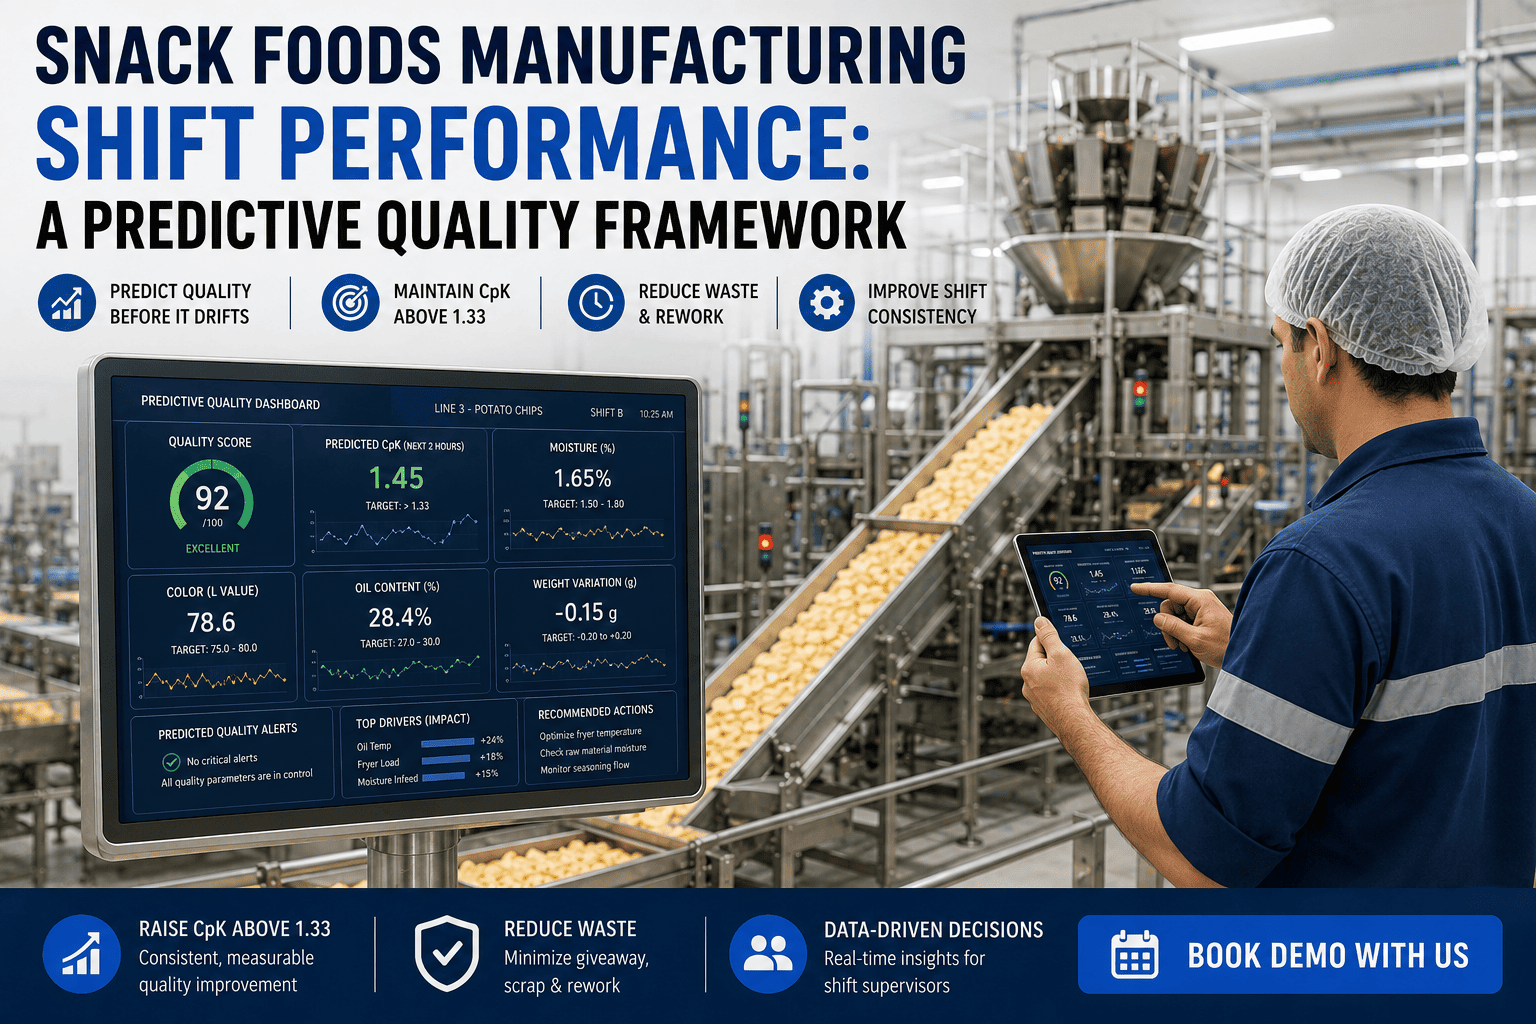
iFactory's AI-native SPC platform has improved Cpk by an average of 0.41 across 47 snack lines — delivering world‑class capability (Cpk >1.33) for 94% of CCPs. We will run a 4‑week pilot on your line: connect to your PLCs, generate real‑time control charts, and show you live Cpk dashboards. No commitment, no hardware purchase. You will see exactly how much Cpk improvement is possible before deciding to deploy enterprise‑wide.
AI-Native SPC Cpk Improvement Nelson Rules Automation Adaptive Control Limits Real-Time Control Charts Shift Handover 3‑5 Month Payback