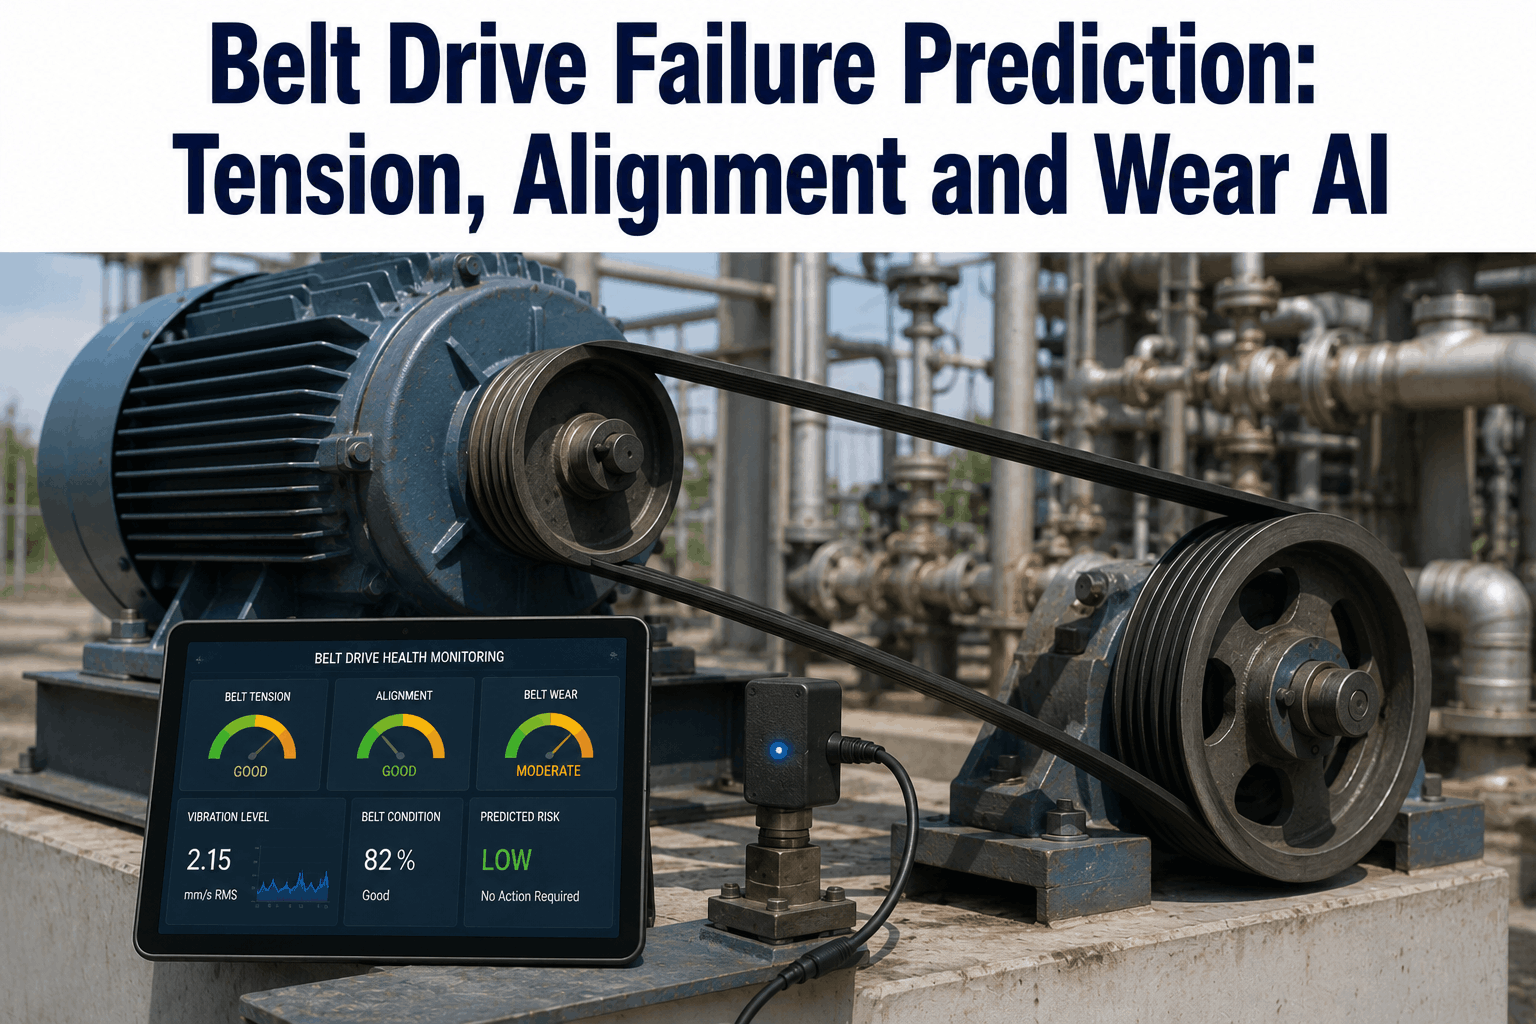
AI monitors belt drive vibration signatures to detect misalignment, tension loss, belt wear, and sheave groove damage — giving maintenance teams early warning of developing belt drive failures before unexpected belt breakage stops production. Start Trial Free to see how iFactory gives rotating equipment engineers the belt-drive-specific vibration analysis needed to predict belt drive failures on critical fans, pumps, and compressors before unplanned downtime occurs.
Predict Belt Drive Failures Before Tension Loss and Wear Cause Unexpected Breakage
iFactory analyzes belt frequency harmonics, sheave runout signatures, and sidebands to detect misalignment, tension degradation, belt wear, and groove damage — providing condition-based replacement timing that eliminates both premature replacement and unexpected failure.
Why Belt Drives Fail Without Warning in Conventional Monitoring Programs
Belt drives are often excluded from continuous vibration monitoring programs because they are perceived as low-cost, easily replaced components. The consequence of this exclusion is that belt failures — which shut down fans, cooling towers, compressors, and conveyors — occur without warning and at the worst possible operating time. Belt drives fail progressively through identifiable stages: tension loss changes the belt frequency signature, misalignment accelerates sidewall wear and produces sideband modulation, and groove damage alters the belt mesh frequency pattern — all of which appear in vibration spectra before the belt breaks or slips. AI vibration analysis trained on belt-drive-specific spectral features detects these stages early enough to schedule replacement at the next planned maintenance window rather than responding to an emergency call. Engineering teams that Book a Demo with iFactory see how belt frequency monitoring changes the failure profile of fan and pump drive systems.
-
Belt Frequency Harmonic Tracking
iFactory tracks belt frequency harmonics calculated from drive geometry — monitoring amplitude trends at belt pass frequency and its harmonics as indicators of belt condition, tension change, and developing defects.
-
Tension Loss Detection
Undertensioned belts produce elevated belt frequency vibration and increased slippage-related sidebands. iFactory monitors belt frequency amplitude trends and belt-to-sheave speed ratio changes as tension degradation indicators.
-
Belt Drive Misalignment Classification
Angular and parallel misalignment of belt drive sheaves produces sidebands around the belt frequency and sheave runout components. iFactory classifies misalignment type and severity from sideband spacing and amplitude ratios.
-
Sheave Groove Damage Detection
Worn or damaged sheave grooves produce periodic impulses at the belt-sheave mesh frequency and its harmonics. iFactory detects groove damage through elevated mesh harmonics and changes in the belt frequency harmonic pattern.
-
Belt Wear and Cracking Signatures
Belt cracking, cord separation, and surface wear produce impulsive vibration content at belt defect frequencies — once-per-belt-revolution impacts that iFactory detects through cepstrum analysis and high-frequency envelope demodulation.
-
Multi-Belt Drive Set Comparison
iFactory compares belt frequency signature profiles across matched belt sets on multi-groove drives — identifying individual belt or groove lane conditions that would be masked by aggregate vibration measurements on the sheave bearing.
Belt Drive Failure Mode Analysis: Key Vibration Indicators
-
Belt Frequency Harmonics: Primary Condition Indicator
Core IndicatorBelt frequency is calculated from the belt length and drive speed — the frequency at which any given point on the belt completes one revolution of the drive system. Elevated amplitude at belt frequency and its harmonics (2X, 3X belt frequency) indicates belt condition changes including wear, localized damage, and tension variation. iFactory calculates belt frequency from entered drive geometry data (belt length, sheave diameters, center distance) and tracks amplitude trends at belt frequency harmonics over time — detecting the gradual amplitude increase that precedes visible belt condition deterioration. For V-belt drives, the belt frequency is typically in the range of 5 to 25 Hz depending on drive geometry, making it resolvable in standard vibration spectra without high-frequency instrumentation. Teams that Start Trial can configure belt frequency tracking by entering drive geometry data in iFactory's belt drive template.
Frequency Calculation
Belt length and sheave diameter from drive geometry data entry
Tracked Harmonics
1X through 5X belt frequency per drive
iFactory Record
Belt frequency harmonic amplitude trend per drive unit
-
Undertension Detection: Slippage Sidebands and Speed Ratio Drift
Tension ConditionBelt tension is the parameter most frequently neglected in belt drive maintenance programs — and undertension is the leading cause of premature belt failure through slippage heat generation and accelerated wear. An undertensioned belt slips on the sheave, producing a measurable difference between the calculated drive ratio and the actual driven shaft speed, and generating sidebands around the driven shaft fundamental frequency at the slippage frequency. iFactory monitors the driven-to-drive shaft speed ratio against the design gear ratio for belt drives with speed measurement on both shafts — flagging ratio drift greater than 0.5% as an undertension indicator. For drives with single-shaft speed measurement, iFactory uses the sideband pattern around the driven shaft fundamental as the tension indicator. Teams that Book a Demo can review undertension detection configuration for their specific drive types and speed measurement availability.
Primary Indicator
Speed ratio drift >0.5% from design drive ratio
Secondary Indicator
Slippage sidebands around driven shaft fundamental
iFactory Record
Speed ratio and sideband amplitude trend per belt drive
-
Sheave Misalignment: Sideband Modulation and Axial Vibration
Alignment ConditionSheave misalignment — both angular and parallel offset — causes the belt to run with uneven tension distribution across its width, producing vibration sidebands around the belt frequency at the sheave rotation frequency and elevated axial vibration on the sheave shaft bearing. iFactory tracks the sideband family around the belt frequency harmonics, the spacing of which corresponds to the sheave rotation frequency, and the axial-to-radial vibration ratio on sheave shaft bearings — classifying the combination as angular or parallel misalignment. Belt drive misalignment accelerates edge wear on V-belts and produces uneven groove loading on synchronous and poly-V drives — shortening belt service life and loading sheave bearings in the axial direction beyond their design ratings. Correct alignment classification enables technicians to apply the right correction without trial-and-error shimming during belt replacement.
Spectral Indicator
Sidebands at belt frequency ± sheave rotation frequency
Phase Indicator
Elevated axial vibration on sheave shaft bearings
iFactory Record
Sideband pattern and axial ratio tracked per drive unit
-
Sheave Groove Wear and Damage: Mesh Harmonic Elevation
Sheave ConditionSheave grooves wear through contact with the belt under tension, with wear rate accelerating when misalignment distributes load unevenly across the groove profile. Worn grooves allow belts to bottom-contact the groove root, changing the effective pitch diameter and altering the drive ratio. Damaged or unevenly worn grooves produce periodic vibration impulses at the belt mesh frequency — the rate at which belt elements enter and exit each groove — and elevated harmonics that grow with groove damage severity. iFactory tracks mesh frequency harmonic amplitudes as sheave groove health indicators, flagging trends that indicate groove wear is advancing to the point where groove geometry no longer provides adequate belt engagement. Early groove wear detection enables groove re-machining or sheave replacement during planned maintenance rather than emergency replacement when the belt slips due to inadequate groove contact.
Spectral Indicator
Elevated mesh frequency harmonics and sub-harmonics
Drive Ratio Effect
Effective pitch diameter change from bottom-contact operation
iFactory Record
Mesh harmonic amplitude trend per sheave unit
-
Belt Cracking and Cord Separation: Defect Frequency Impulsive Content
Belt Structural ConditionA belt with a crack, cord separation, or localized hard spot produces an impulse once per belt revolution as the defect location passes over the drive and driven sheaves. This once-per-belt-revolution impulsive content appears in high-frequency envelope spectra at the belt defect frequency — a low frequency that corresponds to the belt rotation rate, typically 0.5 to 3 Hz for standard industrial belt drives. iFactory applies high-frequency envelope demodulation and cepstrum analysis to detect the repetitive impulsive content at belt defect frequencies — identifying structural belt damage before the crack propagates to failure. This detection method is particularly effective for synchronous belt drives, where tooth breakage and cord separation produce well-defined impulsive content at predictable defect frequencies. Teams that Start Trial can configure belt defect frequency monitoring for both V-belt and synchronous belt drives.
Detection Method
High-frequency envelope demodulation and cepstrum analysis
Defect Frequency
Once-per-belt-revolution: typically 0.5–3 Hz
iFactory Record
Defect frequency amplitude trend per belt drive with severity staging
-
Sheave Bearing Acceleration: Indirect Belt Load Indicator
Bearing Health ContextBelt tension applies radial load to sheave shaft bearings — and changes in belt tension, whether from normal degradation or emergency undertension, appear as changes in the bearing vibration signature. Overtensioned belts produce elevated bearing defect frequency amplitudes from increased radial loading; undertensioned belts produce the slippage signatures already described. iFactory monitors sheave bearing vibration alongside belt frequency indicators — using the bearing health context to corroborate belt condition assessments and provide early warning of bearing damage induced by sustained tension abnormality. When belt undertension has persisted long enough to induce bearing defect development, the combined belt frequency and bearing defect indicator tells maintenance engineers that the required intervention scope is belt replacement plus bearing inspection, not belt adjustment alone. Teams that Book a Demo can see how iFactory combines belt and bearing monitoring for belt drive systems.
Bearing Indicators
BPFO, BPFI, BSF tracked on sheave shaft bearings
Combined Alert
Belt abnormality + bearing defect triggers expanded scope
iFactory Record
Belt and bearing condition correlated per drive history
Belt Drive Monitoring Performance Indicators
Failure Warning Lead Time by Method
AI belt drive analysis provides 45 days of failure warning lead time versus 2 days for visual inspection — enabling planned replacement at a convenient maintenance window on every monitored drive.
Detection Rate by Failure Mode
iFactory achieves 94% detection rate for tension loss and 91% for misalignment — the two failure modes responsible for over 70% of belt drive failures in industrial equipment populations.
Belt Replacement Cost vs Failure Mode
Emergency belt failure replacement including production downtime, expedited parts, and after-hours labour costs 8x more than planned condition-based belt replacement scheduled during normal maintenance windows.
Belt Service Life Extension from Condition Monitoring
Average belt service life (indexed to Y1)
Condition-based belt replacement combined with tension and alignment correction progressively extends average belt service life — reaching 162% of the pre-monitoring baseline by year 5.
Belt Drive Failure Mode Reference: Vibration Specifications
Scroll for more
| Failure Mode | Primary Spectral Feature | Secondary Indicator | iFactory Detection Method | Corrective Action |
|---|---|---|---|---|
| Undertension | Slippage sidebands, speed ratio drift | Elevated belt frequency harmonics | Speed ratio monitoring + sideband analysis | Re-tension to specification |
| Sheave Misalignment | Sidebands at belt freq ± sheave speed | Elevated axial bearing vibration | Sideband family + axial ratio analysis | Align sheaves — angular or parallel correction |
| Sheave Groove Wear | Elevated mesh frequency harmonics | Drive ratio drift from pitch change | Mesh harmonic trend + ratio monitoring | Re-machine or replace sheave |
| Belt Cracking | Impulsive at belt defect frequency | High-frequency envelope elevation | Envelope demodulation + cepstrum analysis | Replace belt at next planned window |
| Overtension | Elevated bearing defect frequencies | Increased radial bearing loading | Bearing defect trend + load correlation | Reduce tension to specification |
How iFactory Supports Belt Drive Predictive Maintenance Programs
Belt drives are among the most maintenance-intensive mechanical components in rotating equipment populations — but most facilities rely on fixed-interval replacement schedules or run-to-failure because continuous vibration monitoring for belt drives has historically required specialized analysis expertise. iFactory removes this barrier by automating belt frequency calculation from drive geometry data, tracking harmonic amplitude trends and sideband patterns continuously, and classifying detected conditions against the specific failure mode signatures for each belt drive type in the monitored population. When iFactory detects a developing undertension condition on a critical cooling tower fan drive — trending slippage sidebands, a 0.8% speed ratio drift, and mildly elevated belt frequency harmonics over a six-week period — maintenance planners have the lead time to schedule belt tensioning or replacement at the next planned maintenance window rather than responding to a fan trip during peak summer demand. Facilities can Start Trial and begin belt drive monitoring on priority drives by entering geometry data into iFactory's belt drive configuration template.
Belt Frequency Auto-Calculation
iFactory calculates belt frequency from entered drive geometry — belt length, sheave diameters, and center distance — automating the frequency identification that analysts previously computed manually per drive configuration.
Tension and Slippage Monitoring
iFactory tracks speed ratio drift and slippage sideband patterns as continuous tension indicators — detecting undertension progression weeks before the belt begins visible slipping or generating frictional heat damage.
Misalignment Sideband Classification
iFactory identifies sheave misalignment type from sideband family analysis around belt frequency harmonics combined with axial vibration ratios — providing the alignment correction direction without additional diagnostic measurement.
Multi-Drive Fleet Comparison
iFactory compares belt frequency signature profiles across similar drives in the monitored fleet — identifying outlier drives where belt or sheave condition has deviated from the population norm for prioritized inspection.
Deploying Belt Drive Predictive Maintenance: Implementation Steps
01
Catalogue Belt Drive Inventory and Geometry
Compile drive geometry data for each belt drive in the monitored population — belt type, pitch length, sheave diameters, center distance, and number of grooves — entering this data into iFactory's belt drive template to enable belt frequency auto-calculation.
02
Confirm Vibration Sensor Placement Adequacy
Verify that vibration sensors on sheave shaft bearings are positioned to capture both radial and axial vibration — the axial component is required for misalignment classification and is often absent on standard bearing housing mounts oriented only in the radial direction.
03
Establish Belt Drive Baseline Spectra
Run iFactory's baseline acquisition on each priority belt drive under verified good condition — immediately after tension check and alignment verification — to create reference spectral profiles that trend monitoring compares against.
04
Configure Alert Thresholds by Drive Criticality
Define belt frequency harmonic amplitude, sideband level, and speed ratio drift thresholds in iFactory for each drive criticality tier — setting tighter alert bands for drives on production-critical equipment and wider bands for non-critical auxiliary drives.
05
Integrate Belt Replacement Records into iFactory
Log belt replacement dates, tension settings, and alignment records in iFactory's maintenance history — enabling the correlation between belt drive condition indicators and actual service life data that improves replacement timing prediction.
06
Review Belt Drive Condition Portfolio Monthly
Schedule monthly reviews of iFactory's belt drive condition summary — comparing tension indicators, misalignment signatures, and groove wear trends across the full belt drive population to prioritize condition-based interventions. Book a Demo to see the full belt drive monitoring workflow.
Frequently Asked Questions
How does AI detect belt tension loss from vibration data?
Belt undertension causes measurable speed ratio drift between drive and driven shafts due to slippage, and generates slippage sidebands around the driven shaft fundamental frequency. iFactory monitors speed ratio against the design belt drive ratio and tracks sideband amplitude trends — detecting tension degradation weeks before slippage becomes severe enough to cause heat damage or belt failure.
What is belt frequency and how is it calculated?
Belt frequency is the rate at which any fixed point on the belt completes one full circuit of the drive system — calculated from the belt pitch length divided by the belt velocity. iFactory calculates belt frequency automatically from entered drive geometry data, tracking vibration amplitude at belt frequency and its harmonics as the primary belt condition indicator.
Can iFactory monitor synchronous belt drives as well as V-belt drives?
Yes. iFactory monitors both synchronous (timing belt) and V-belt drives. For synchronous drives, tooth mesh frequency and its harmonics are added to the monitoring template — enabling tooth breakage, cord separation, and tensioner failure detection specific to synchronous belt drive failure modes.
What sensors are required for belt drive vibration monitoring?
Accelerometers on the sheave shaft bearing housings on both drive and driven sides provide the measurement foundation. Axial and radial measurements at each bearing enable misalignment classification. A speed signal from at least the drive shaft is required for belt frequency calculation; speed signals from both shafts enable speed ratio drift monitoring for tension assessment.
How does belt drive monitoring integrate with belt replacement planning?
iFactory generates condition-based belt replacement recommendations when monitored indicators — belt frequency amplitude trend, slippage sidebands, defect frequency content — reach configured thresholds. Replacement work orders are pre-populated with the detected failure mode, current severity assessment, and drive geometry data needed by the maintenance technician.
Replace Belt Drives When Condition Dictates — Not When the Calendar Says
iFactory gives maintenance engineers the belt frequency harmonic tracking, tension monitoring, and misalignment classification needed to predict belt drive failures 45 days in advance — eliminating emergency belt replacements and extending belt service life through condition-informed maintenance timing.