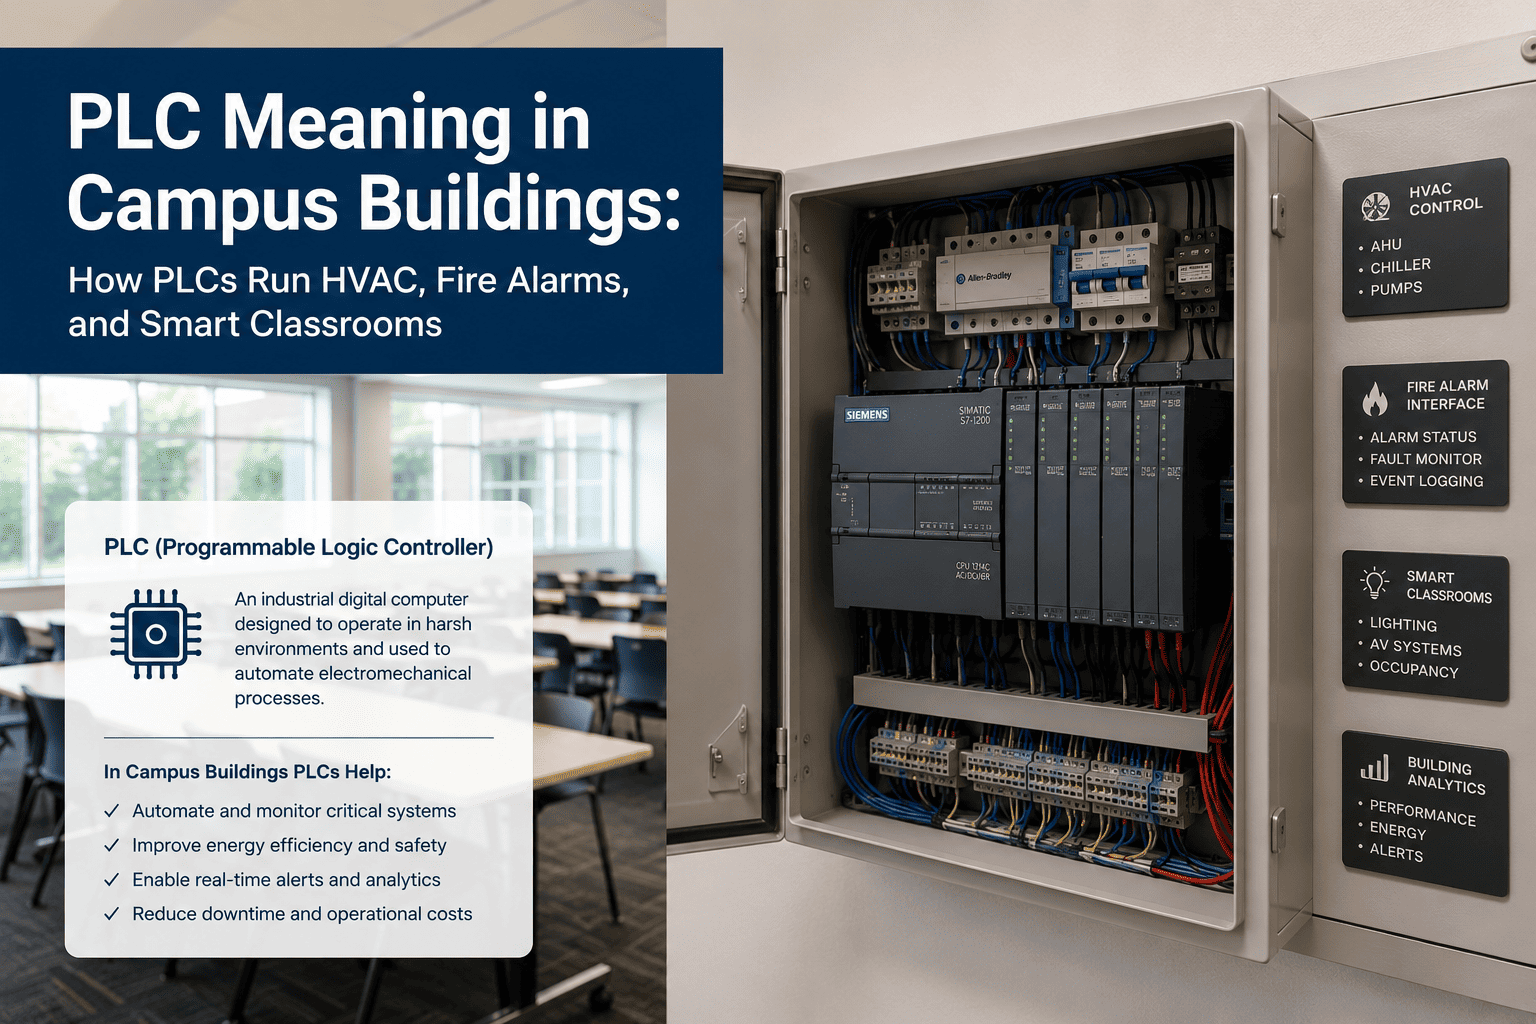
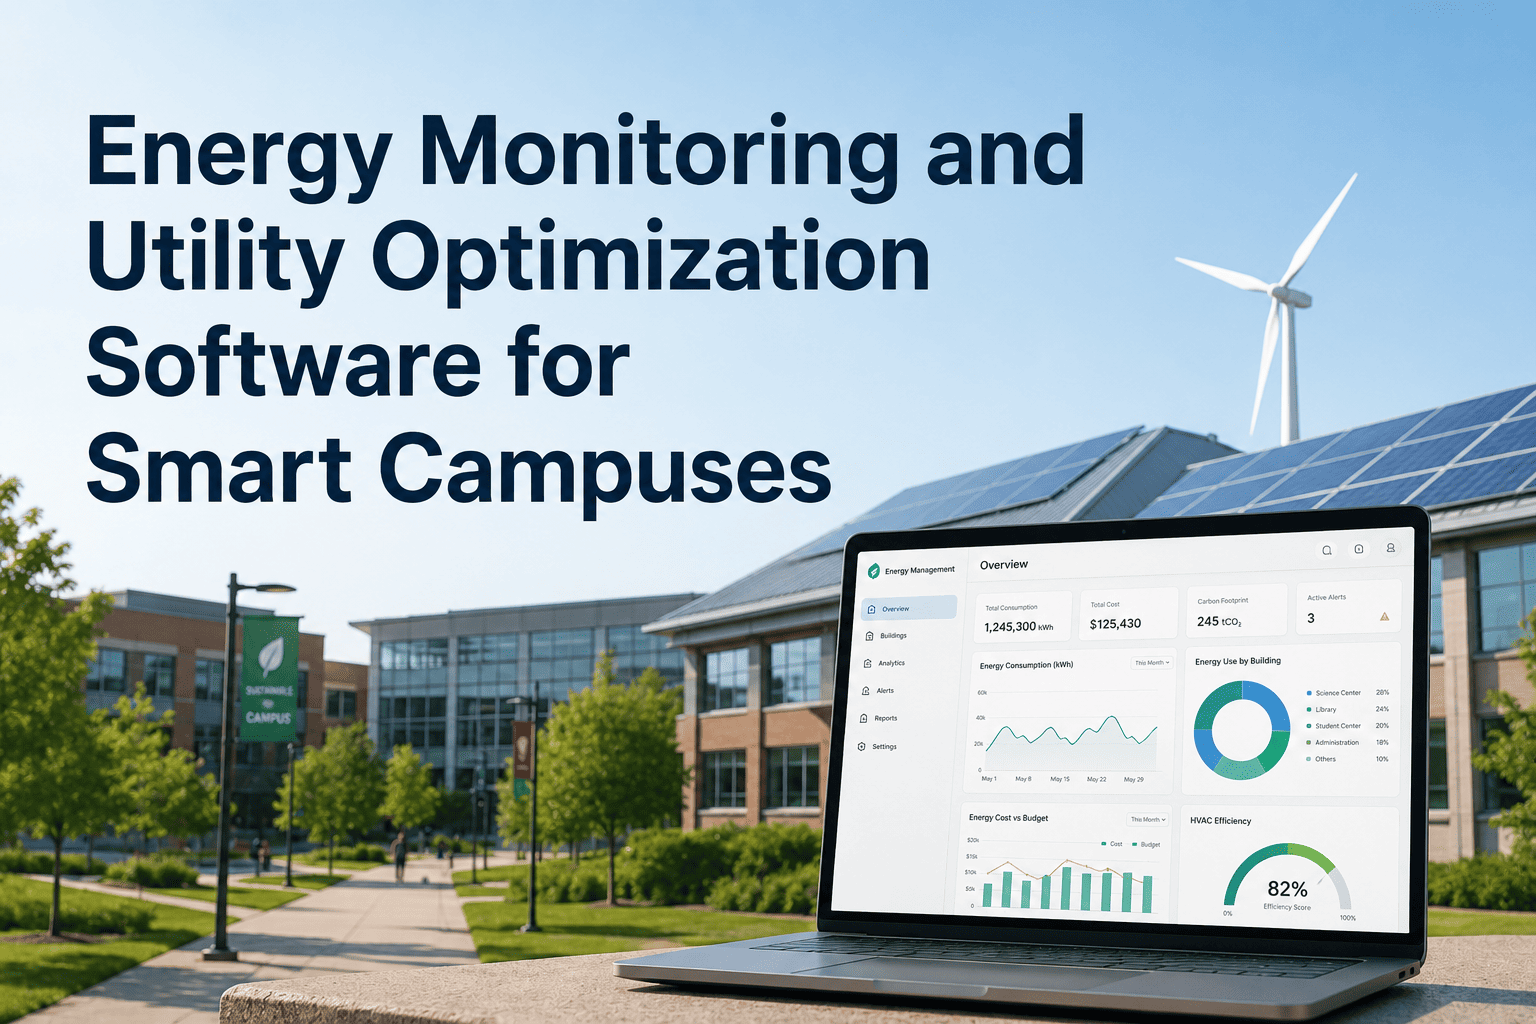
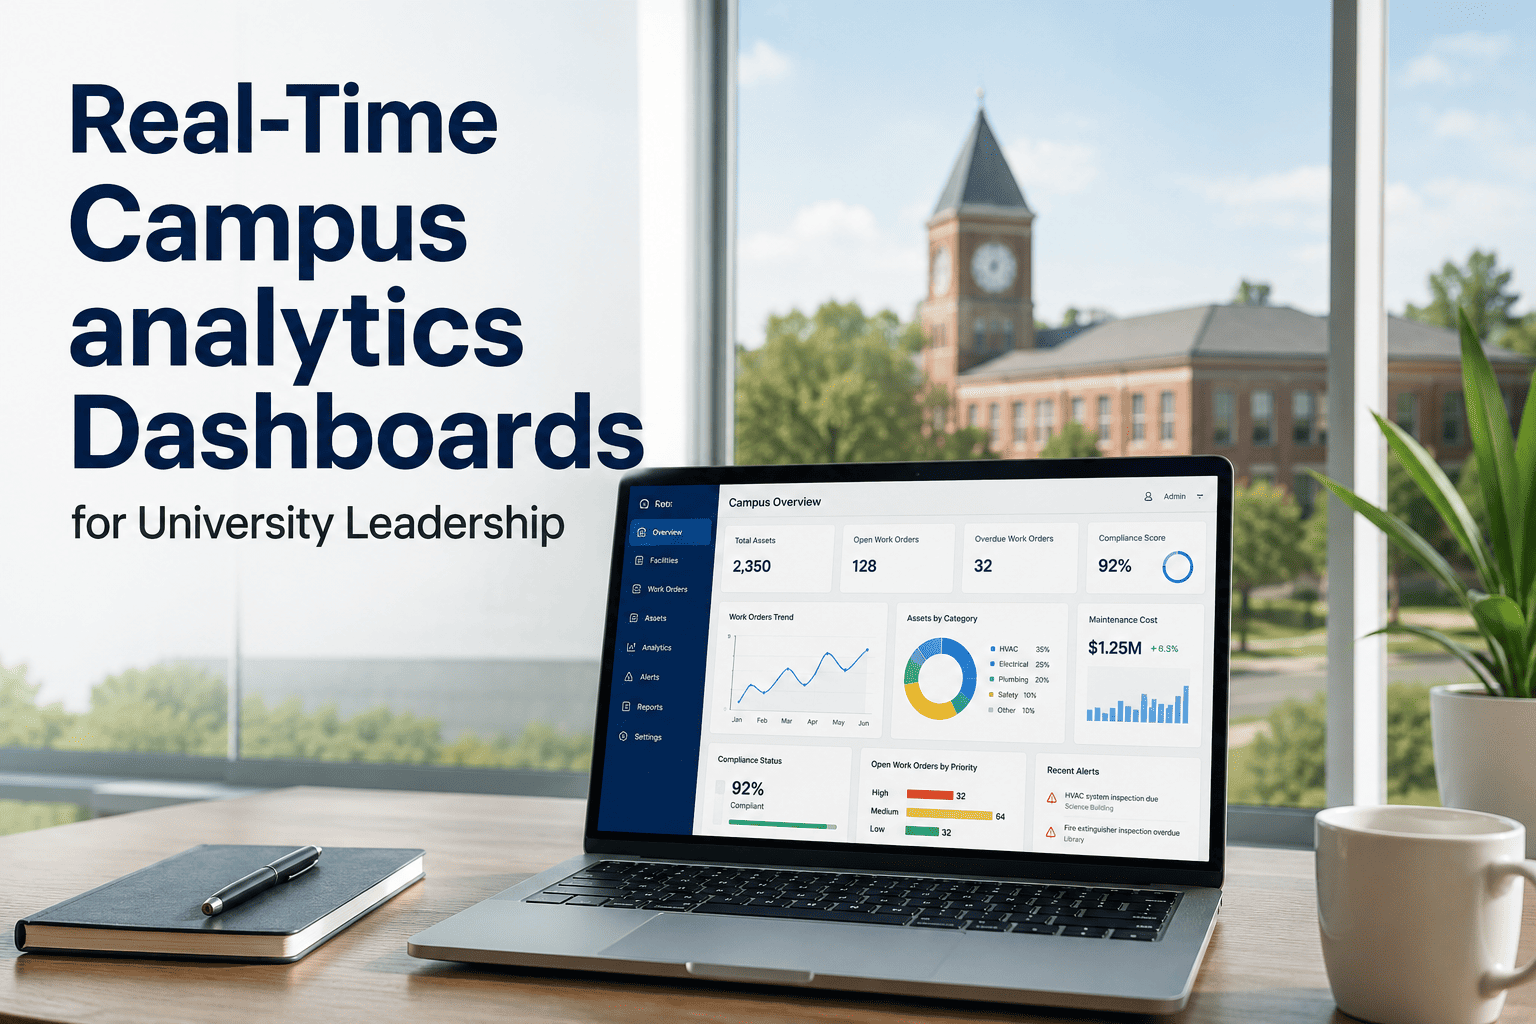
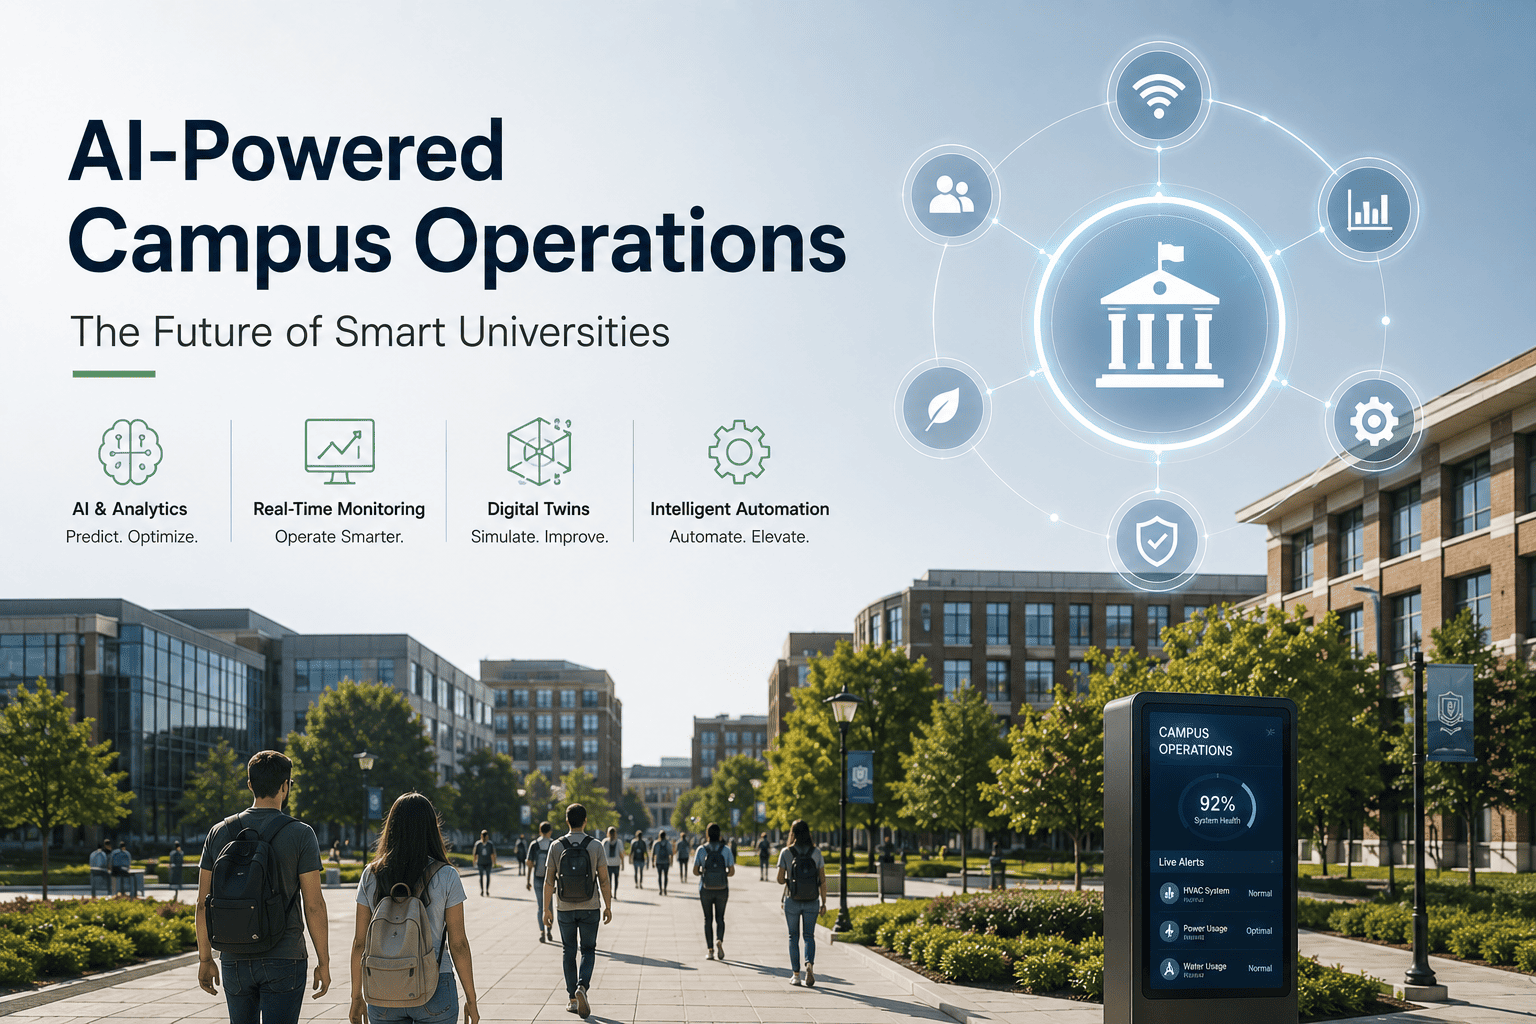
University facility teams manage millions of square feet across dozens of buildings — lecture halls, research labs, dormitories, libraries, and athletic facilities. Without real-time visibility, they rely on manual rounds, reactive work orders, and fragmented building automation systems. IoT sensors change that: occupancy detection, energy metering, HVAC performance tracking, water leak sensors, and security system integration — all feeding into a unified AI-driven platform that automates alerts, triggers work orders, and optimises campus operations. This guide covers how leading universities deploy IoT for real-time facility monitoring, what sensors to deploy where, and how to integrate sensor data with existing systems. Book a smart campus consultation to see a live IoT dashboard.
IoT Sensors · Smart Campus · Real-Time Monitoring
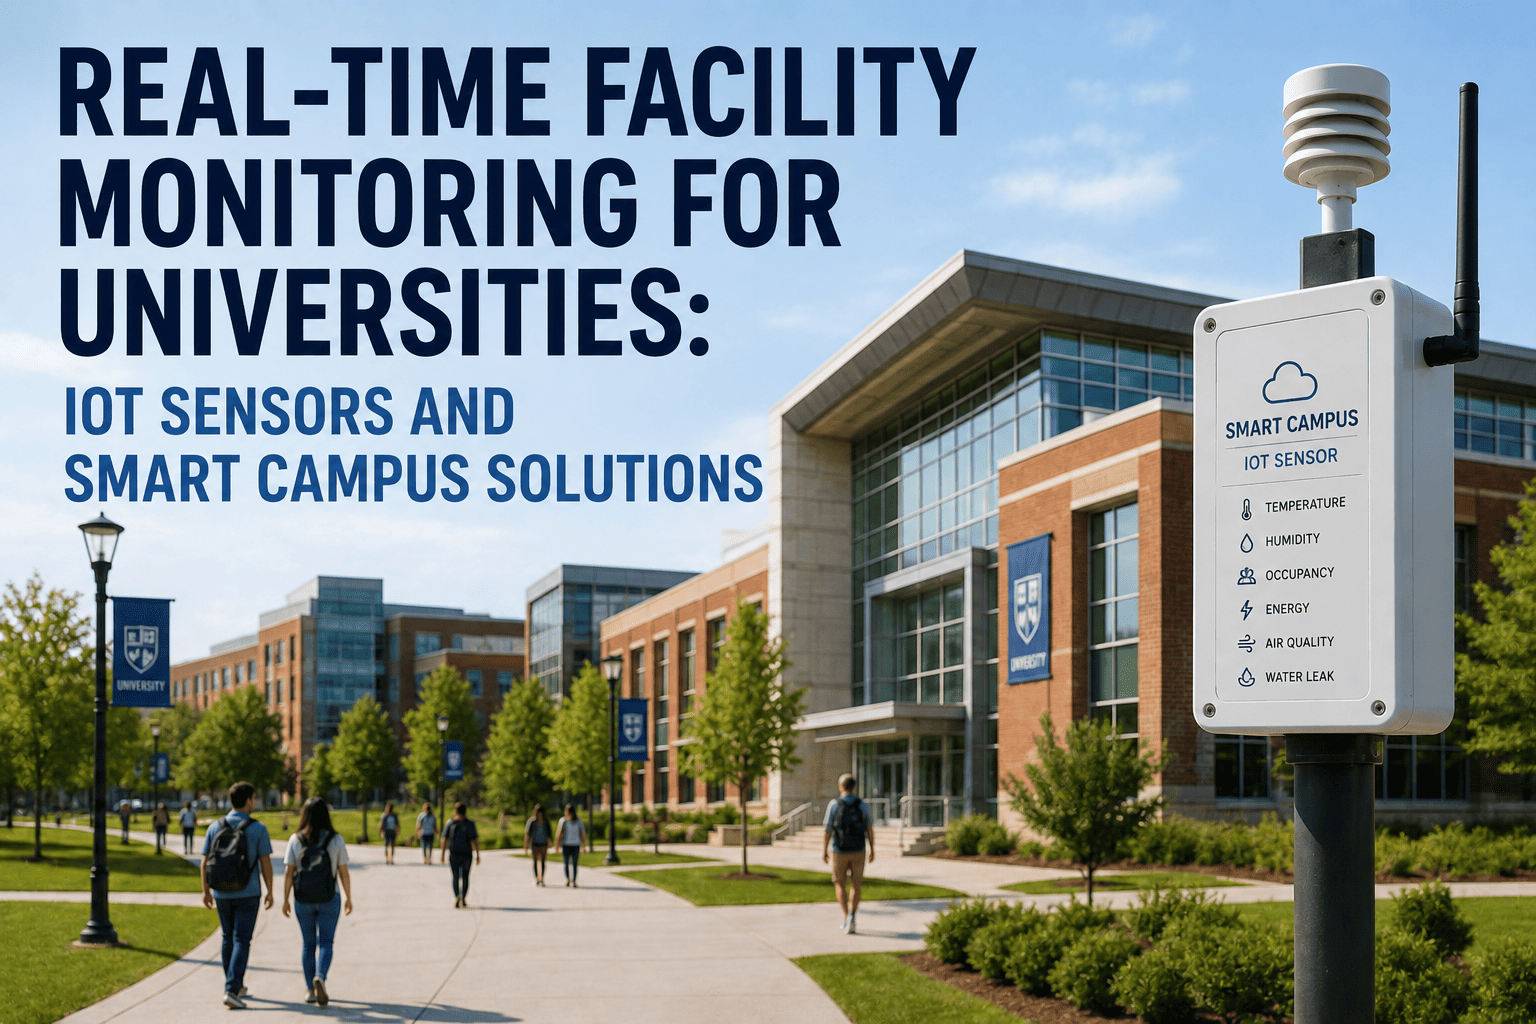
Real-Time Facility Monitoring for Universities: IoT Sensors and Smart Campus Solutions
Building occupancy · Energy consumption · HVAC performance · Water leak detection · Security systems — all integrated with AI-driven automated responses.
30-40%
Energy reduction via IoT + AI
24/7
Real-time leak detection
85%
Faster maintenance response
$2.5M
Avg annual savings (large campus)
Why Universities Are Moving to IoT‑Driven Facility Monitoring
University facility teams face unique challenges: aging infrastructure, 24/7 building usage, diverse occupancy patterns, and pressure to reduce energy costs while improving student comfort. Traditional BAS (Building Automation Systems) provide siloed data — but without AI integration, they don't predict failures or automate responses. IoT sensors bridge this gap. When a lecture hall has low CO2 but high humidity, or a library water flow spikes at 2 AM, AI-powered platforms detect anomalies and trigger work orders before problems escalate. This guide documents the sensor types, deployment strategies, and integration architecture used by top universities to create truly smart campuses.
01
Sensor Selection
4 weeks
Identify critical assets: HVAC, lighting, water, security, occupancy. Choose LoRaWAN, Zigbee, or hardwired sensors.
02
Deployment
6-8 weeks
Install sensors across pilot buildings. Connect to campus network and AI platform.
03
Integration
4 weeks
Ingest data into AI platform. Set thresholds, alert rules, and automated work order triggers.
04
Optimisation
Ongoing
AI learns normal patterns, reduces false alarms, predicts equipment failures.
05
Scaling
Phased
Expand to all campus buildings. Cross‑building learning for predictive models.
Phase 1: Sensor Selection — What to Monitor and Why
The most successful university IoT deployments start with high‑impact, low‑complexity sensors: energy meters, occupancy sensors, and water leak detectors. A large Midwestern university deployed 1,200 IoT sensors across 8 buildings in 10 weeks, achieving payback in 14 months from energy savings alone. Below is the standard sensor package for a smart campus.
Occupancy / CO2
Energy (sub‑metering)
HVAC (temp, humidity, pressure)
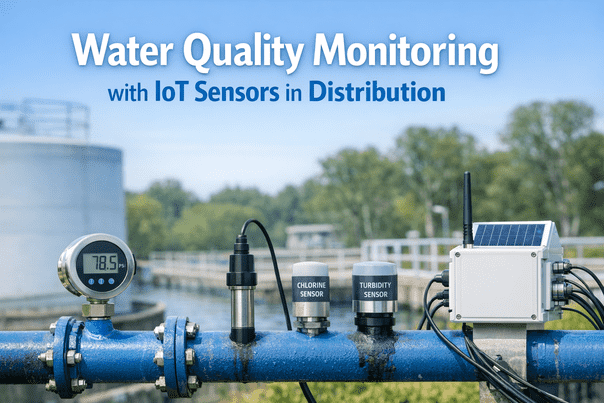
Water flow / leak detection
Vibration (motors, pumps)
Security (door/window, glass break)
Right‑size HVAC & lighting → 30% energy cut
Identify energy waste, benchmark buildings
Predict filter clogs, compressor failures
Prevent $500K+ flood damage per event
Predictive maintenance on pumps, AHUs
Automated security alerts, faster police response
Key Lesson from Early Adopters: Start with energy and water sensors. They deliver the fastest ROI (12‑18 months) and build stakeholder confidence. Occupancy sensors for HVAC scheduling typically save $2‑4 per square foot annually.
Phase 2: Deployment — Low‑Cost Wireless vs. Hardwired
Most universities choose a hybrid approach: LoRaWAN or Zigbee wireless sensors for retrofits (no new wiring), plus hardwired meters for high‑accuracy energy sub‑metering. A typical 10‑building deployment takes 6‑8 weeks with two full‑time technicians.
Weeks 1-2
Site Survey & Network Planning
Map building layouts, identify LoRaWAN gateway locations, confirm Wi‑Fi coverage for IP sensors.
Weeks 3-5
Sensor Installation
Mount occupancy sensors, energy meters, water leak detectors, vibration sensors. Pair to gateways.
Weeks 6-8
Commissioning & Dashboarding
Verify data flow to AI platform. Set baselines, alert thresholds, and automated work order rules.
Deployment Outcome: A 15‑building deployment at a public university achieved 99.7% sensor uptime after 3 months. False alarms dropped from 12 per week to 2 after AI learned normal patterns.
Phase 3: Integration — From Raw Sensor Data to Automated Actions
The real value comes from integrating IoT data with an AI‑driven facility management platform. Raw sensor streams — temperature, occupancy, energy, vibration — become actionable insights: "AHU‑7 filter pressure is 85% clogged, schedule replacement this week," or "Water flow in science building basement detected at 2 AM — possible pipe burst, dispatch security."
Energy Optimisation
AI correlates occupancy sensors with HVAC schedules — automatically setting back temperatures in empty lecture halls, saving 30‑40% on heating/cooling.
Predictive Maintenance
Vibration and temperature sensors on pumps, fans, and compressors. AI detects anomalies 2‑4 weeks before failure — no more unexpected downtime.
Leak & Flood Prevention
Water flow sensors and humidity detectors in mechanical rooms, restrooms, and labs. AI triggers immediate shutdown and work order — preventing $500K+ in damage.
Phase 4: Scaling — From Pilot to Entire Campus
After a successful pilot (3‑5 buildings), universities scale sensor deployment across 50+ buildings. The key is standardised sensor types, centralised gateway infrastructure, and AI models that learn from all buildings simultaneously.
Year 1
Pilot Buildings (5‑10)
Deploy sensors, integrate with AI, prove ROI. Identify high‑value sensors and placement strategies.
Year 2
High‑Priority Buildings (15‑25)
Energy‑intensive labs, older dorms, buildings with past leaks.
Year 3
Campus‑Wide (50+ buildings)
All academic, residential, and administrative buildings. Cross‑building AI models.
Ongoing
Continuous Optimisation
AI adds new sensor types (air quality, EV charger load, etc.) as needs evolve.
Phase 5: Optimisation — AI‑Driven Outcomes After Year 1
Once sensors are deployed and AI models are trained, universities unlock capabilities far beyond simple dashboards: predictive failure alerts, autonomous HVAC scheduling, and real‑time space utilisation tracking.
Autonomous HVAC Scheduling
92% occupancy accuracy
AI predicts room occupancy 2 hours in advance using historical patterns and real‑time sensors. Adjusts heating/cooling automatically — no manual overrides.
Predictive Equipment Alerts
3‑week average lead time
Vibration and thermal sensors on 200+ AHUs, pumps, chillers. AI flags degradation 2‑4 weeks before failure — maintenance scheduled during low‑impact windows.
Real‑Time Space Utilisation
Live occupancy dashboards
Students and faculty see live lecture hall occupancy via mobile app — reducing overcrowding and improving safety during peak times.
Cross‑Building Learning
All buildings share models
When one building's AI learns a new failure pattern (e.g., chilled water valve drift), all 50+ buildings update within 24 hours.
IoT Monitoring Results: Before vs After
Energy consumption (kWh/ft²)
Baseline
-30‑40%
$0.85‑1.20/sq ft savings
Water leak events
6‑8 per year (major)
1‑2 per year
-75%
HVAC emergency calls
45 per year
12 per year
-73%
Maintenance response time
8 hours (on‑call)
1.5 hours (automated)
-81%
Annual utility cost (1M sq ft)
$2.8M
$1.9M
-$900k
Facility staff hours (monitoring)
35 hrs/week (manual rounds)
4 hrs/week (exception‑only)
-89%
The 8 Smart Campus IoT Lessons From Leading Universities
01
Start With a Pilot, Not a Campus‑Wide Rollout
The most successful smart campus programmes start with 3‑5 buildings, prove ROI in 12 months, then scale. A large public university deployed 1,200 sensors across 8 buildings first, achieved $400k annual savings, then expanded to 50+ buildings. Lesson: pilot, validate, then scale.
Book a smart campus pilot consultation.
02
LoRaWAN Beats Wi‑Fi for Most Environmental Sensors
Wi‑Fi sensors consume too much power and struggle in basements or mechanical rooms. LoRaWAN offers 2‑5 year battery life and penetrates concrete walls. The pilot university used LoRaWAN for 80% of sensors, saving $200k in wiring costs.
Contact iFactory for a sensor technology assessment.
03
Don't Over‑Alert — Use AI to Filter False Positives
Raw IoT data triggers 50‑100 alerts per day — most false. AI learns normal patterns (e.g., temperature swings during class changes) and reduces alerts to 5‑10 actionable notifications daily. Lesson: budget 4 weeks of AI training to eliminate alert fatigue.
04
Integrate With Existing BAS Instead of Replacing It
Most universities already have Siemens, Johnson Controls, or Honeywell BAS. AI platforms should read BAS data via API, not replace controllers. The pilot university integrated with 3 different BAS systems in 6 weeks using standard IoT gateways.
05
Occupancy Sensors Deliver Fastest Payback (12 Months)
Adjusting HVAC based on real‑time occupancy saved 32% on heating/cooling in a 200,000 sq ft science building — $86k annually. Sensor cost: $15k. Payback: 2 months (including installation). Lesson: start with occupancy and energy.
Schedule a demo of occupancy‑based HVAC control.
06
Water Leak Sensors Are Insurance Policies — Deploy Early
One major water leak in a library or lab can cost $500k‑$2M in damages, plus weeks of closure. A single avoided leak pays for the entire sensor deployment. The pilot university detected three small leaks in year one, preventing $1.2M in estimated damage.
07
Involve Facilities Staff in Sensor Placement
Facilities technicians know exactly where problems occur — mechanical room sump pumps, roof drains, aging AHUs. Their input on sensor placement doubled the utility of the data. Lesson: co‑design sensor deployment with the team who will maintain them.
08
Share Dashboards With Students and Faculty
When students see live energy use and occupancy dashboards, they become partners in conservation. One university displayed “current building energy intensity” on hall monitors — student awareness campaigns reduced plug loads by 18%. Lesson: transparency drives behaviour change.
The iFactory Smart Campus Solution: IoT + AI for Universities
iFactory provides an end‑to‑end smart campus platform: pre‑integrated IoT sensors (LoRaWAN, Zigbee, or hardwired), edge gateways, AI analytics, and automated work order generation. Deploy on‑premise (for data sovereignty) or cloud (for cross‑campus learning).
On‑Premise Edge Deployment
For Real‑Time Campus Monitoring
iFactory edge nodes process all IoT sensor data locally — sub‑100ms alert latency, full data sovereignty, operates during network outages. Ideal for universities with strict data privacy requirements or limited WAN bandwidth.
Sub‑100ms anomaly detection
Full data sovereignty — no cloud required
Operates during internet outages
Tamper‑evident audit trails
Native BAS and sensor integration
Get Edge Deployment Quote
Cloud Analytics
For Cross‑Campus Benchmarking & Central Learning
iFactory's cloud platform aggregates IoT data across all your buildings — cross‑building energy benchmarking, centralised AI model training, system‑wide dashboards, and student/faculty portals. For campuses with 10+ buildings, the cloud layer drives fleet‑wide improvement.
Building‑by‑building energy scorecards
Centralised AI model training and distribution
Student and faculty dashboards
Automated sustainability reporting
Fleet‑wide optimisation
Talk to a Smart Campus Expert
FAQ: IoT Facility Monitoring for Universities
Deploy a Smart Campus: IoT + AI for Real‑Time Facility Monitoring
iFactory delivers the proven smart campus platform used by leading universities — occupancy‑based HVAC, predictive maintenance, leak prevention, and automated sustainability reporting. On‑premise for real‑time control, cloud for cross‑building analytics, or both. Book a complimentary smart campus assessment: we will review your current BAS, identify high‑value sensor deployments, and provide a custom ROI projection.
Occupancy Sensors
Energy Monitoring
Predictive Maintenance
Water Leak Detection
LoRaWAN
BAS Integration
18‑30 Month Payback