Campus energy spend is one of the largest controllable cost lines in a university budget — and in most institutions it is not being controlled, it is being observed. Utility bills arrive monthly. Engineers investigate quarterly. Inefficiencies run continuously. The gap between when a building starts consuming 30 percent above baseline and when anyone notices it is typically weeks or months — during which the excess cost compounds silently. AI-powered energy monitoring software closes that gap by connecting to existing campus meters, sensors, and building systems and surfacing anomalies, inefficiencies, and optimisation opportunities the moment they appear. See what your campus energy data reveals when it is monitored continuously — Book a Demo.
Reduce campus energy waste and control utility expenses with AI-powered monitoring and optimisation tools that connect to existing campus infrastructure — no system replacement required.
Why Campus Energy Management Fails Without Continuous Monitoring
Most university energy programmes operate on monthly billing data and quarterly engineering reviews. This cadence is appropriate for budget reporting but structurally inadequate for operational energy management. A chiller running at degraded efficiency, an AHU conditioning an unoccupied wing, a steam trap leaking continuously, or a lab exhaust fan running at full speed through the weekend — none of these events appear in a monthly utility bill in a form that identifies the building, the system, or the cause.
Continuous monitoring at the meter and sub-meter level, with AI anomaly detection running against dynamic baselines, converts the monthly billing view into a live operational tool. Facilities teams see the building, the system, and the deviation as it develops — with enough lead time to correct it before the month's energy budget is already spent. See how continuous monitoring identifies waste on your specific campus portfolio — Book a Demo.
Six Energy Waste Patterns Continuous Monitoring Finds Automatically
Each pattern below is present on most campuses and invisible without sub-meter and BMS data monitored at short intervals with AI anomaly detection. Each one has a quantifiable cost that compounds daily until it is detected and corrected.
HVAC systems running at occupied setpoints during unoccupied periods — overnight, weekends, and semester breaks — is typically the single largest recoverable energy waste on a campus. Without per-zone occupancy data integrated with the HVAC schedule, systems condition empty lecture halls, labs, and offices continuously. AI monitoring detects the occupancy-to-conditioning mismatch from BMS and access data and generates an alert with the specific air handling unit, the zone, and the estimated daily cost of the mismatch.
Chiller kW per ton increases gradually as condenser tubes foul, refrigerant charge drifts, or compressor wear accumulates. The degradation is invisible on a monthly bill but detectable as a rising energy intensity trend in continuous BMS data. A chiller running 15 percent below rated efficiency in a large campus plant represents tens of thousands of dollars in excess annual energy cost. AI monitoring tracks kW per ton against a dynamic baseline and flags degradation weeks before it becomes significant enough to appear in energy bills.
Laboratory buildings have constant-volume exhaust systems for safety compliance that create large conditioning loads when supply air is not correctly balanced. When exhaust systems run at full design flow without occupancy-based reduction, and when supply air systems over-condition to compensate, the energy cost is disproportionate to actual lab usage. Continuous monitoring of exhaust and supply flow data against occupancy schedules surfaces the imbalance with the specific lab zone, system, and daily energy cost attributed.
Failed steam traps pass live steam continuously and are estimated to waste 15 to 25 percent of total steam generation in unmonitored campus distribution systems. Individual failed traps are undetectable from building-level utility data. Continuous monitoring of building steam consumption against a temperature-corrected baseline identifies the buildings where steam loss is occurring and generates a work order that directs maintenance to the right location — not after an annual steam trap survey, but when the loss starts.
Simultaneous heating and cooling in the same zone — caused by VAV box control loop issues, zone sensor faults, or competing setpoints from occupant overrides — generates large energy waste that appears as unexpectedly high total HVAC consumption without a corresponding increase in comfort complaints. AI monitoring detects the characteristic signature of simultaneous conditioning from BMS valve position and zone temperature data and flags the specific zone and the estimated energy waste being generated.
Lighting circuits running at full output in unoccupied spaces — missed by occupancy sensor faults, override switches left on, or scheduling errors — generate significant waste in large campus buildings where lighting can account for 20 to 30 percent of total electricity consumption. Continuous monitoring of lighting circuit data against occupancy sensor and room booking inputs identifies which circuits are running against occupancy evidence and quantifies the daily cost of each anomaly.
Platform Capabilities: What Energy Monitoring Software Does
iFactory's campus energy monitoring platform provides six integrated capability layers that together close the gap between raw meter and sensor data and the operational decisions that reduce energy spend.
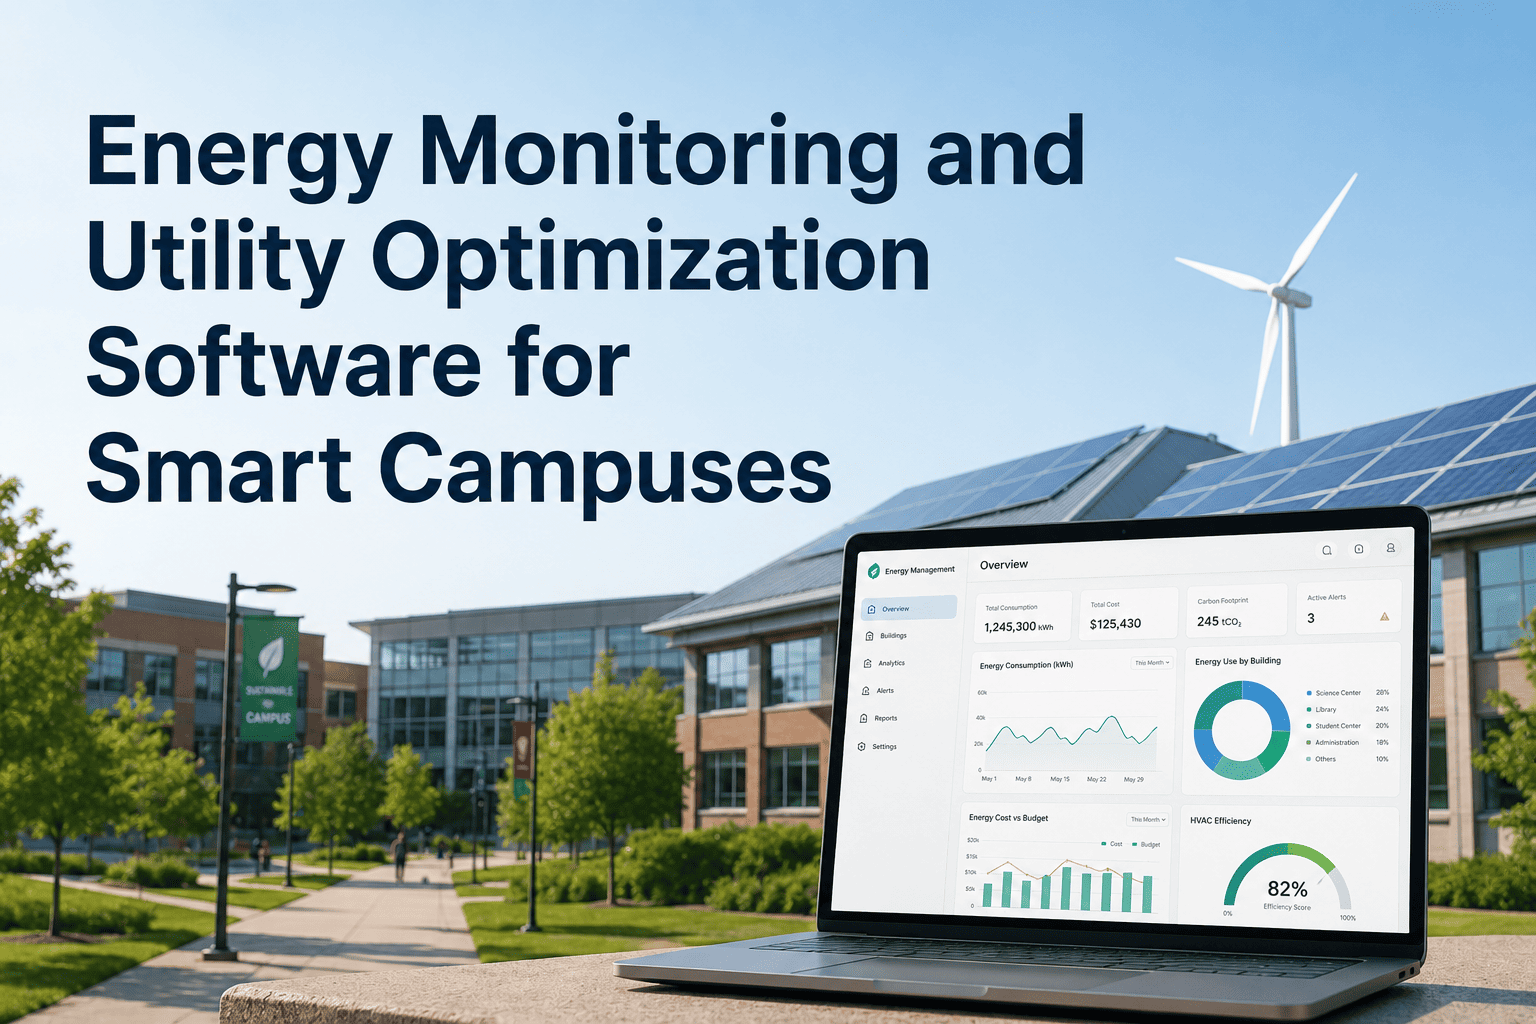
Energy use intensity calculated per building continuously from connected meters and BMS feeds. Dynamic baseline updated with weather and occupancy data so anomalies reflect genuine waste, not seasonal variation. Buildings consuming above baseline flagged automatically with estimated excess cost.
Room booking system integration and occupancy sensor data feed the HVAC scheduling layer to pre-condition spaces before occupancy and return to setback mode after. The largest documented quick win — unoccupied space conditioning — begins reducing costs in the first semester as occupancy-driven scheduling activates.
Scope 1 and Scope 2 carbon calculations derived continuously from live utility data. EPA ENERGY STAR, LEED O+M, STARS, and state carbon reporting generated automatically. Accreditation sustainability sections and board dashboards produced on demand without manual data assembly.
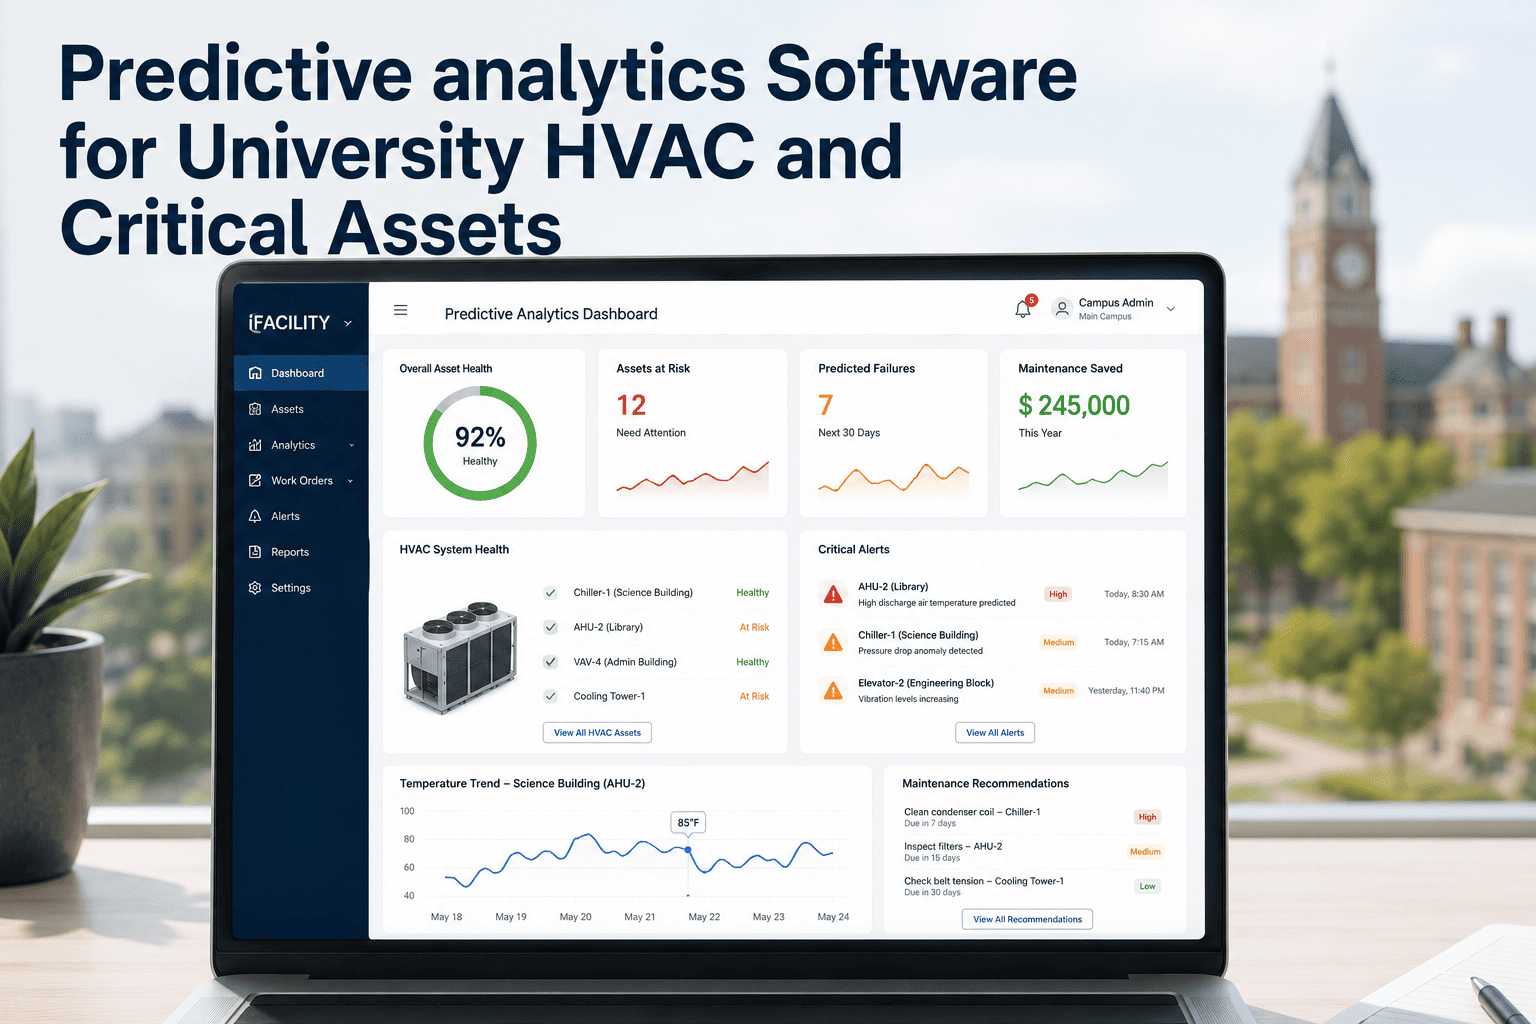
Multivariate fault detection across AHU, chiller, VAV, and pump systems from connected BMS data. Simultaneous heating and cooling, valve hunting, coil fouling, and chiller efficiency degradation all detected from existing sensor data without new instrumentation in most campus buildings.
Retrofit ROI modelling combines energy savings projections with facility condition data to build the financial case for building envelope, mechanical, and lighting investments. Capital requests backed by live performance data achieve higher board approval rates than projects presented on consultant estimates.
Water consumption monitored per building from connected meters with anomaly detection for leaks, irrigation overuse, and cooling tower inefficiency. LEED O+M water use reduction credits require documented baseline and performance period data — continuous monitoring provides both without manual meter read scheduling.
Documented Outcomes at Deployed Campuses
From university deployments on existing operational budgets. No additional sustainability staffing added in any documented case.
Integration: What the Platform Connects To
The platform does not require replacing existing building management systems, meters, or energy infrastructure. A sensor gap assessment in the first two weeks identifies any coverage gaps. Most campuses achieve significant energy intelligence from existing infrastructure alone.
Siemens Desigo, Honeywell EBI, Johnson Controls Metasys, Schneider EcoStruxure, Trane, and Distech connected via BACnet IP, BACnet MSTP, Modbus TCP, and OPC-UA.
Smart meters, interval data feeds, and utility API connections for automatic energy use intensity calculation per building without manual meter read schedules.
Occupancy sensors, CO2 monitors, temperature arrays, and electrical sub-meters connected where installed. Gap assessment identifies additional coverage needs.
EPA Portfolio Manager API sync, STARS data export, and LEED Arc platform integration for direct submission without manual data re-entry into reporting portals.
SAP, Oracle, and Banner integration for per-building utility cost calculations and sustainability capital investment ROI modelling against live performance data.
Core integration live in 60 to 90 days. Initial energy baselines established in first two weeks. No operational disruption during integration phase.
Frequently Asked Questions
Continuous per-building monitoring, AI fault detection, automated sustainability reporting — all from existing campus infrastructure. Core integration live in 60 to 90 days.