Predictive analytics Software for University HVAC and Critical Assets
By james Hart on May 30, 2026
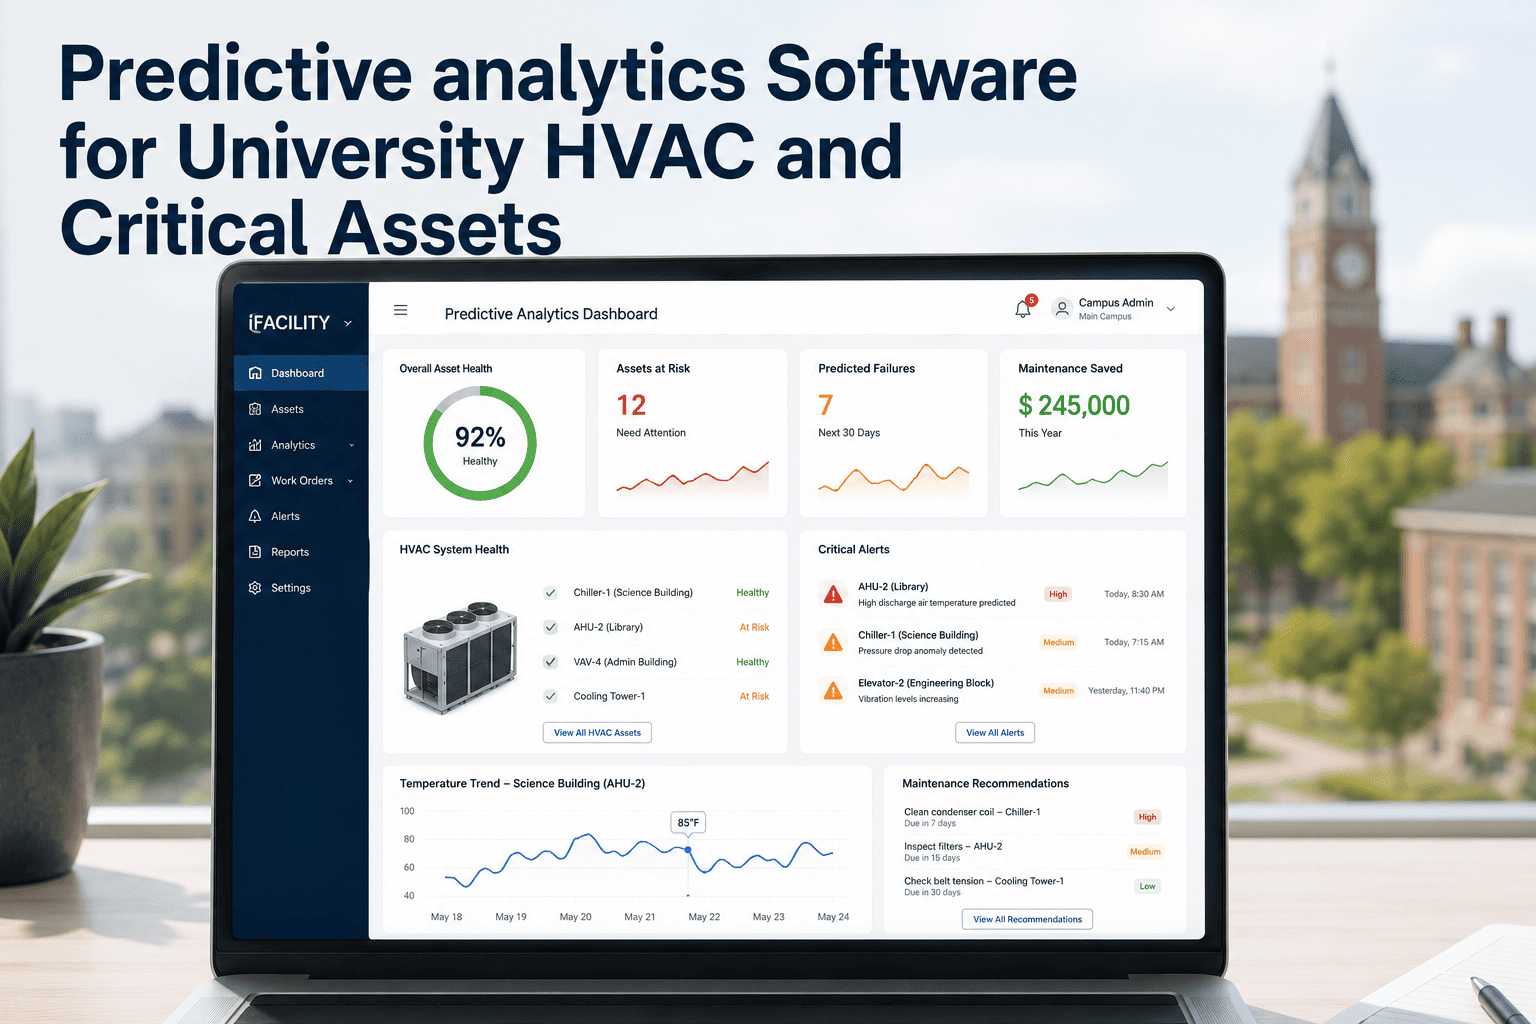
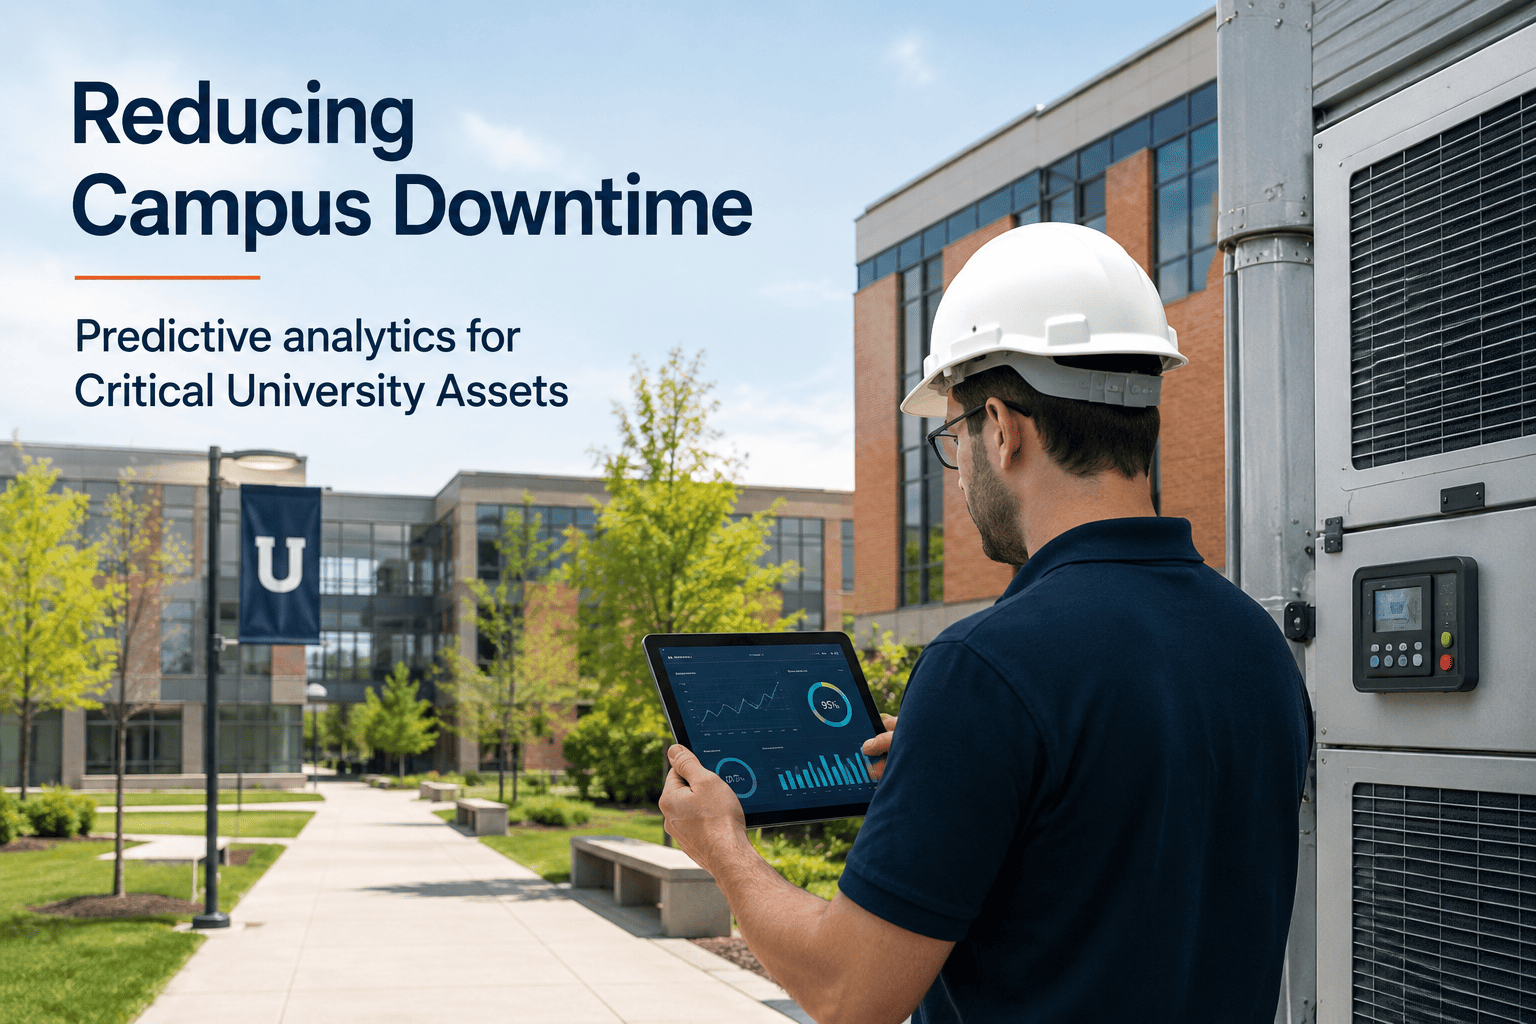
A research university spends $8M annually on HVAC, chiller, boiler, and electrical system maintenance. Yet most failures are discovered only when a classroom loses cooling, a lab freezer alarms, or a building goes dark. Traditional maintenance — run-to-failure or time‑based — misses the early warning signs that equipment generates days or weeks before breakdown. Predictive analytics changes this by continuously monitoring asset data — vibration, temperature, pressure, amperage, run hours — and applying AI models to forecast failures before they disrupt campus operations. For university facility directors and finance leaders, this means fewer emergency repairs, longer equipment life, and budgets that don't get blown by unexpected chiller replacements. See how predictive analytics protects your campus critical assets — Book a Demo.
AI PREDICTIVE ANALYTICS · CAMPUS CRITICAL ASSETS
Predictive Analytics for University HVAC and Critical Assets
Forecast chiller, boiler, AHU, elevator, and electrical failures before they disrupt your campus. Reduce emergency repairs by up to 45% and extend asset life by 30%.
How it works·Critical assets·KPI scorecard·ROI comparison·Implementation·FAQ
What is Predictive Analytics for University Assets?
Predictive analytics uses machine learning models trained on historical asset data — sensor readings, work orders, run hours, failure logs — to forecast when equipment is likely to fail. Unlike calendar‑based maintenance (change filter every 3 months) or reactive maintenance (fix when broken), predictive maintenance tells you exactly which asset will likely fail, when, and why. For a university campus, this means knowing that chiller CH‑4 has a 78% probability of compressor failure within 18 days — enough time to schedule repair during low occupancy and avoid a $200K emergency replacement.
Continuous condition monitoring
24/7 ingestion of IoT sensor and BMS data — vibration, temperature, pressure, amperage, run hours, start/stop cycles.
AI failure forecasting
Machine learning models trained on your campus data predict failure probability, remaining useful life, and recommended action windows.
Automated alert & work order
When a failure is predicted, the system generates an alert and creates a work order in your CMMS automatically.
Battery health, fuel quality, load bank test performance
Laboratory exhaust fans
Vibration, motor current, belt wear, airflow degradation
Pumps & circulators
Seal leakage, bearing temperature, cavitation detection
Predictive Analytics KPI Scorecard
Asset Type
Failure Mode
Typical Warning Window
Accuracy Rate
Cost Savings Estimate
Centrifugal chiller
Compressor failure
10‑21 days
92%
$40‑80K per event
Boiler (steam)
Tube leak
7‑14 days
88%
$25‑50K per event
AHU supply fan
Bearing failure
5‑12 days
85%
$8‑15K per event
Elevator motor
Brake wear
10‑18 days
89%
$12‑25K per event
Generator (emergency)
Battery failure
14‑28 days
94%
$15‑30K per event
*Accuracy rates after 6‑12 months of model training on university data
Traditional Maintenance vs. Predictive Analytics: A Side‑by‑Side Comparison
Aspect
Reactive / Time‑Based
Predictive Analytics (iFactory)
Failure detection
After breakdown occurs
5‑21 days before failure
Repair cost
Emergency rates + overtime + expedited parts
Planned, competitive quotes, off‑peak schedule
Downtime impact
Unexpected disruption to classes/research
Scheduled during low occupancy (nights, weekends, breaks)
Asset life
Shortened by 20‑35%
Extended by 25‑35%
Staff productivity
Chasing emergencies, 50% reactive
Planned work, 80%+ proactive
Don't wait for another emergency chiller replacement. iFactory predictive analytics gives you 5‑21 day advance warning on 85‑92% of critical asset failures.
ROI: What Universities Save with Predictive Analytics
$1.2M
Average annual savings for a 5‑million sq ft research university (avoided emergency repairs + energy efficiency + extended life)
9‑14 mo
Typical payback period for predictive analytics investment
30‑45%
Reduction in emergency service calls after first year of deployment
8‑12%
Energy savings from optimised equipment operation (clean coils, proper refrigerant, efficient fans)
Implementation: From Data to Prediction in 60‑90 Days
1
Connect data sources
Integrate with BMS (BACnet, Modbus, OPC‑UA), CMMS, IoT sensors, and utility meters.
2
Train AI models
Machine learning models learn failure patterns from your historical data (6‑12 months recommended).
3
Set alert thresholds
Define escalation rules — probability % triggers, lead time windows, notification groups.
4
Go live & monitor
Dashboard shows real‑time predictions. Automated work orders flow to technicians.
Real University Results
67%
reduction in unplanned chiller outages at a Big Ten university after 18 months
$780K
first‑year savings from avoided generator failures and chiller efficiency gains
14
critical failures predicted and proactively repaired before disruption
Frequently Asked Questions
How much historical data is needed to start?
6‑12 months of BMS data and work order history is ideal, but we can start with as little as 3 months and improve accuracy over time. Book a demo to see a data readiness assessment.
Does predictive analytics work for older equipment with no sensors?
Yes. We install wireless IoT sensors (vibration, temperature, current) on legacy assets. Payback on sensor installation is typically under 6 months. Contact support for a sensor retrofit proposal.
What happens when the system predicts a failure?
An alert is sent to facility managers and a work order is automatically created in your CMMS with recommended actions. Book a demo to see the alert-to-work order workflow.
Can it integrate with our existing BMS (Siemens, Honeywell, JCI)?
Yes. iFactory connects to all major BMS platforms via native BACnet, Modbus, or OPC‑UA. Most integrations take 2‑4 weeks. Contact support to confirm compatibility with your specific BMS version.
How accurate are the predictions?
After 6‑12 months of training on your data, accuracy for major component failures ranges from 85‑92% within a 5‑21 day window. Book a demo to see live prediction accuracy dashboards.
What is the typical implementation timeline?
60‑90 days from kickoff to live predictions, including BMS integration, sensor installation (if needed), and model training. Contact support for a detailed project timeline based on your campus size and existing systems.
Start Predicting, Stop Reacting
Join top research universities using iFactory to predict HVAC, elevator, and electrical failures before they disrupt campus operations. Get 5‑21 day early warnings on 85‑92% of critical asset failures.