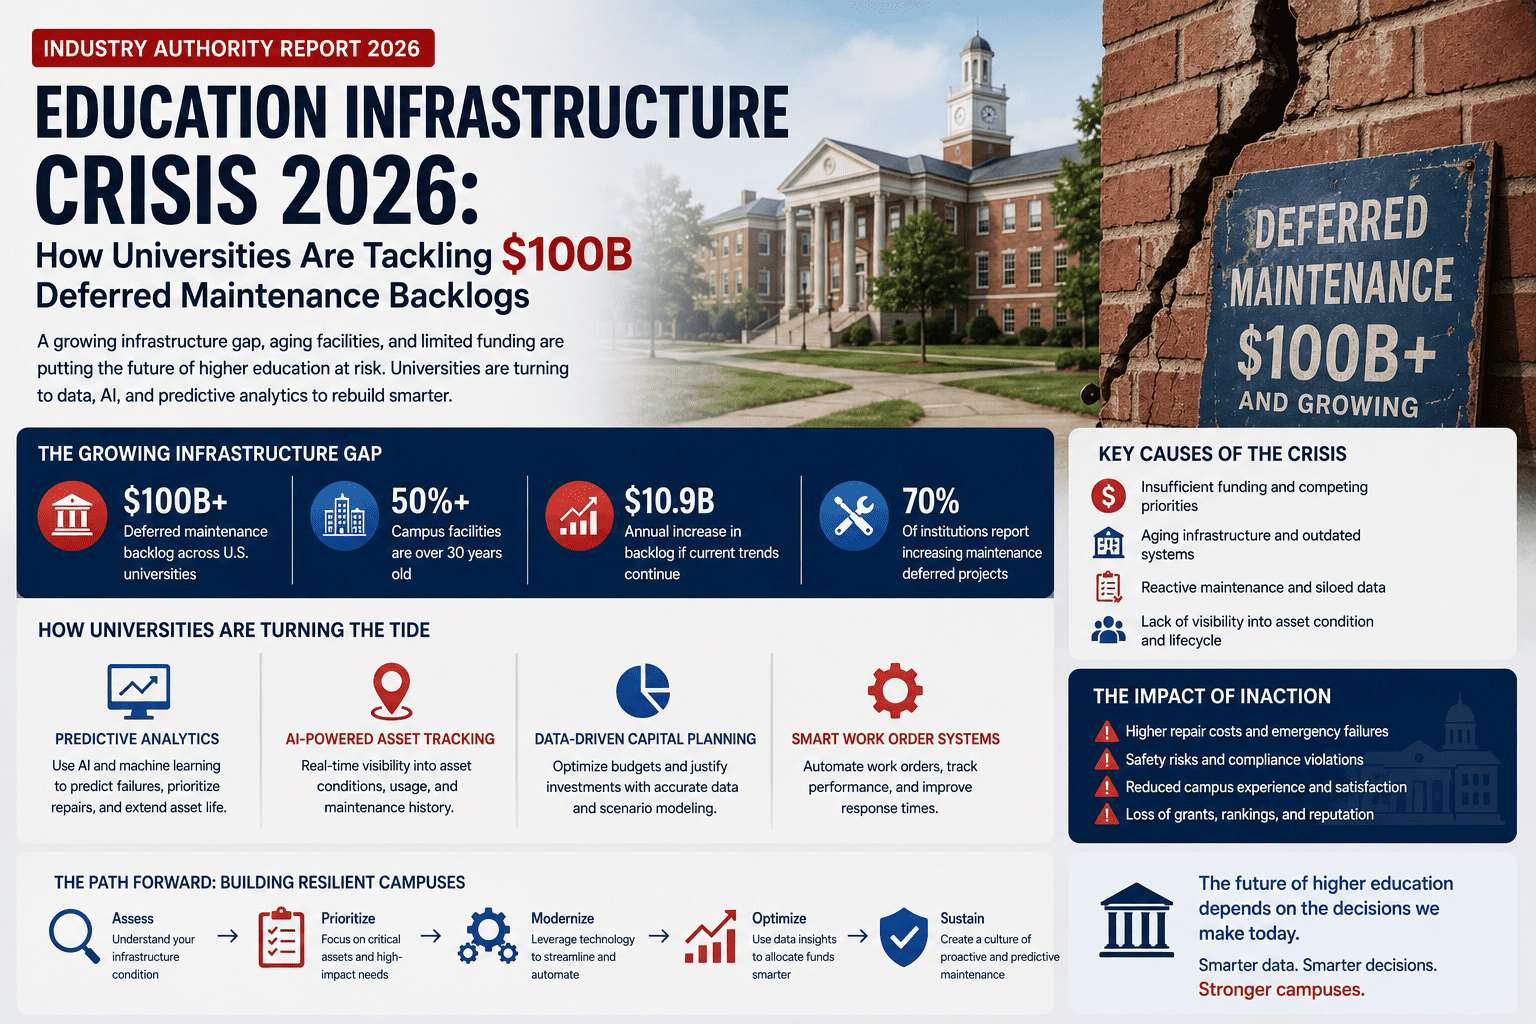
The modern university campus is no longer a collection of buildings managed through periodic inspections and reactive work orders. It is a data-generating infrastructure network producing thousands of real-time signals every minute from HVAC sensors, electrical meters, occupancy systems, access controls, and utility monitors. The institutions that have learned to read this data through AI and IoT integration are operating fundamentally different campuses than those still relying on scheduled rounds and complaint-driven dispatch. Smart campus transformation is not a future technology initiative. It is an operational decision with documented financial outcomes available today. Campuses that have deployed integrated AI and IoT platforms report 18-30% reductions in maintenance costs, 60-75% fewer emergency work orders, 15-19% energy cost reductions, and zero audit deficiencies across all compliance categories simultaneously. Book a Demo to see how AI and IoT integration transforms facility management at your institution.
What Smart Campus Transformation Actually Means in 2026
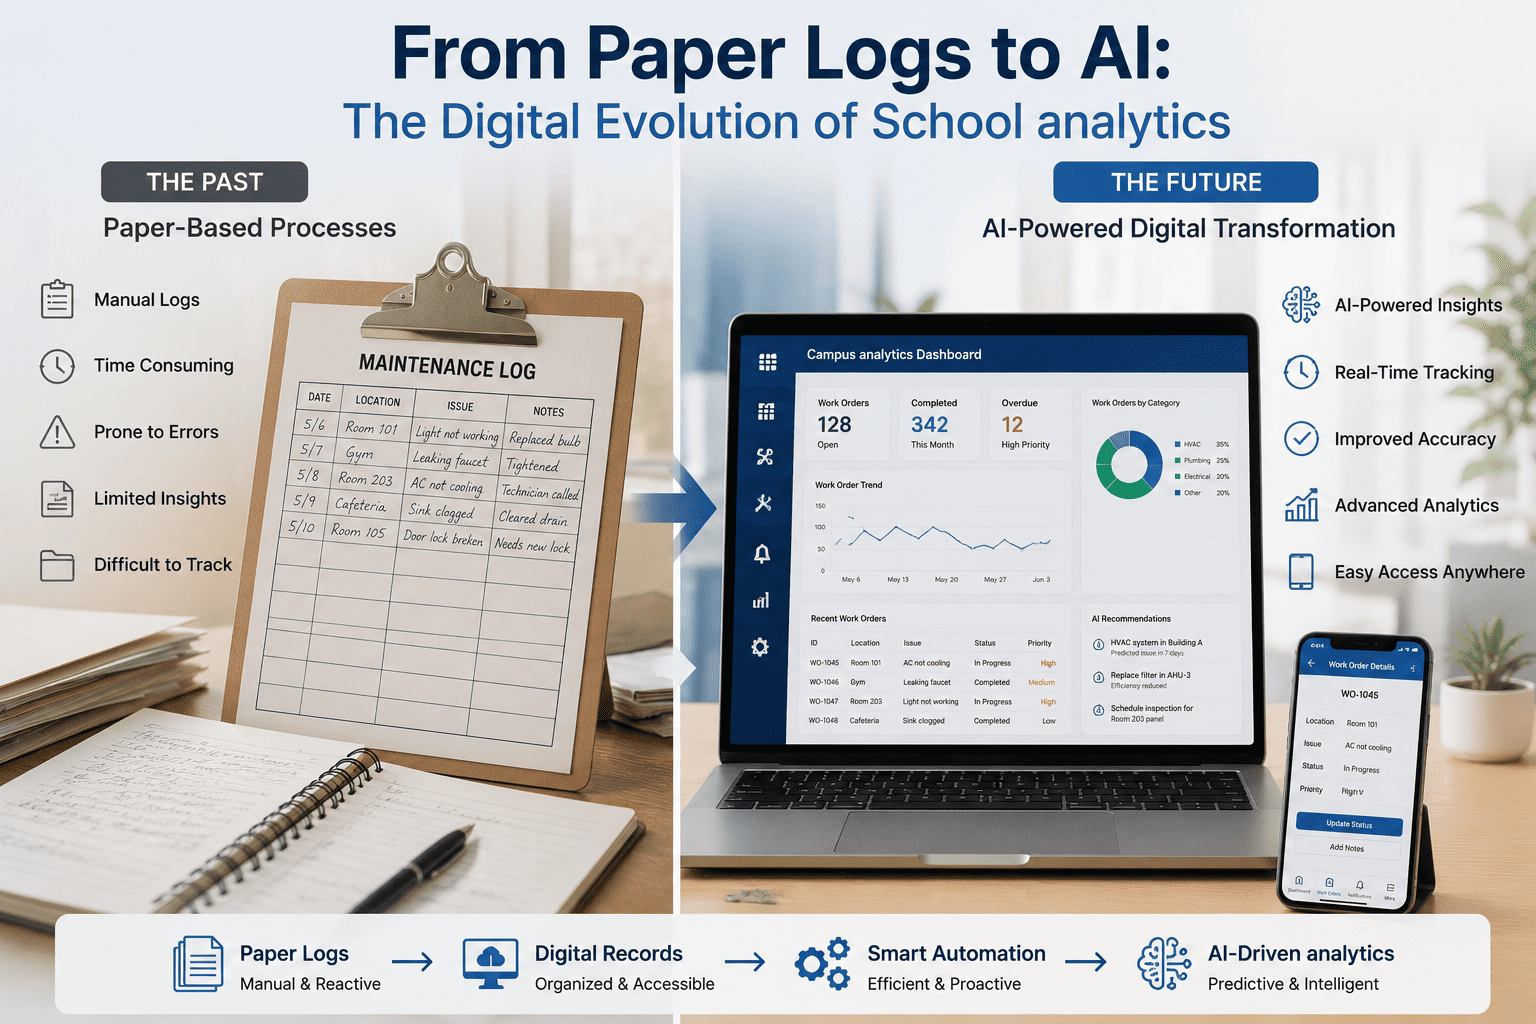
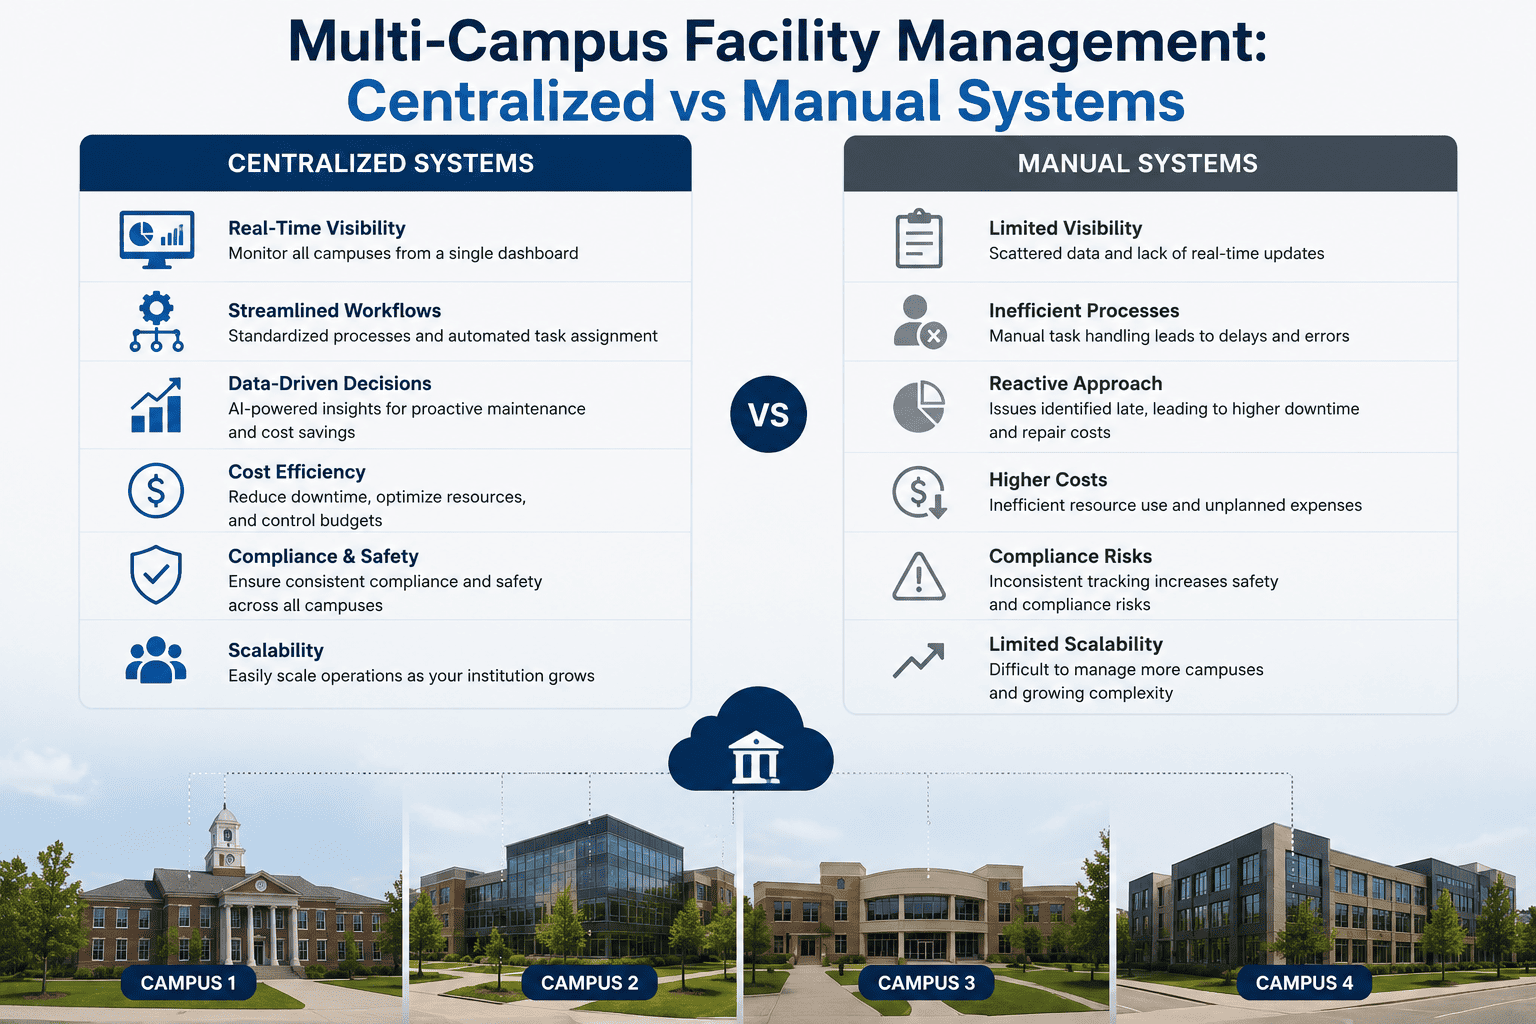
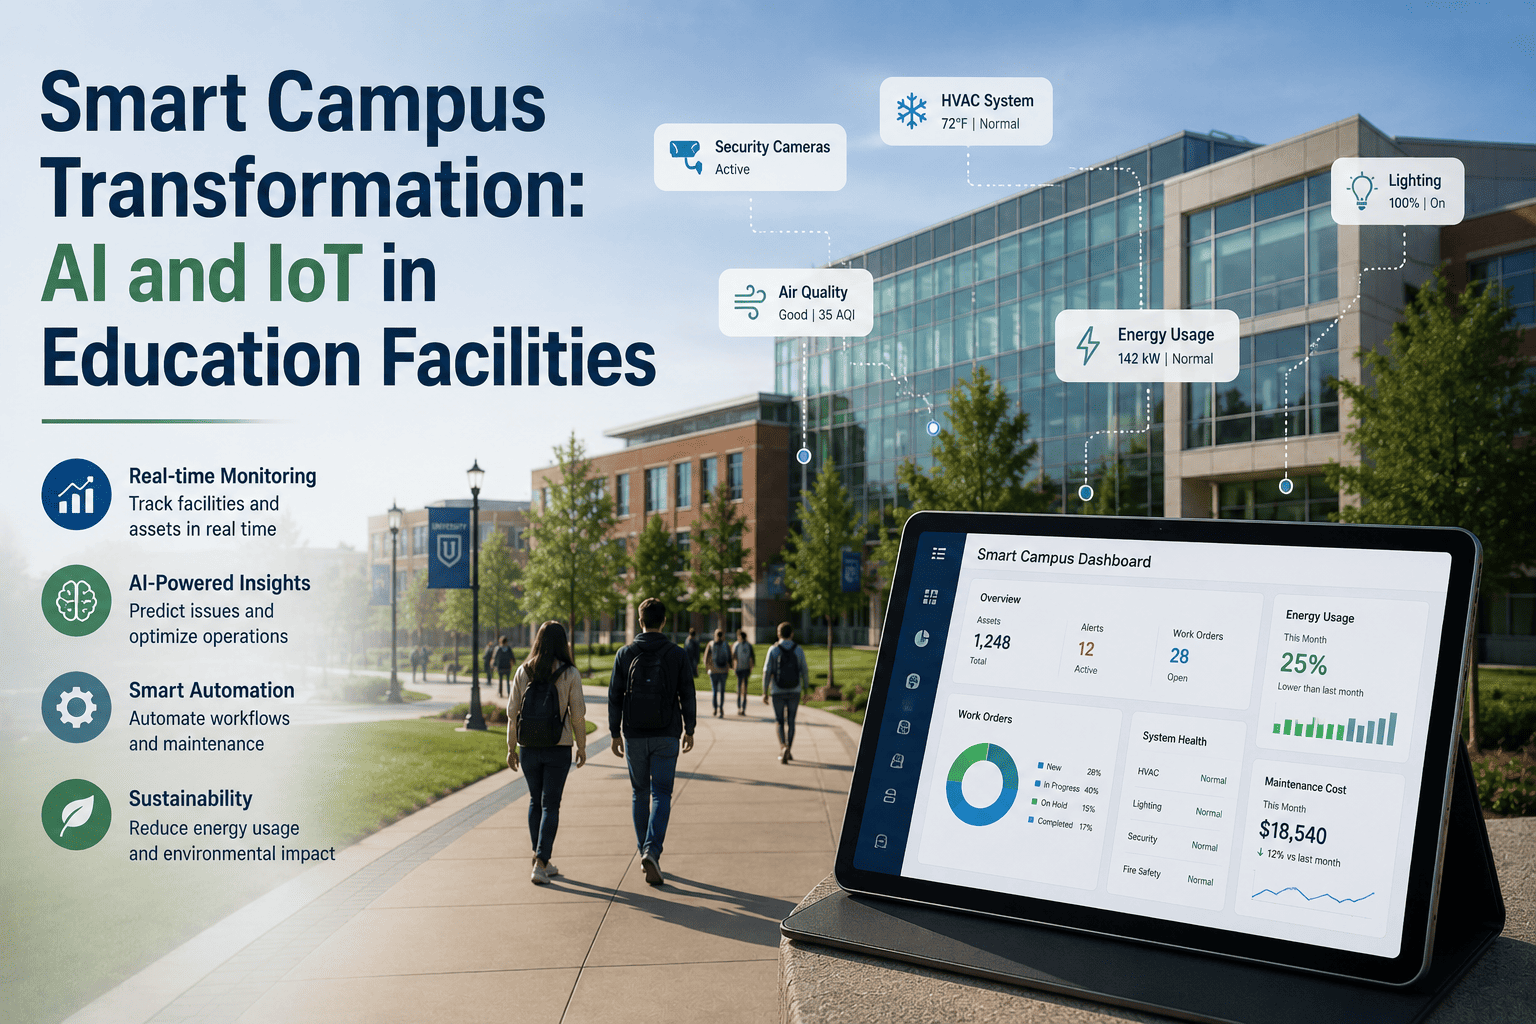
Smart campus transformation is the integration of IoT sensor networks, AI-driven analytics, and automated workflow systems into a unified facility management platform that replaces manual inspection cycles, reactive maintenance dispatch, and disconnected department data systems. The term is used broadly, but the operational reality is specific: a smart campus produces continuous condition data from every monitored asset, feeds that data into an AI model that predicts deterioration and schedules interventions, and routes the resulting work orders to the right team automatically without human scheduling or dispatch.
In 2026 the business case for smart campus investment has become structurally compelling for three reasons that did not exist simultaneously five years ago. IoT sensor costs have dropped to a level where full campus deployment is feasible on existing capital budgets. AI deterioration models have matured to the point where campus-specific prediction accuracy justifies operational decision-making. And the 2026 compliance environment, with OSHA Heat Illness Prevention documentation requirements, expanded EPA testing mandates, and credit agency deferred maintenance factors, has made the manual alternative legally and financially indefensible at any significant portfolio scale. Book a Demo to assess your campus's smart transformation readiness.
The IoT Foundation: What Gets Monitored and Why It Matters
The IoT layer of a smart campus is the data collection infrastructure that feeds the AI analytics platform. Without continuous real-time sensor data, AI models are limited to historical maintenance records and scheduled inspection inputs, producing condition estimates rather than condition measurements. The distinction determines the accuracy of predictive scheduling and the reliability of condition scoring for capital planning purposes.
Temperature, humidity, CO2, and equipment performance sensors across all occupied spaces provide the continuous data stream that replaces manual HVAC inspections and enables OSHA 2026 Heat Illness Prevention documentation automatically. Chiller performance monitoring detects efficiency degradation weeks before catastrophic failure.
Smart metering and power quality sensors track per-building and per-circuit electrical consumption, voltage anomalies, harmonic distortion, and demand spikes. Abnormal load signatures are detected in real time, enabling identification of failing equipment from electrical behavior before physical inspection is required.
Flow sensors, pressure monitors, and acoustic leak detectors across plumbing systems detect anomalies indicating pipe degradation, fixture failures, or Legionella risk conditions before they escalate to damage events. Water consumption monitoring by building enables benchmarking and automated EPA testing schedule triggers when consumption patterns suggest system issues.
Occupancy sensors across classrooms, labs, common areas, and dormitories drive AI optimization of HVAC, lighting, and access control to actual usage patterns rather than scheduled assumptions. Utilization data informs capital planning by identifying underused spaces for reprogramming and heavily used spaces requiring accelerated maintenance cycles.
Moisture sensors in roofing assemblies, exterior walls, and below-grade spaces detect water intrusion before interior damage occurs. Vibration sensors on mechanical equipment identify bearing wear, imbalance, and loosening connections. Together these inputs populate the AI deterioration model with the asset-specific data that improves prediction accuracy month over month.
Fire alarm, suppression, and emergency notification system status feeds into the unified platform alongside access control and security system data. This integration enables automated NFPA compliance documentation, real-time life safety system status monitoring, and Clery Act fire incident data capture without separate data entry or manual log maintenance.
How AI Converts IoT Data Into Operational Outcomes
Raw IoT data has no operational value without the AI layer that interprets it, identifies patterns, predicts outcomes, and generates the work orders and reports that drive facility operations. The AI capabilities below work from the continuous sensor data streams above to produce the specific operational outcomes that define smart campus performance. Book a Demo to see how the AI layer maps to your campus sensor infrastructure and existing systems.
- Continuous sensor data analyzed against asset age, usage, and peer deterioration rates
- Condition scores updated automatically between physical inspections for every monitored asset
- Failure probability calculated per asset with intervention timing recommendation
- Model accuracy improves monthly as campus-specific data accumulates in the training set
- IoT data streams monitored continuously against baseline operating parameters per asset
- Statistical anomalies flagged immediately when sensor readings deviate beyond threshold
- Alerts routed to responsible technician with asset history and recommended action
- False positive reduction through multi-sensor correlation before alert dispatch
- Occupancy-driven HVAC and lighting schedules replace fixed timer-based programming
- Demand response optimization reduces peak electrical demand charges automatically
- Per-building energy benchmarking identifies outliers for targeted maintenance intervention
- Documented deployments show 15-19% energy cost reduction from optimization alone
- Predictive maintenance work orders created from AI condition forecasts without manual scheduling
- Work orders routed to correct technician or contractor based on asset type and skill requirement
- Summer break and semester transition maintenance windows scheduled automatically from occupancy data
- Planned-to-reactive ratio tracked in real time with department-level accountability reporting
- OSHA, EPA, NFPA, ADA, and Clery Act documentation generated from live IoT and maintenance data
- Temperature monitoring records for OSHA 2026 Heat Illness Prevention produced continuously
- Inspection completion verification and corrective action tracking fully automated
- Audit packages assembled and exported on demand without manual documentation assembly
- Facility Condition Index calculated per building from continuous IoT-informed condition scores
- Multi-year capital scenarios modeled on live asset condition data replacing stale spreadsheets
- Five-year cost-of-deferral analysis generated per building for board capital presentations
- Board-ready and credit-agency-ready documentation exported with one click
Smart Campus Transformation Timeline: Four Phases
Smart campus transformation follows a four-phase deployment sequence that delivers measurable IoT and AI outcomes at each milestone. The program operates within existing capital and operational budgets. Service delivery is uninterrupted throughout all phases. IoT integration and initial AI scoring are operational within 60-90 days of deployment commencement.
- All existing BAS, smart meters, and sensor systems connected to unified platform
- Asset registry built from IoT device inventory and existing CMMS data
- AI baseline condition scores produced for all connected assets by month 3
- All facilities staff onboarded and operational in under 12 hours total
- AI deterioration model active across all IoT-connected asset classes
- Automated work order generation and dispatch operational campus-wide
- Emergency work orders declining as planned maintenance replaces reactive dispatch
- Energy optimization engine live with occupancy-driven HVAC and lighting
- FCI dashboard live with per-building condition scores from continuous IoT data
- Compliance documentation automated for OSHA, EPA, NFPA, and ADA requirements
- First board-ready capital presentation produced from live IoT-informed FCI data
- Corrective action tracking and verification fully automated across all buildings
- 18-30% maintenance cost reduction fully documented and audited
- 15-19% energy cost reduction measured against pre-deployment baseline
- Zero audit deficiencies across all compliance categories simultaneously
- AI model sharpens continuously as 18 months of campus-specific data accumulates
Documented Smart Campus Outcomes
The results below are drawn from documented university and K-12 deployments of integrated AI and IoT campus platforms measured against pre-deployment baselines on existing operational budgets. No additional headcount was added to achieve these outcomes. Book a Demo to see how these results translate to your campus portfolio and existing infrastructure.
| Smart Campus Metric | Before Deployment | After 18 Months | Change |
|---|---|---|---|
| Maintenance Cost per Sq Ft | $4.85 reactive avg | $3.40-$3.99 | -18% to -30% |
| Emergency Work Orders | 60-75% of budget | 60-75% fewer | -60% to -75% |
| Energy Operating Costs | No per-building visibility | 15-19% reduction | -15% to -19% |
| Reactive Maintenance Share | 31% of total spend | 9% of total spend | -71% |
| Asset Condition Data Age | 18-26 months average | Under 30 days | -98% |
| Audit Deficiencies | Multiple per cycle | Zero documented | -100% |
| Capital Project Cost Variance | 22% average overage | 6% average | -73% |
| Compliance Reporting Hours | Approx 140 hrs/cycle | Approx 18 hrs/cycle | -87% |
| Peer Institution Ranking | Bottom 22% | Top 40% | +18 percentile pts |
Key Benefits of Smart Campus AI and IoT Integration
IoT-informed AI scheduling converts reactive emergency spend into planned preventive work at a fraction of the per-event cost. No additional budget is required. The savings compound annually as the model accumulates more campus-specific deterioration data and improves prediction accuracy each month.
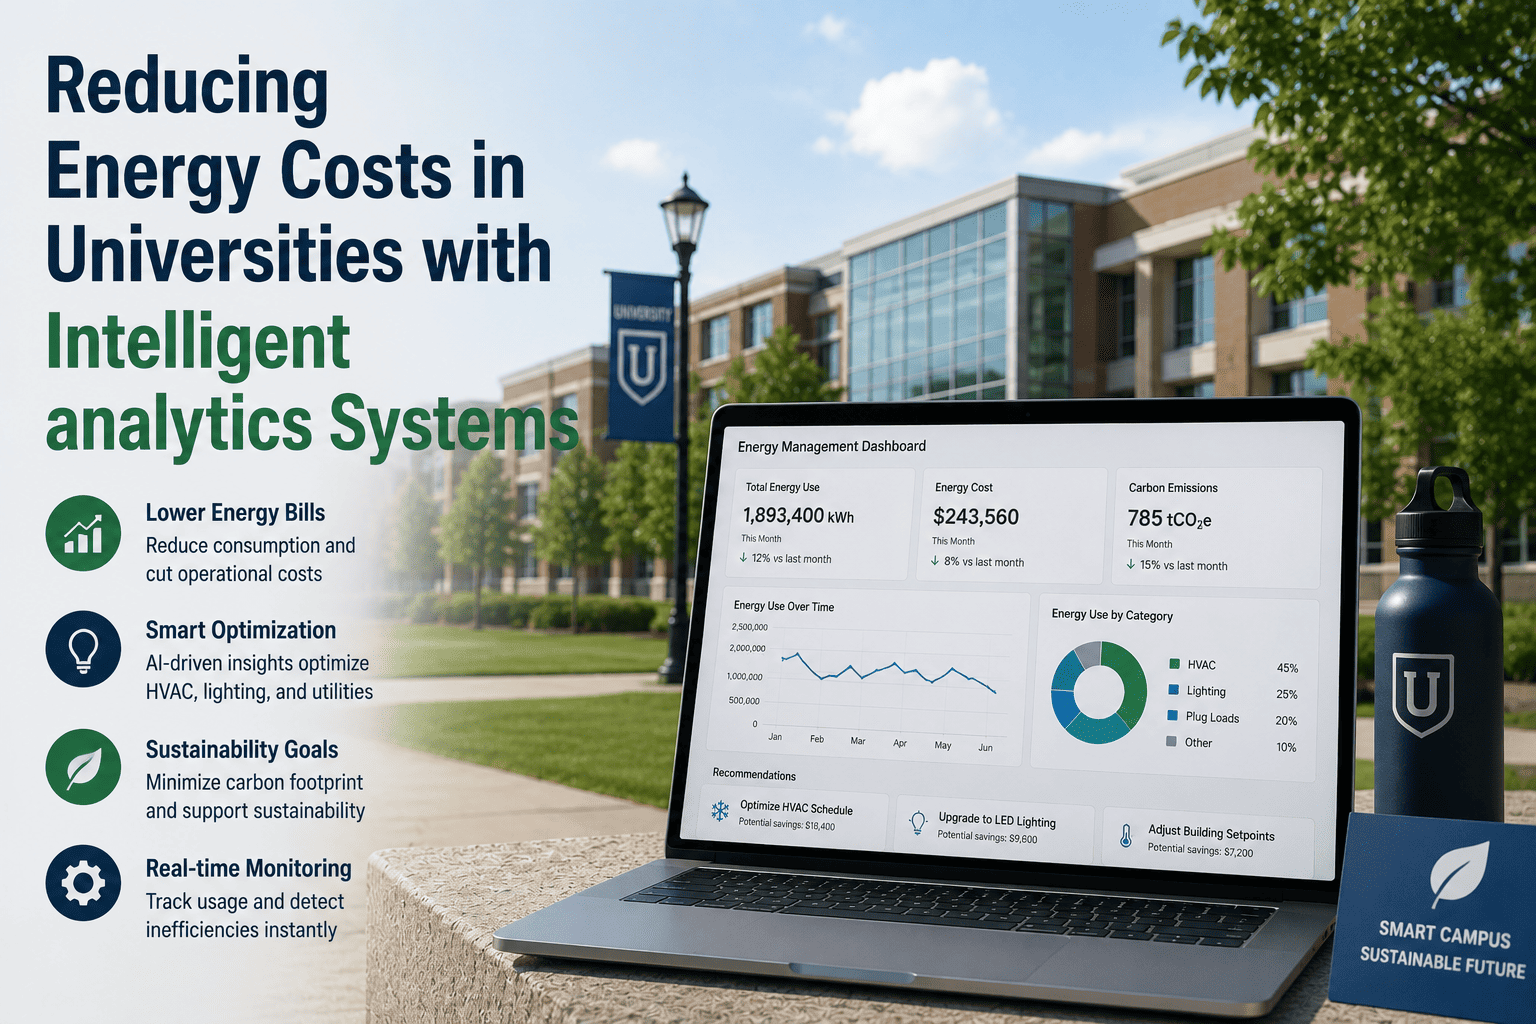
Occupancy sensor data drives HVAC and lighting to actual usage, eliminating conditioning of empty spaces. Per-building energy benchmarking identifies maintenance failures driving inefficiency. Combined with demand response optimization, documented deployments achieve 15-19% energy cost reductions from existing infrastructure with no capital equipment investment required.
Automated compliance documentation from continuous IoT data eliminates every finding category. OSHA 2026 Heat Illness Prevention, EPA testing requirements, NFPA inspection documentation, and Clery Act fire safety records are all produced automatically without manual assembly, delivering zero deficiencies across all frameworks in the same audit cycle.
Facility Condition Index data from continuous IoT monitoring replaces stale spreadsheet estimates in capital requests. Five-year cost-of-deferral analysis and multi-year CIP scenarios modeled on live condition data produce capital presentations that boards approve in single sessions rather than deferring for additional data. Capital project cost variance drops from 22% to 6% average on IoT-informed scoping.
Open API integration connects existing building automation systems, smart meters, and sensor networks to the unified AI analytics platform without replacing any current system. Data from 11 or more separate source systems is consolidated automatically. Core integration is operational within 60-90 days, and existing sensor coverage is supplemented only where gaps are identified during the asset registry build.
Each month of platform operation adds campus-specific IoT data that improves deterioration prediction accuracy for your buildings specifically. Seasonal patterns, equipment behavior under local climate conditions, and building-specific usage cycles all inform increasingly precise maintenance scheduling. The documented outcomes at month 18 are a floor, not a ceiling. The ROI trajectory is consistently upward.