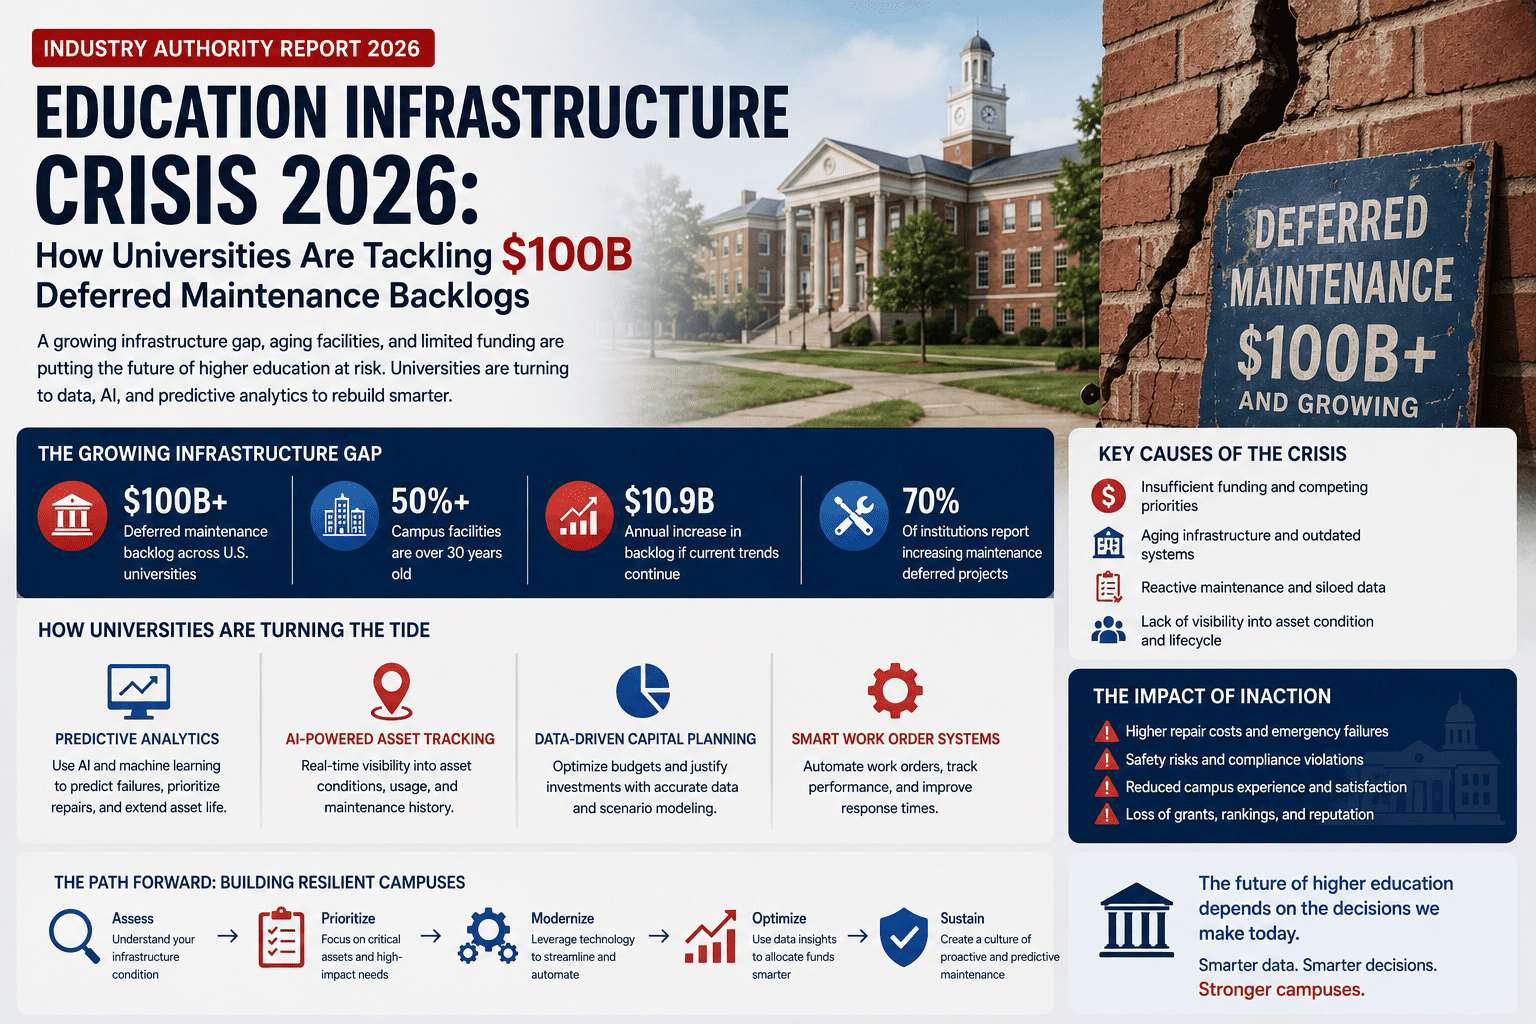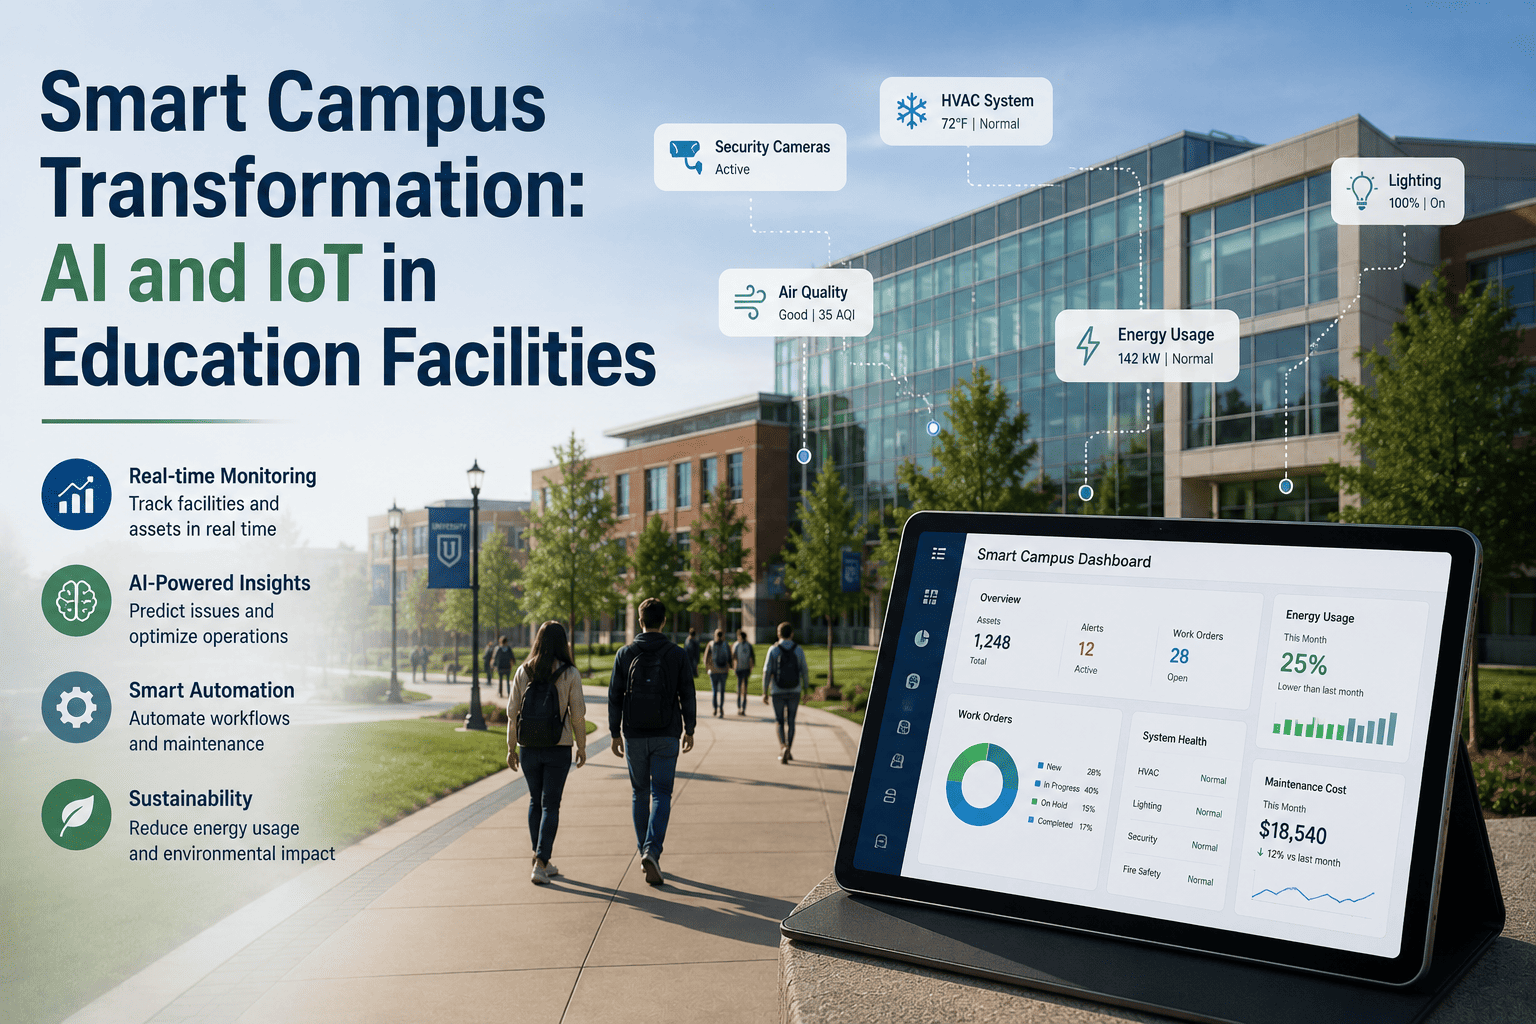
University campuses are sitting on one of the most expensive invisible liabilities in the public sector: analytics backlogs that compound silently year after year while boards approve capital requests built on data that is 18 to 26 months out of date. A typical mid-sized university manages 300 to 800 buildings, thousands of mechanical systems, aging utility infrastructure, and deferred assessment cycles that were paused during budget freezes and never restarted. The result is a facility management operation that reacts to failures rather than preventing them, approves capital budgets without verified condition data, and faces compliance audits with documentation gaps that cannot be closed manually. AI-driven analytics platforms have changed this calculus entirely. Universities that have deployed predictive analytics infrastructure are eliminating backlogs in 12 to 18 months, reducing maintenance costs 18 to 30 percent on existing budgets, and presenting boards with Facility Condition Index dashboards that turn capital requests into single-session approvals. Book a Demo to see how your university can begin eliminating its analytics backlog today.
What Is a University Analytics Backlog and Why It Keeps Growing
An analytics backlog is the accumulated gap between the condition data a university holds on record and the actual current condition of its buildings and systems. Every facility assessment that was skipped, every inspection cycle that was paused, every work order that was closed without updating the asset record adds to this gap. Unlike deferred maintenance, which is visible as a deteriorating roof or a failing chiller, a deferred analytics backlog is invisible until its consequences arrive: a capital project scoped on 24-month-old condition data that overruns by 30 percent, a compliance audit that finds the institution cannot substantiate its own infrastructure ratings, a board that defers a critical capital request because the supporting data is indefensible.
The backlog grows because manual assessment cycles cannot keep pace with the scale of modern campus portfolios. A facilities team managing 400 buildings on a three-year inspection rotation is always 18 to 24 months behind on a significant fraction of its portfolio. Budget freezes accelerate the gap. Staff turnover disrupts institutional knowledge. And without an automated data layer, every piece of condition information that is not manually entered is simply lost. Book a Demo to quantify your university's current analytics backlog depth.
The Scale of the Problem: University Analytics Backlog by the Numbers
University analytics backlogs are not a marginal inefficiency. They are a structural liability that compounds every fiscal year. The numbers defining the scope of this problem across U.S. higher education make clear why AI-driven remediation has become a capital planning priority at institutions that have quantified what their backlog is actually costing them each year it goes unaddressed.
Why Manual Remediation Cannot Close the Gap
The instinctive response to an analytics backlog is to hire more assessors, run more inspections, and update more records manually. This approach fails for three structural reasons that become apparent within the first year of attempting it.
A university with 400 buildings and a three-year inspection cycle requires assessing 133 buildings per year just to maintain current data. Adding staff addresses the immediate backlog but cannot prevent future accumulation. The portfolio grows. Staff capacity does not scale at the same rate. Within two to three years the backlog returns unless an automated data layer replaces manual dependency.
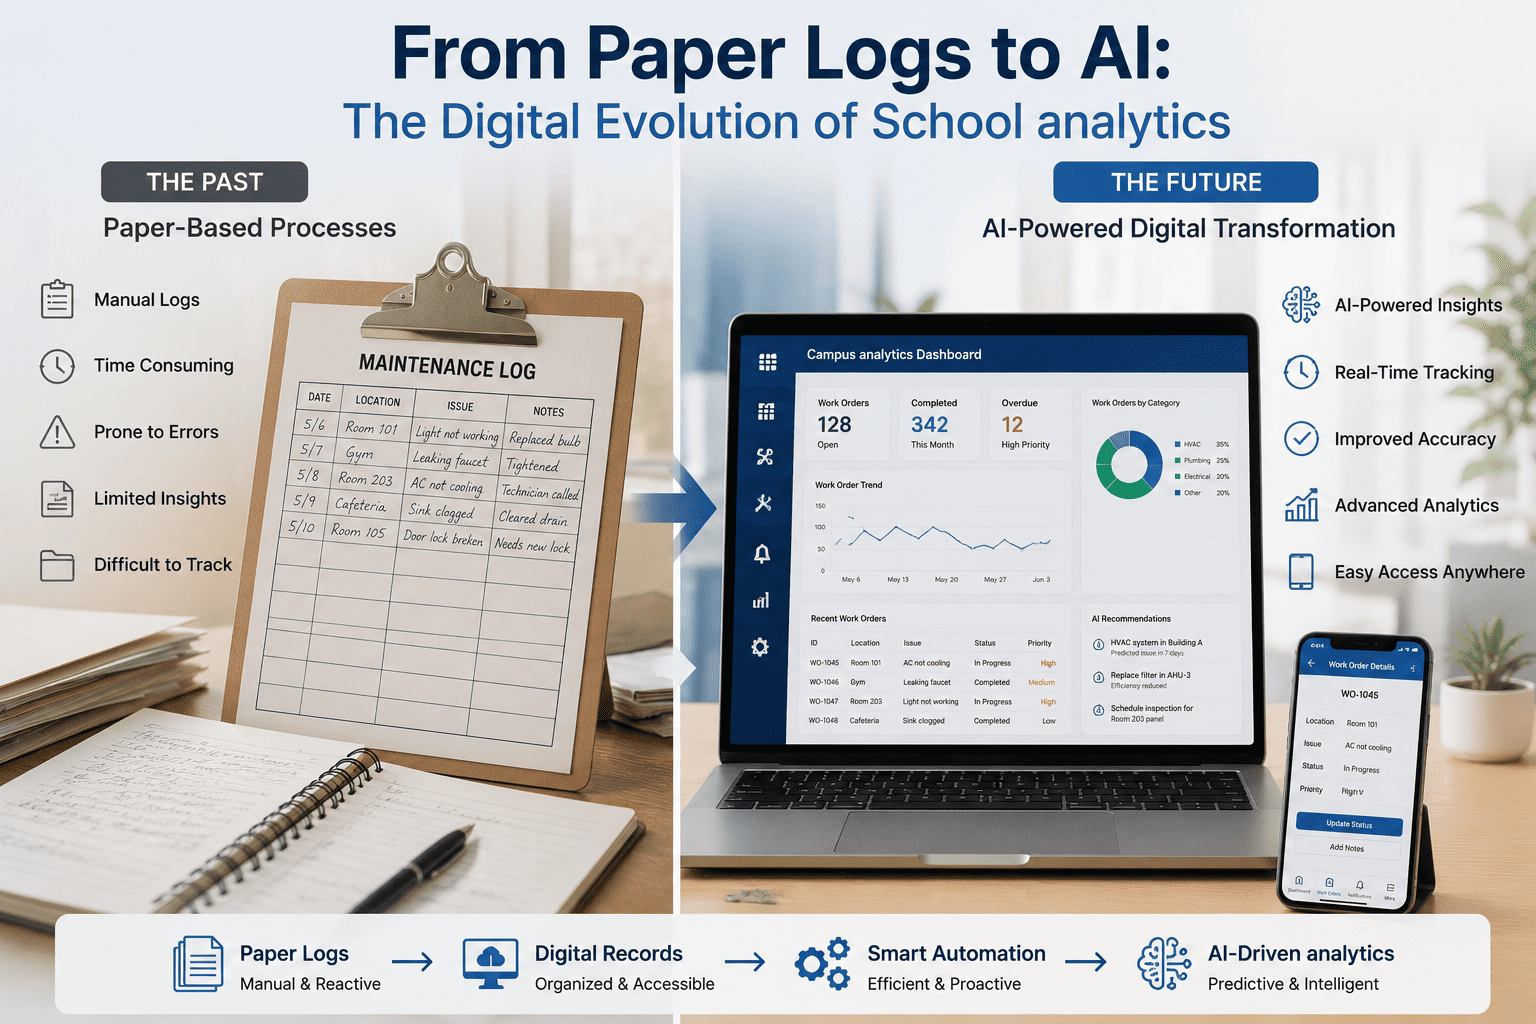
A manually assessed building has current condition data on the day of inspection and stale data every day afterward. Without AI deterioration modeling that continuously updates condition scores between physical inspections, the institution is always behind. By the time an assessment is complete, the portfolio has moved on. Manual assessment produces snapshots. AI analytics produces a continuous data stream.
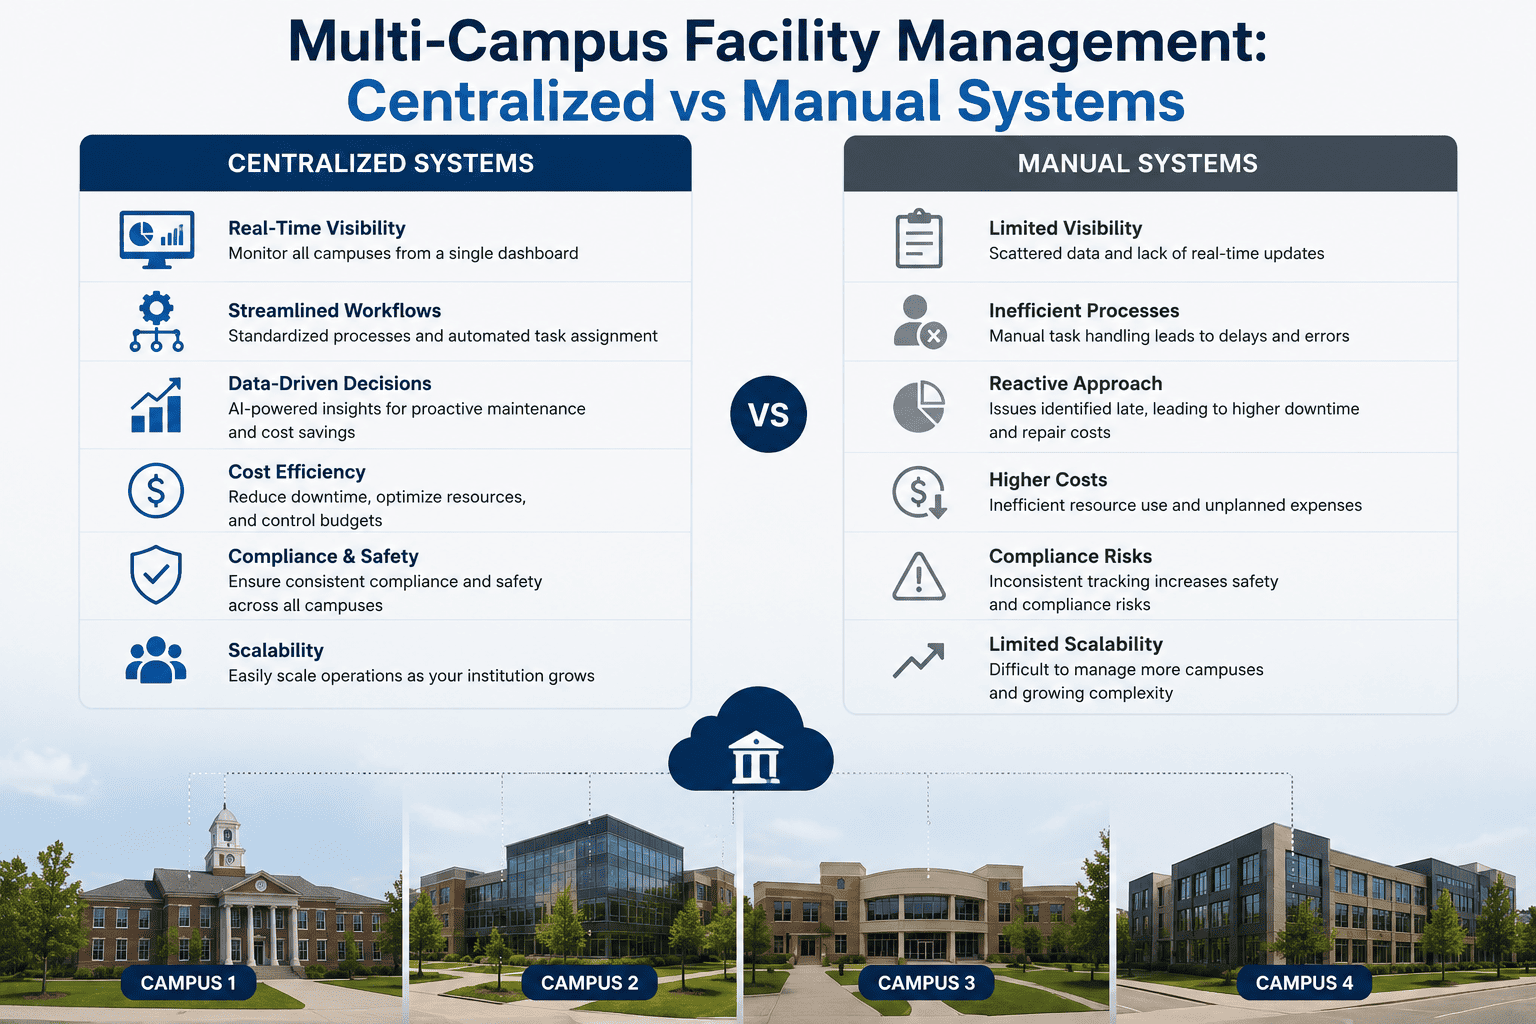
Even when manual assessments are completed, the data lives in department-specific spreadsheets that cannot be compared across buildings, disciplines, or fiscal years. Capital requests from facilities, engineering, and student housing compete without a shared scoring methodology. Boards cannot prioritize what they cannot compare. Manual remediation fills individual silos without building the integrated data layer that makes capital planning defensible.
How AI Eliminates University Analytics Backlogs: Six Core Capabilities
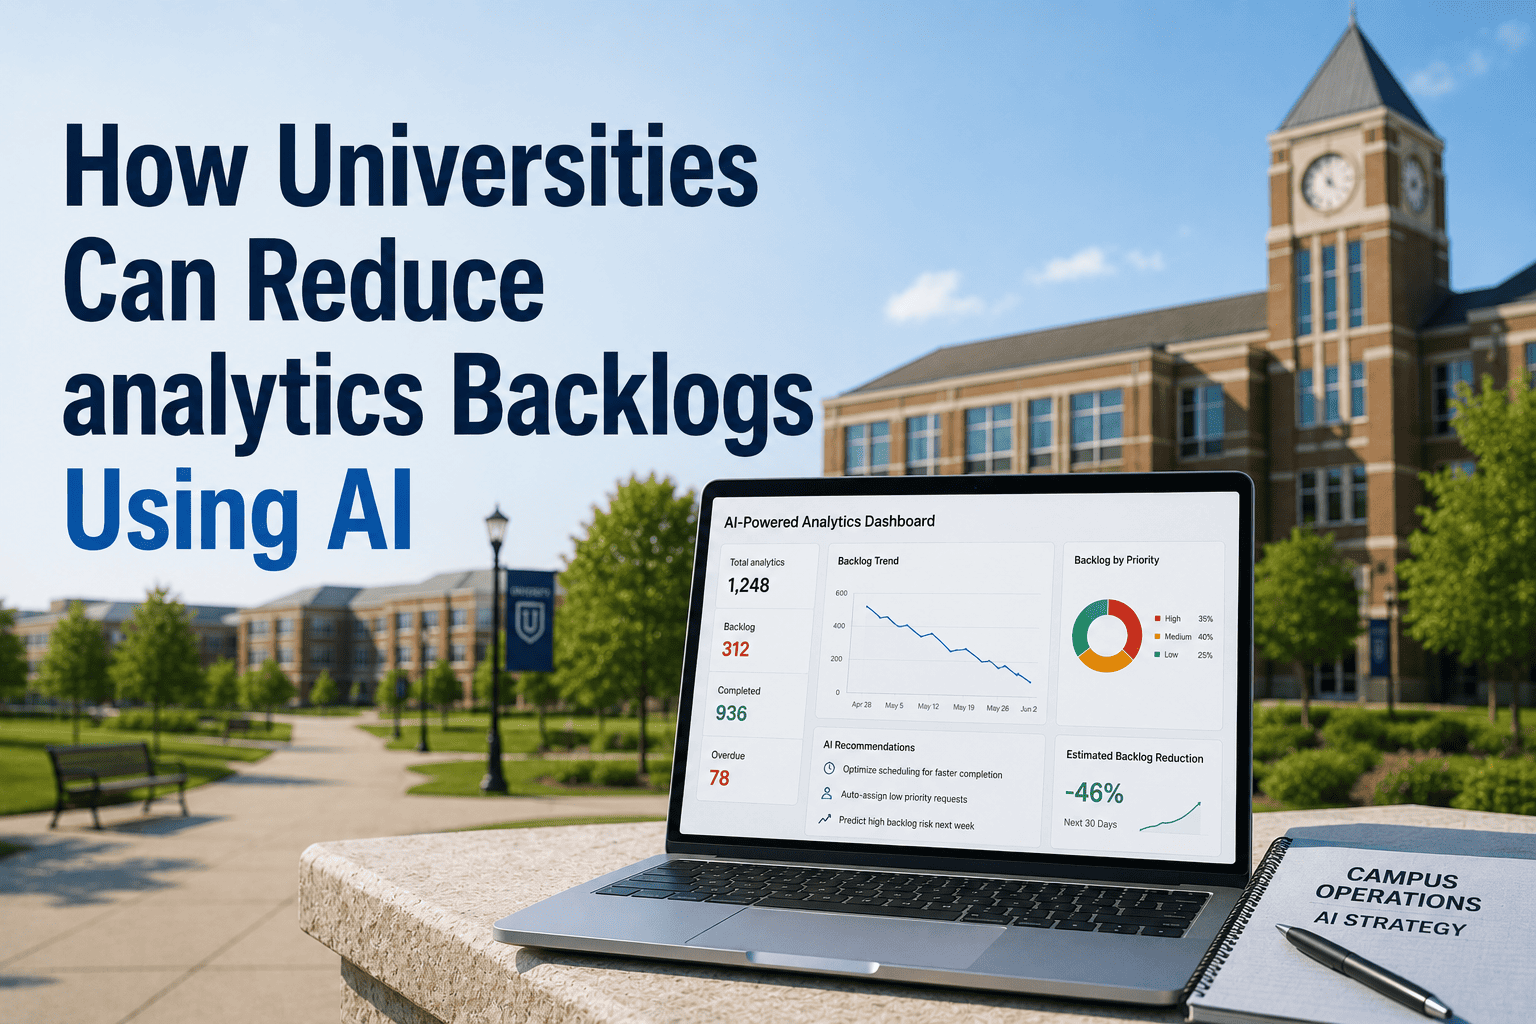
AI-driven analytics platforms eliminate university analytics backlogs through six integrated capabilities that replace every manual process that allowed the backlog to accumulate. Together these capabilities convert a reactive, inspection-dependent operation into a continuous automated data environment where condition information is never more than 30 days stale and every capital decision rests on a verifiable, current foundation. Book a Demo to see how each capability maps to your campus portfolio.
- All buildings, systems, and equipment consolidated in a single tracked record with full lifecycle data
- Install dates, lifecycle estimates, and condition scores maintained per asset and updated continuously
- Cross-building and cross-department deduplication eliminates conflicting and redundant records
- Real-time sync removes manual data transfer burden from every facilities department simultaneously
- Deterioration modeling predicts condition changes between physical inspections continuously across all assets
- Facility Condition Index calculated per building, per system, and per campus zone and updated automatically
- Alert triggers notify managers when condition thresholds are breached before failure occurs
- Condition data never more than 30 days stale versus 18-26 months at manual assessment institutions
- All overdue assessments identified, prioritized by risk, and scheduled automatically in Phase 1
- Historical condition data imported, validated, and reconciled against current field observations
- Backlog remediation progress tracked weekly with department-level accountability and reporting
- Remaining liability quantified and updated monthly as remediation advances across the portfolio
- All department capital requests scored on a unified defensible 100-point methodology using live FCI data
- Multi-year CIP scenarios modeled with verified asset condition replacing stale spreadsheet estimates
- Five-year total cost of deferral calculated per building to support evidence-based board presentations
- Board-ready and lender-ready audit package export completed in one click without manual assembly
- Preventive work orders generated directly from AI condition forecasts without manual scheduling intervention
- Summer break mega-scheduling for dormitory turnarounds and major renovations automated across all buildings
- PM completion rates tracked by building, department, and asset class in real time with accountability reporting
- Planned-to-reactive maintenance ratio monitored continuously and reported at department and portfolio level
- OSHA, EPA, and ADA compliance documentation generated automatically from live operational data
- Maintenance history records current and exportable for every tracked asset at all times without manual assembly
- Accreditation and state reporting packages produced on demand in required format with one-click export
- Credit-agency-ready deferred maintenance documentation with FCI trajectory reporting generated automatically
The Backlog Elimination Timeline: Four Phases to Full Analytics Maturity
AI-driven analytics backlog elimination follows a four-phase sequence designed to deliver audit-qualifying milestones first while building the long-term AI model that makes predictive scheduling increasingly accurate over time. The program operates within existing budget parameters. Service delivery is uninterrupted throughout all four phases. Core data integration is operational within 60 to 90 days of deployment start.
- All department systems connected to unified platform via open API integration
- Asset registry standardized and all assets validated across every campus building
- Condition data age: 18-26 months reduced to 8 months average by month 3
- All facilities staff onboarded and fully operational in under 12 hours total
- AI condition scoring engine active across all campus asset classes simultaneously
- Automated PM scheduling live for HVAC, electrical, roofing, and facility systems
- Backlog remediation 61% complete by month 8 across all departments
- First unified capital project scoring and FCI dashboard produced for board review
- Capital planning dashboard deployed and active across all university departments
- Multi-year CIP model built entirely on live verified asset condition data
- State audit corrective action fully satisfied by month 12 where applicable
- Peer institution ranking improved from bottom quartile to top 40% documented
- Full backlog eliminated, 91% of outstanding assessments remediated and current
- Condition data under 30 days for all asset classes across the entire campus portfolio
- Zero independent audit deficiencies across all tracked systems and compliance areas
- Reactive maintenance share reduced from 31% to 9% of total maintenance spend
Documented Results Across University Deployments
Every result below is drawn from documented university and campus deployments measured against pre-deployment baselines on the same operational budgets. No additional funding was allocated to achieve these outcomes. The improvements reflect the same maintenance dollar redirected from reactive emergency spend to planned preventive work through AI-driven scheduling. Book a Demo to see how these outcomes translate to your institution's asset portfolio and budget profile.
| Metric | Before Deployment | After 18 Months | Change |
|---|---|---|---|
| Analytics Backlog Outstanding | 100% outstanding | 91% eliminated | -91% |
| Condition Data Age | 26 months average | Under 30 days | -98% |
| Reactive Maintenance Rate | 31% of total spend | 9% of total spend | -71% |
| Capital Project Cost Variance | 22% average overage | 6% average | -73% |
| Maintenance Cost per Sq Ft | $4.85 reactive average | $3.40-$3.99 documented | -18% to -30% |
| Emergency Work Orders | 60-75% of budget consumed | 60-75% fewer events | -60% to -75% |
| Audit Deficiencies | Multiple findings, corrective action | Zero deficiencies | -100% |
| Peer Institution Ranking | Bottom 22% | Top 40% | +18 percentile points |
| Quarterly Reporting Hours | Approx 140 hours manual | Approx 18 hours automated | -87% |
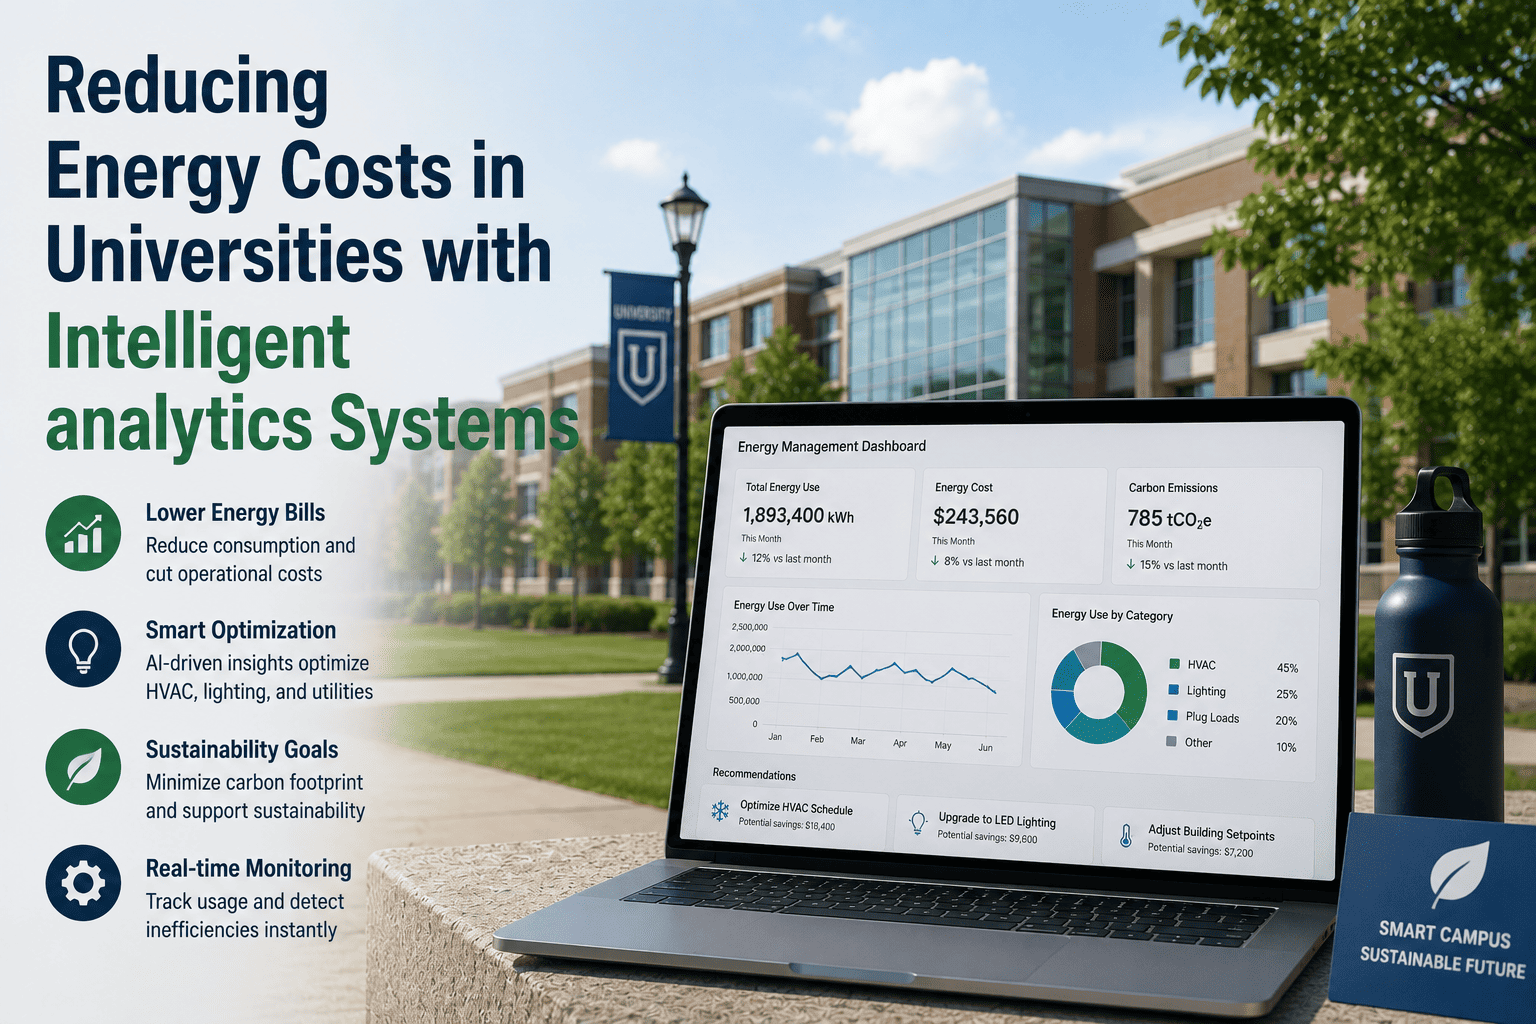
| Energy Cost Reduction | No per-building visibility | 15-19% reduction documented | -15% to -19% |
Key Benefits for University Facility Teams and Leadership
AI-driven analytics backlog elimination delivers compounding value across every dimension that determines university facility management performance. Each benefit below is documented across real campus deployments and represents outcomes achievable on existing operational budgets without disrupting service delivery or adding permanent headcount to the facilities organization.
The accumulated condition assessment gap that has grown for years is fully remediated within 18 months through a combination of AI-driven condition modeling, risk-prioritized field deployment, and historical data validation. The remediation program operates within existing maintenance budgets by converting reactive spend into planned preventive work at a lower per-event cost.
FCI dashboards showing per-building condition scores, five-year cost-of-deferral analysis, and multi-year CIP scenarios replace anecdotal crisis summaries in board presentations. Documented deployments show boards approving full capital requests in single sessions when condition data is current, verified, and presented in a format that enables comparison and prioritization across all competing requests.
The 2026 compliance environment requires maintenance schedule documentation, condition records, and testing histories that manual operations cannot produce consistently at scale. The platform generates all required compliance reports automatically from live data, eliminating the manual assembly burden while ensuring that documentation is current and exportable on demand for any audit or oversight review.
Credit agencies factor deferred maintenance documentation into institutional credit assessments on an annual basis. The platform generates FCI reports, capital replacement schedules, and remediation trajectory documentation that allows universities to demonstrate stewardship to bond rating analysts. Institutions with documented remediation programs borrow at materially lower rates than those with undocumented backlogs.
The unified analytics platform creates a shared data environment across facilities, engineering, student housing, utilities, and finance that did not exist before deployment. All departments operate from a single verified asset record. Cross-department capital planning becomes possible for the first time. The reconciliation work and data conflicts that made campus-wide planning impossible are eliminated at the foundation level.
Each month of platform operation adds campus-specific deterioration data that improves AI condition scoring accuracy for your buildings specifically. Predictive scheduling sharpens. Capital cost variance declines. Energy efficiency improves as maintenance failures are resolved earlier. The cost savings documented at month 18 are a documented floor. The trajectory is consistently upward as the model matures across the full campus portfolio.
Conclusion
University analytics backlogs are not a symptom of underfunding. They are a cause of it. The $112 billion deferred capital renewal backlog across U.S. higher education compounds every year that institutions lack the data infrastructure to make defensible capital arguments, schedule planned maintenance before asset failures occur, and satisfy compliance requirements with documentation that manual operations cannot produce consistently at scale.
The universities eliminating their backlogs, reducing reactive maintenance by 71%, achieving zero audit deficiencies, and improving board capital approval rates are not operating on larger budgets. They are operating on current data. AI-driven analytics platforms convert the same maintenance dollar from reactive emergency spend into planned preventive work and generate the FCI documentation that gives boards the confidence to fund infrastructure renewal rather than defer it to the next fiscal cycle.
The cost of deploying AI-driven analytics infrastructure is fixed and quantifiable. The cost of the backlog it prevents is neither. Book a Demo or Contact Support to begin quantifying your university's analytics backlog and its annual cost today.