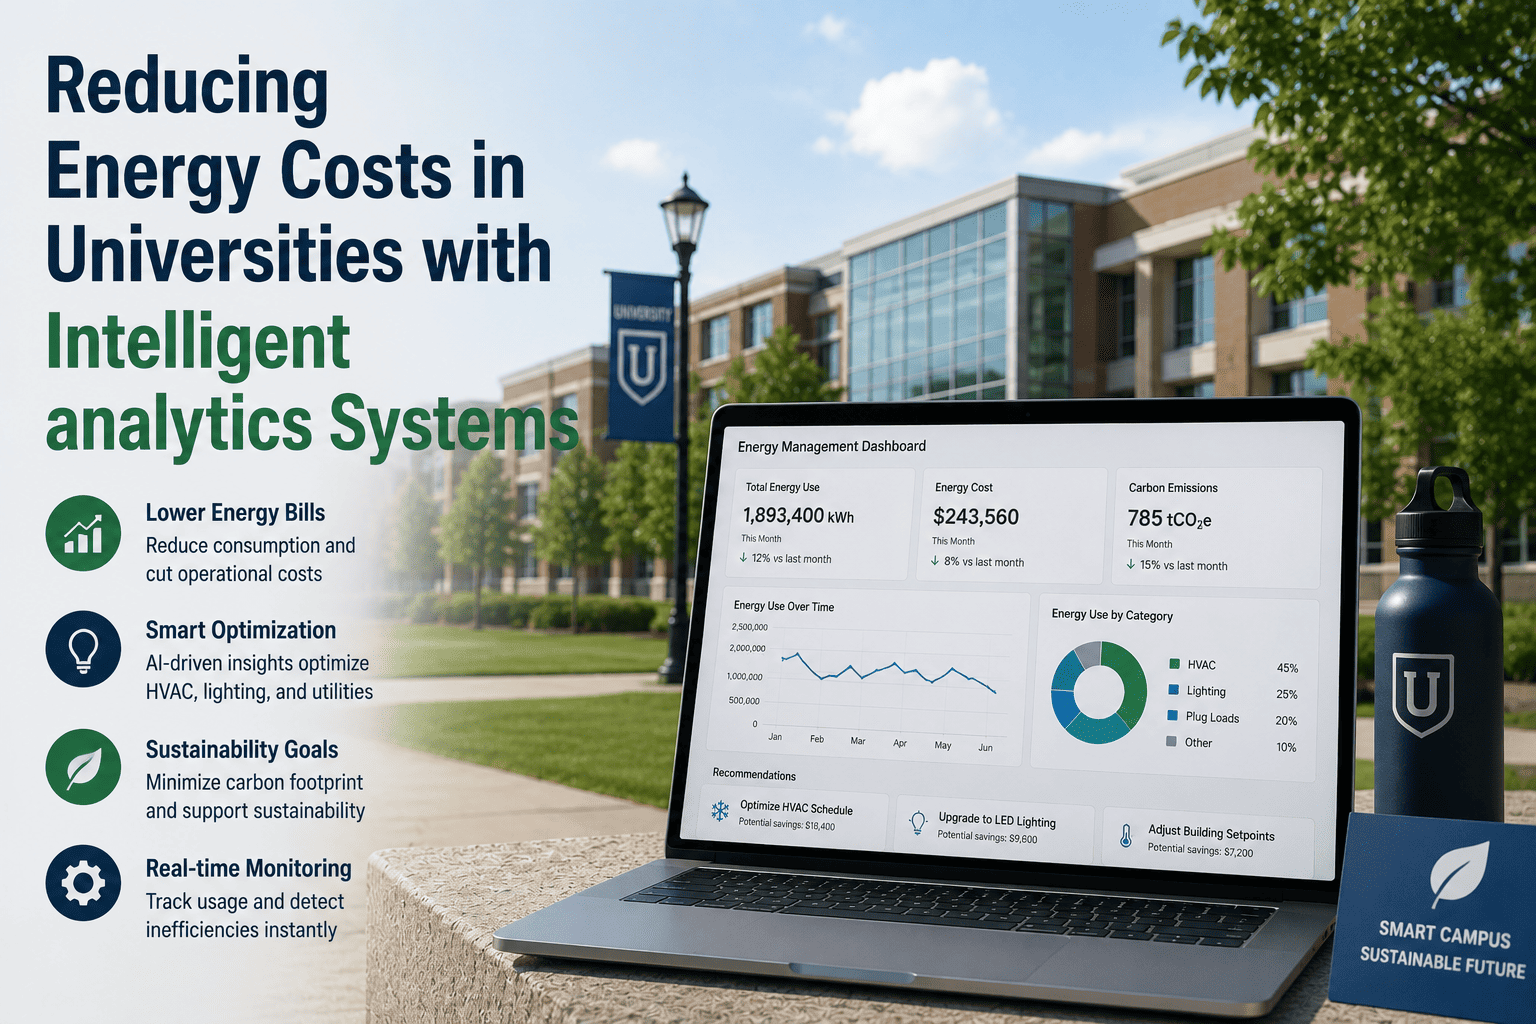
Universities and school districts managing large campus portfolios face energy operating costs that consume 20-35% of total facilities budgets annually. Unlike commercial buildings with single tenants and predictable schedules, campuses run laboratories, dormitories, dining halls, athletic facilities, and administrative offices simultaneously under unpredictable occupancy patterns. Fixed-schedule HVAC and lighting programming cannot adapt to actual usage, and without per-building consumption visibility, facility teams cannot identify which buildings are driving inefficiency or why. Intelligent analytics systems change this by connecting IoT sensor data, occupancy feeds, and utility meter data into a unified AI platform that optimizes energy use in real time and identifies maintenance failures driving excess consumption before they compound. Documented university deployments show 15-19% energy cost reductions on existing infrastructure with no capital equipment replacement required. Book a Demo to see how intelligent analytics maps to your campus energy infrastructure.
Why Campus Energy Management Is Uniquely Complex
University campuses are among the most operationally complex building portfolios managed by any single facilities organization. A single institution may operate science labs with 24-hour ventilation requirements, residence halls with occupancy that shifts 80% between academic year and summer break, dining facilities with intense kitchen exhaust loads, and athletic facilities with event-driven crowd peaks, all under one facilities budget. The energy demand profile of these building types has almost nothing in common, yet most campuses manage them under the same fixed-schedule HVAC and lighting programming applied institution-wide.
The result is chronic over-conditioning of spaces during low-occupancy periods and under-serviced maintenance failures that degrade HVAC efficiency silently for months before appearing as a complaint or visible breakdown. Intelligent analytics systems address both problems simultaneously by replacing schedule-based assumptions with real-time occupancy and sensor data, and by flagging energy consumption anomalies that indicate equipment degradation before they escalate to failure events.
How Intelligent Analytics Systems Reduce Campus Energy Costs
Energy savings from intelligent analytics come from three distinct mechanisms that operate simultaneously once the platform is live. Occupancy-driven optimization eliminates conditioning of empty spaces. Anomaly detection identifies maintenance failures causing energy waste. Demand response management reduces peak electrical charges. Together these mechanisms produce the documented 15-19% reduction without capital equipment investment. Book a Demo to see how each mechanism applies to your campus building portfolio.
- Real-time occupancy sensor data replaces fixed timer schedules for HVAC and lighting control
- Classrooms, labs, and common areas conditioned only when occupied, automatically
- Summer break and semester transition setbacks applied campus-wide without manual reprogramming
- Documented deployments eliminate 30-40% of energy consumed conditioning empty spaces
- Per-building consumption benchmarked continuously against peer buildings and historical baseline
- Statistical deviations flagged immediately when a building consumes above expected range
- HVAC faults, stuck dampers, leaking valves, and degraded chiller performance identified from energy signatures
- Maintenance work order generated automatically with fault description and recommended action
- AI forecasts campus demand peaks using weather data, occupancy schedules, and equipment run history
- Pre-cooling and pre-heating strategies shift thermal load away from peak utility rate windows
- Demand charges reduced by flattening load spikes that trigger ratchet billing provisions
- Utility tariff structure analyzed continuously to identify rate schedule optimization opportunities
- Energy use intensity calculated per building in real time against campus peers and national benchmarks
- Highest-consuming buildings ranked automatically for targeted intervention prioritization
- Sustainability reporting for ENERGY STAR, LEED, and state disclosure requirements generated automatically
- Board-ready consumption trend reports exported without manual data assembly
- Lab occupancy sensors enable demand-controlled ventilation that meets ASHRAE 62.1 minimums dynamically
- Fume hood sash position monitoring reduces exhaust volume when hoods are unoccupied
- Lab HVAC energy represents 5-10x the intensity of office space; optimization impact is proportionally larger
- Safety interlocks maintained at all times; ventilation optimization never compromises code compliance
- Solar PV and battery storage systems integrated into the analytics platform for whole-campus energy visibility
- Carbon emissions calculated per building using utility grid mix data and on-site generation records
- Scope 1 and Scope 2 emissions reporting automated for sustainability commitments and accreditation requirements
- Load shifting algorithms maximize self-consumption of renewable generation during peak tariff hours
Where Campus Energy Is Wasted and What Analytics Finds
University energy waste concentrates in predictable patterns that are invisible without per-building, per-system data. Intelligent analytics platforms surface these patterns within the first semester of deployment, providing the specific intervention targets that manual energy audits cannot identify between audit cycles. The categories below represent the primary waste sources documented across university and K-12 deployments.
Classrooms, lecture halls, and administrative offices running full HVAC during nights, weekends, and semester breaks account for the largest single category of preventable energy waste on most campuses. Analytics identifies these patterns within days and triggers automated setback programming without manual BAS reprogramming.
Central plant chillers and boilers losing 15-25% efficiency due to fouling, refrigerant leaks, or control drift consume significantly more energy per ton or BTU than their nameplate ratings while appearing operationally normal. Energy consumption anomaly detection identifies this degradation from electrical and thermal data weeks before failure.
Simultaneous heating and cooling in dual-duct and reheat HVAC systems represents one of the most wasteful operational patterns in university buildings, often caused by faulty controls or misconfigured sequences of operation. Analytics platforms detect this condition from supply and return temperature differentials and flag it for immediate corrective maintenance.
Dormitory energy consumption increases gradually each academic year as students add plug loads, HVAC systems age, and envelope performance degrades. Per-room and per-floor metering through analytics platforms identifies the specific buildings and floors with abnormal consumption, enabling targeted audits rather than campus-wide investigations.
Building automation systems in service for more than five years accumulate override commands, obsolete schedules, and mis-configured setpoints that collectively erode 10-20% of the energy savings those systems were designed to deliver. Analytics platforms audit active BAS configurations continuously and flag deviations from optimal sequences automatically.
Economizer dampers stuck in closed position force mechanical cooling during conditions where free cooling from outdoor air would suffice, adding thousands of dollars in compressor operation annually per failed unit. Analytics platforms detect economizer failures from supply air temperature and outdoor air temperature differentials and dispatch maintenance before the next cooling season begins.
Documented Energy Cost Reduction Outcomes
The results below are drawn from documented university and K-12 deployments of intelligent energy analytics platforms measured against pre-deployment baselines on existing infrastructure budgets. No capital equipment replacement was required to achieve these results. Book a Demo to see how these outcomes translate to your campus energy profile and utility cost structure.
| Energy Analytics Metric | Before Deployment | After 18 Months | Change |
|---|---|---|---|
| Total Energy Operating Cost | Baseline 100% | 81-85% of baseline | -15% to -19% |
| Peak Electrical Demand Charges | Unmanaged spikes | 12-18% reduction | -12% to -18% |
| Empty Space Conditioning | 30-40% of HVAC runtime | Near-zero unoccupied runtime | -30% to -40% |
| Chiller Plant Efficiency (kW/ton) | Degraded, unmonitored | Fault-corrected optimal | 10-15% improvement |
| BAS Override Accumulation | Continuously audited | Eliminated | |
| Energy Reporting Hours per Cycle | Approx 140 hrs | Approx 18 hrs | -87% |
| Per-Building Consumption Visibility | Utility bill totals only | Real-time per building | Full visibility |
| Fault Detection Time | Weeks to months | Hours to days | -95%+ |
| Sustainability Report Assembly | Manual, quarterly | Automated, on demand | -87% hours |
Implementation Phases: From Integration to Full Optimization
Intelligent analytics deployment follows a structured four-phase sequence that delivers measurable energy savings at each milestone. Initial energy optimizations begin within the first semester. Full documented ROI across all optimization mechanisms is achieved at month 18. The platform connects to existing BAS, meters, and sensor infrastructure via open API without replacing any current system.
- All smart meters, BAS systems, and occupancy sensors connected to analytics platform
- Per-building energy baseline established from historical meter data
- Initial occupancy-driven optimization active within 60-90 days
- Energy waste patterns identified and ranked for intervention prioritization
- Real-time fault detection active across all connected HVAC and electrical systems
- Peak demand forecasting and load shifting strategies operational
- First semester energy cost reduction measurable against pre-deployment baseline
- BAS schedule audit completed and optimization corrections applied campus-wide
- ENERGY STAR, LEED, and state disclosure reports generated automatically from platform data
- Carbon tracking and Scope 1 and 2 emissions reporting live for institutional commitments
- Board-ready energy performance dashboards available with one-click export
- Per-building EUI benchmarked against CBECS and peer institution averages automatically
- 15-19% energy cost reduction fully documented and audited against baseline
- AI demand models sharpened by 18 months of campus-specific consumption and weather data
- Renewable integration and battery optimization active where applicable
- Savings trajectory continues upward as model accumulates additional seasonal cycles
Key Benefits of Intelligent Campus Energy Analytics
Occupancy-driven optimization eliminates conditioning of empty spaces. Anomaly detection corrects maintenance-driven waste. Demand management reduces peak charges. All three savings streams operate simultaneously from day one of deployment without capital equipment investment.
HVAC faults, degraded chiller efficiency, stuck dampers, and BAS control failures identified from electrical and thermal data before they cause failures or complaints. Each fault corrected at detection eliminates weeks of accumulated energy waste that would otherwise compound unnoticed between inspection cycles.
Energy use intensity calculated per building in real time replaces utility bill totals as the basis for energy management decisions. Highest-consuming buildings identified automatically for targeted intervention, and consumption trend data supports board-ready capital presentations for energy improvement projects.
ENERGY STAR Portfolio Manager submissions, LEED operations and maintenance documentation, state utility disclosure requirements, and institutional carbon commitment reports generated automatically from continuous platform data. The 87% reduction in reporting hours redirects staff capacity to energy project implementation.
Open API integration connects Johnson Controls, Siemens, Honeywell, Schneider Electric, and other major BAS platforms alongside smart meters and occupancy sensors without replacing any current system. Core integration operational within 60-90 days. No capital equipment budget required for deployment.
Each month of operation adds campus-specific consumption, weather, and occupancy data that sharpens demand forecasting and fault detection accuracy for your buildings specifically. Seasonal patterns, equipment aging curves, and local climate behavior all inform increasingly precise optimization. Documented savings at month 18 represent a floor, not a ceiling.