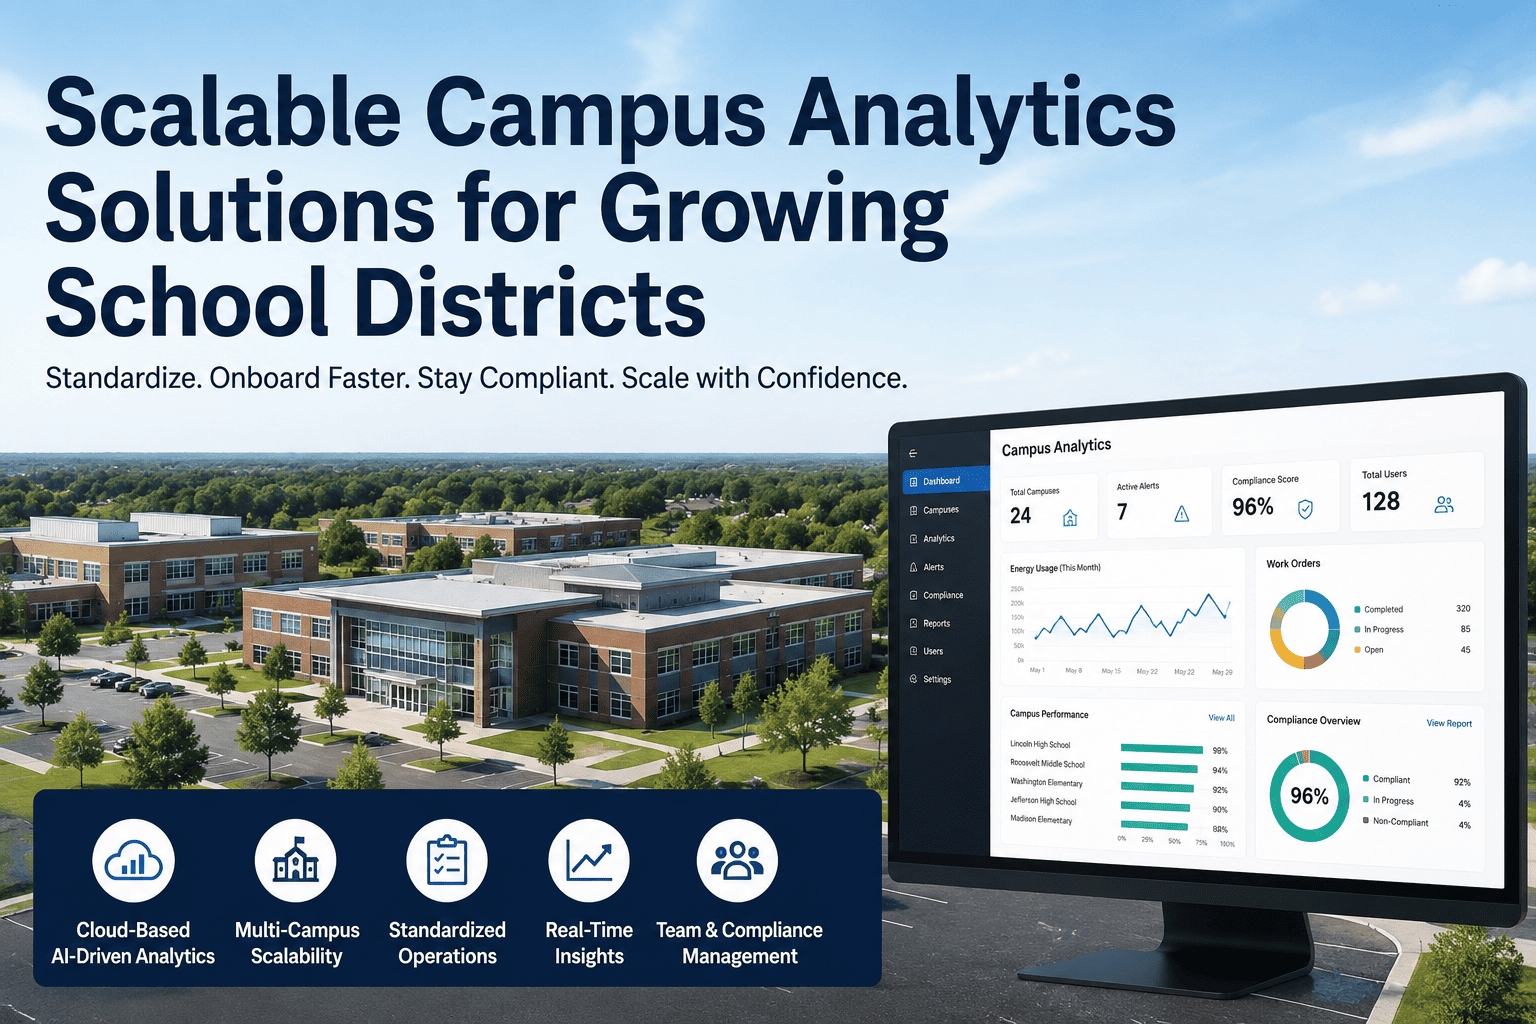
School administration once meant rows of filing cabinets, manual attendance registers, and handwritten maintenance logs reviewed weeks after the fact. Today, institutions that have moved beyond paper-based systems to AI-driven analytics platforms are operating with a fundamentally different information advantage real-time visibility into every academic, operational, and compliance dimension of campus life. The digital evolution of school analytics is not a future aspiration. It is an operational shift with documented outcomes available now. Institutions that have deployed integrated AI analytics platforms report 40-60% reductions in administrative workload, 70-85% faster incident response, 25-35% improvements in student outcome tracking accuracy, and complete elimination of compliance documentation gaps. Book a Demo to see how AI-driven school analytics transforms your institution's decision-making.
What the Digital Evolution of School Analytics Means in 2026
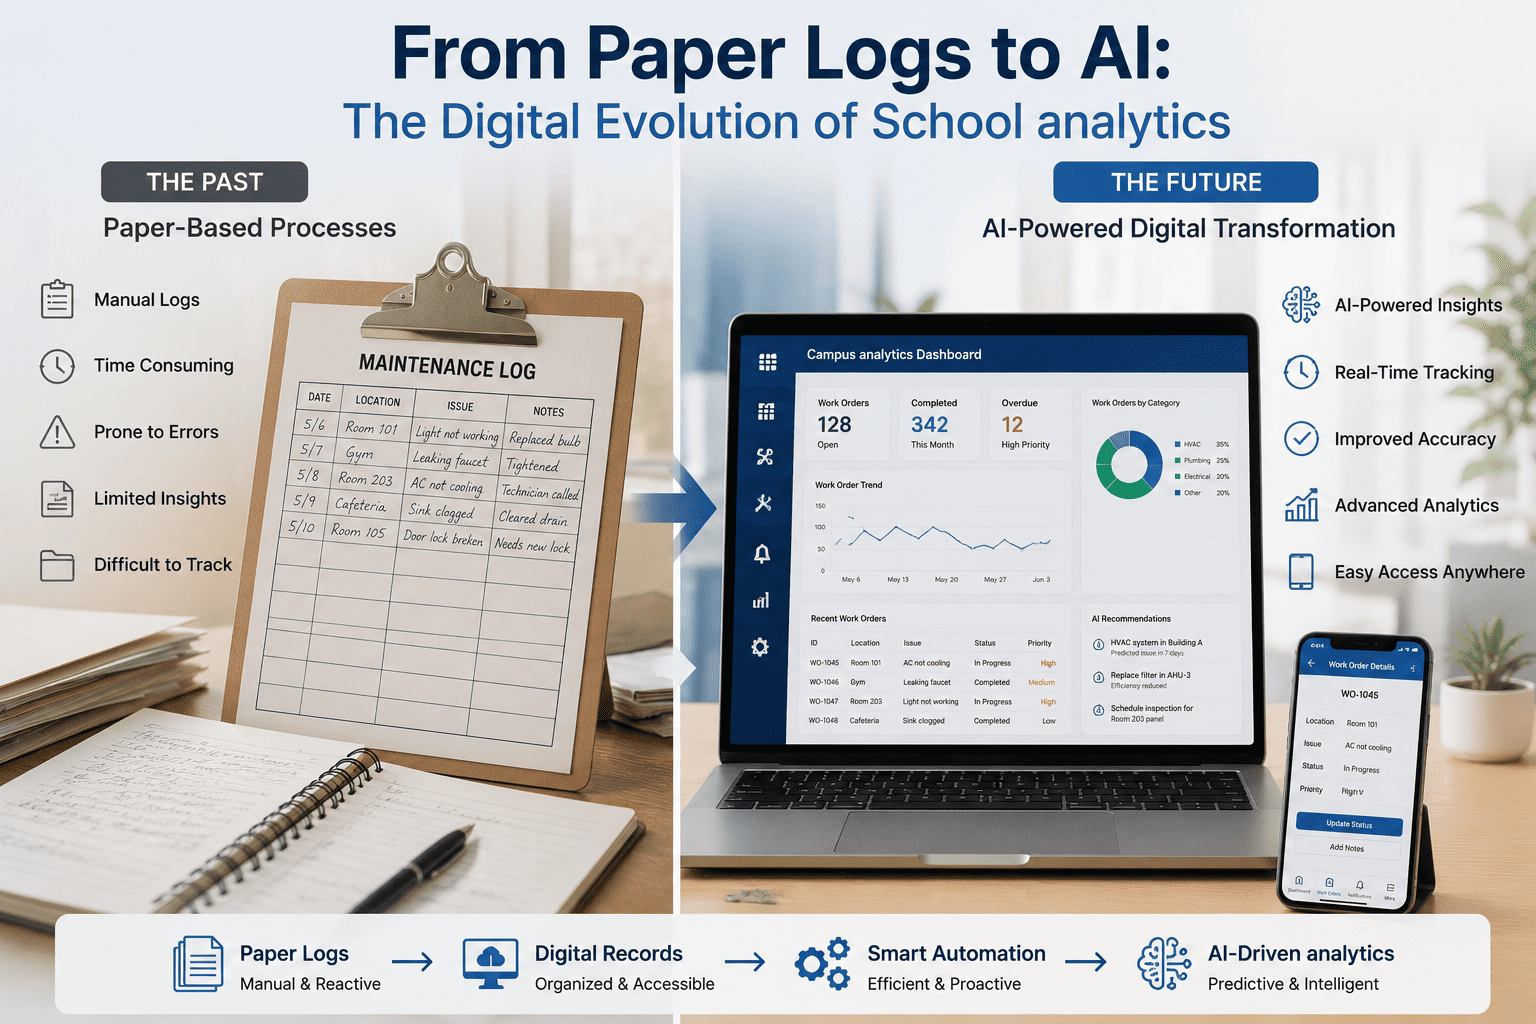
The transition from paper logs to AI-driven analytics is not simply a digitization exercise. It is a structural transformation in how schools collect, interpret, and act on data. A paper-based system produces information only when someone physically records it. An AI-driven analytics platform produces continuous data from every touchpoint: automated attendance feeds, real-time facility sensor inputs, live academic performance streams, and integrated financial records that feed a unified decision layer without manual entry.
In 2026, the case for completing this transition has become structurally urgent. Regulatory reporting requirements across FERPA, Title IX, IDEA, and state accreditation frameworks now demand documentation granularity that paper systems cannot reliably produce. Competitive enrollment pressure means institutions need early-warning student success analytics that only continuous data streams can enable. The operational cost differential between AI-automated administration and manual paper processing has grown to the point where the paper alternative is no longer financially defensible at any institution with more than a few hundred students. Book a Demo to assess your institution's current analytics maturity and transformation pathway.
What Paper-Based Systems Actually Cost Schools
Before understanding what AI analytics enables, it is necessary to quantify what paper-based systems cost in operational terms. Schools running on paper logs and disconnected spreadsheets face four categories of compounding cost that remain invisible until the transition reveals the gap.
Paper systems produce information days or weeks after events occur. A student's attendance pattern indicating dropout risk is invisible until a counselor manually reviews a register. A maintenance issue flagged in a paper log may sit unactioned for weeks before the intervention window has closed permanently.
Manual data entry, reconciliation, and report assembly consume staff time that paper-based administrators rarely quantify. Documented transitions reveal that schools were spending 140-180 hours per compliance reporting cycle on manual documentation assembly alone, hours that automated platforms reclaim entirely for student-facing work.
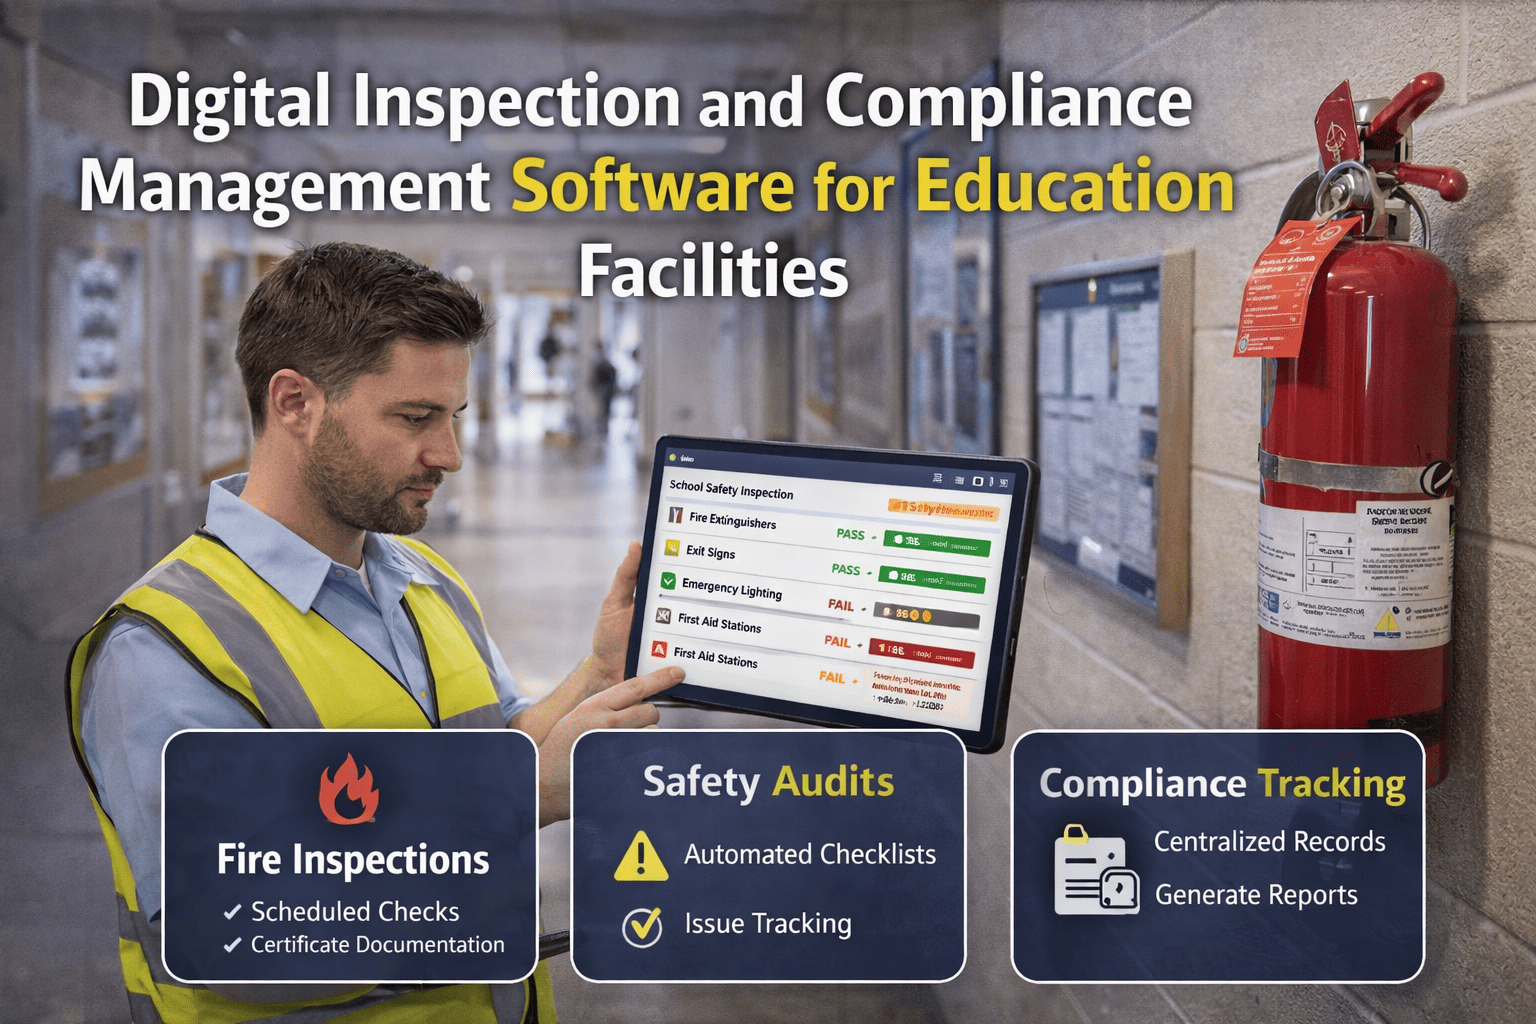
Paper documentation systems produce systematic gaps in regulatory records because they depend on consistent human execution across every shift and every building. FERPA, IDEA, and state accreditation auditors consistently find deficiencies in paper-managed institutions that are structurally unavoidable, not a personnel failure but a system design failure.
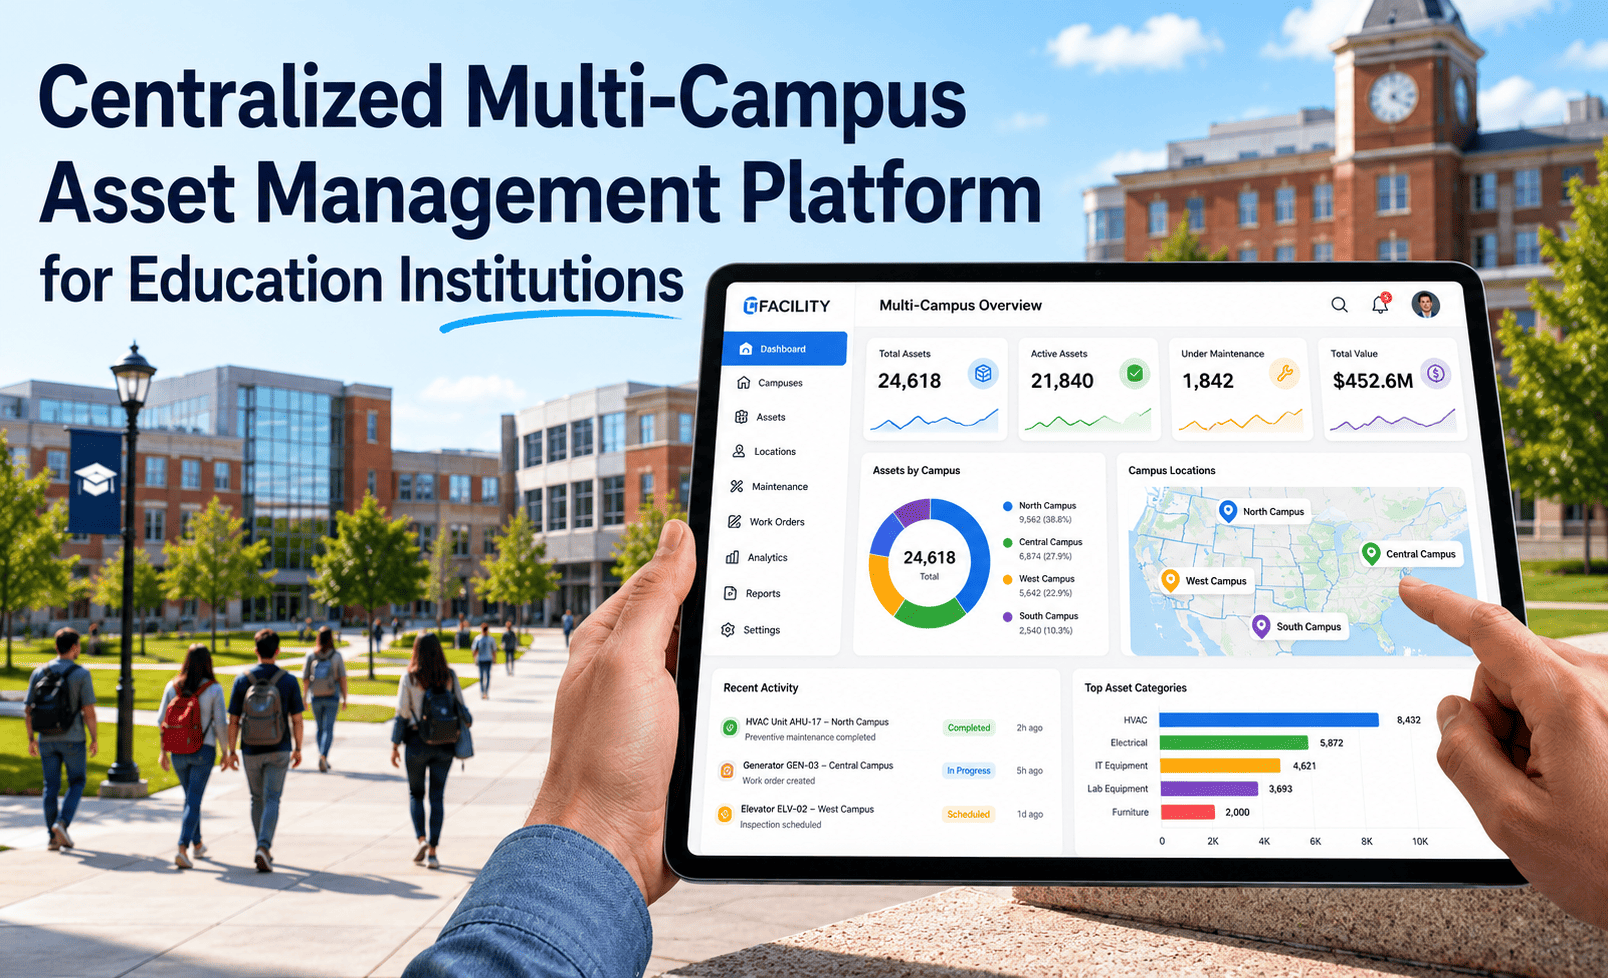
Paper-era schools accumulate separate systems for attendance, grades, facilities, finance, and HR that never communicate. A student's chronic absenteeism pattern, housing instability indicator, and cafeteria participation trend each exist in separate records and no staff member sees all three simultaneously to trigger a coordinated intervention.
Paper gradebooks and manual assessment records make trend analysis across cohorts, classrooms, or programs practically impossible without dedicated analyst time. Curriculum effectiveness, teacher performance patterns, and program ROI remain invisible, meaning resource allocation decisions are made on intuition rather than evidence at every planning cycle.
Without continuous data integration, student support teams operate reactively, responding to crises after they escalate rather than identifying risk patterns early. Early warning systems require the multi-source data integration that paper logs structurally cannot provide, meaning at-risk students are identified weeks or months later than AI-enabled institutions.
How AI Analytics Replaces Each Paper System Layer
AI school analytics platforms do not simply digitize existing paper workflows. They replace the underlying data architecture, shifting from periodic manual recording to continuous automated capture, from siloed department files to unified cross-system visibility, and from reactive reporting to predictive alerting. Book a Demo to see how the platform maps to your institution's specific system landscape.
- Attendance captured automatically from access systems, device logins, and SIS integrations without teacher data entry
- AI identifies chronic absenteeism patterns before they reach reportable thresholds, enabling 3-4 week earlier intervention
- IDEA and state compliance attendance documentation generated automatically without manual assembly per reporting cycle
- Early warning alerts routed directly to assigned counselors with student history and recommended action attached
- LMS integration feeds assessment data into AI performance models in real time without additional teacher entry burden
- Learning gap identification per student across subjects automated and surfaced to teachers as actionable weekly reports
- Cohort and classroom performance benchmarking automated against district and peer institution standards continuously
- Intervention recommendations generated before grade failure occurs rather than at semester-end review cycles
- IoT sensor feeds replace manual inspection recording for HVAC, electrical, and plumbing systems campus-wide
- AI deterioration models predict equipment failures weeks before physical symptoms appear in any building
- OSHA 2026 Heat Illness Prevention documentation produced automatically from continuous temperature sensor data
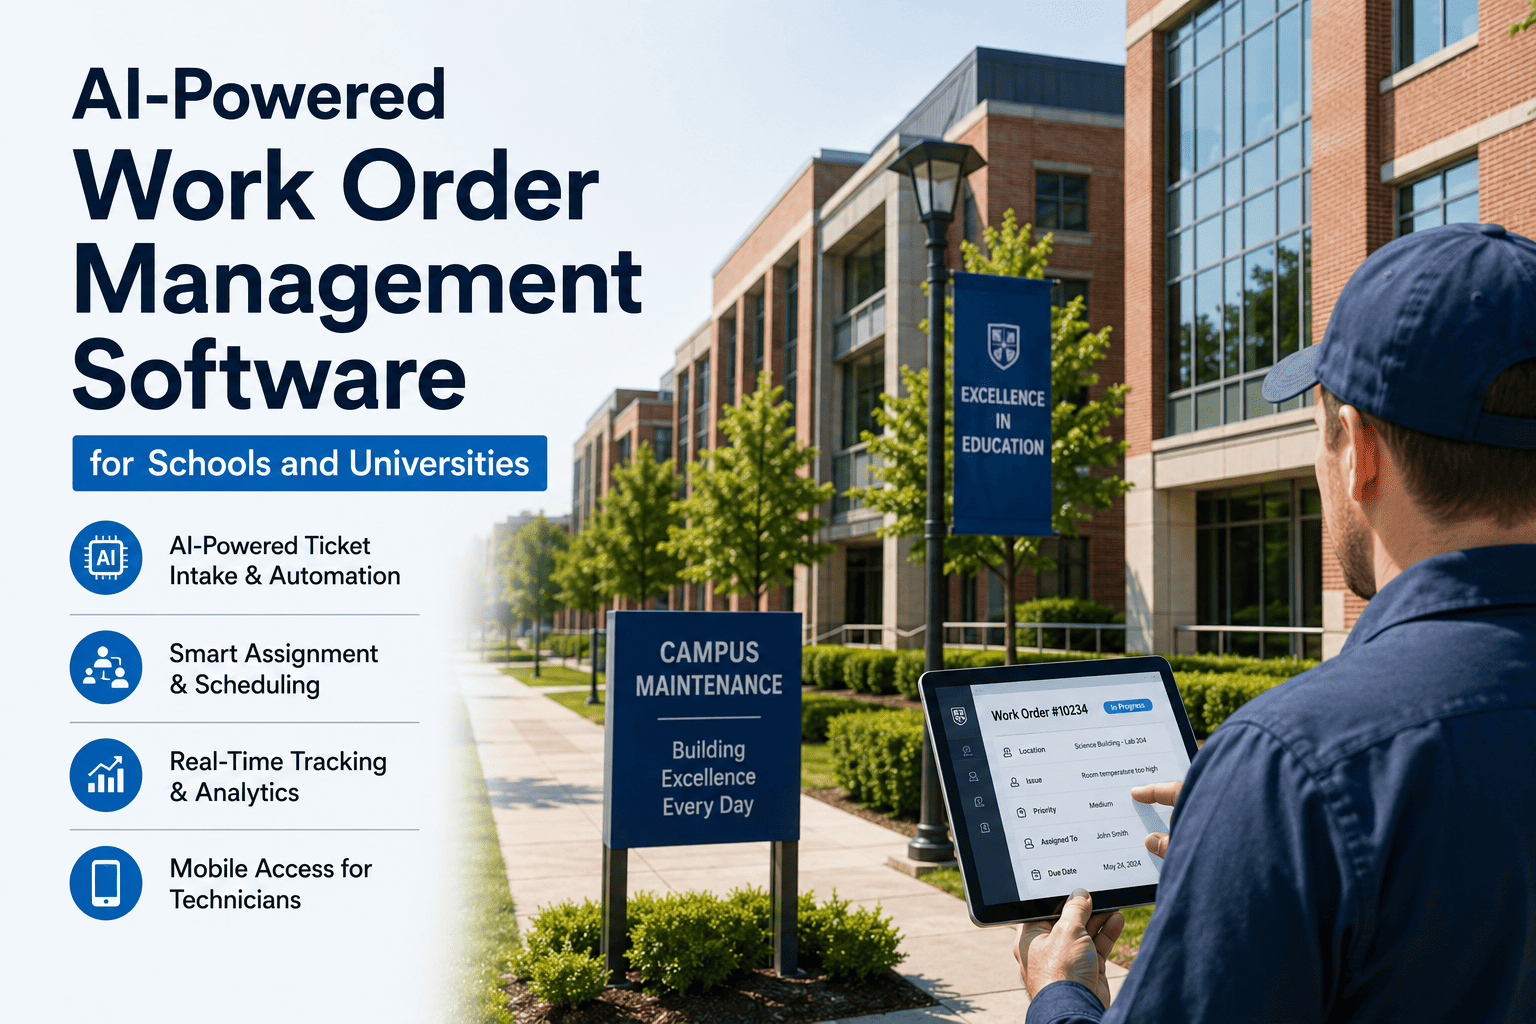
- Work orders generated and dispatched automatically without facilities staff scheduling or manual intervention required
- FERPA, IDEA, Title IX, and accreditation documentation generated from live data streams without manual staff assembly
- Audit packages assembled and exported on demand with zero manual document gathering required per audit cycle
- Corrective action tracking with automated verification confirmation when each compliance requirement is fulfilled
- Documented deployments achieve zero audit deficiencies across all compliance frameworks in the same audit cycle
- ERP integration consolidates budget, expenditure, and enrollment data into unified real-time financial dashboards
- Per-program cost-efficiency analysis automated without finance staff spending hours on data assembly tasks
- Enrollment trend forecasting informs staffing and resource allocation planning 12-18 months in advance accurately
- Board-ready financial presentations generated from live data with one-click export in multiple required formats
- Access control and security system data integrated for real-time campus safety monitoring without manual logging
- Clery Act and Title IX incident documentation automated directly from security system event feeds
- Pattern analysis identifies campus safety risk areas before incidents escalate to reportable thresholds
- Emergency notification integration with automated response protocol documentation and audit trail generation
Digital Transformation Timeline: Four Phases From Paper to AI
The transition from paper-based school administration to an AI analytics platform follows a structured four-phase sequence that delivers measurable outcomes at each milestone. The program operates within existing budgets. Service delivery is uninterrupted throughout all phases. Core integration and initial AI dashboards are operational within 45-75 days of deployment commencement.
- All existing SIS, LMS, ERP, and facility sensor systems connected to the unified platform via open API
- Asset and student data registry built from connected system inventory and historical records
- Initial AI baseline dashboards operational for all connected data sources by week eight
- All administrative staff onboarded and operational in under 12 hours total training time
- AI student outcome prediction model active across all connected academic data sources
- Automated attendance analytics and early warning alerts operational institution-wide
- Emergency and reactive administrative workload declining as automated workflows replace manual dispatch
- Compliance documentation automation live for FERPA, IDEA, and state reporting requirements
- Financial analytics dashboard live with per-program cost scoring from continuous data integration
- Full compliance documentation automated for OSHA, EPA, NFPA, Title IX, and ADA requirements
- First board-ready capital and academic performance presentation produced from live AI-informed data
- Corrective action tracking and verification fully automated across all buildings and programs
- 40-60% administrative workload reduction fully documented and verified against pre-deployment baseline
- Zero audit deficiencies across all compliance categories simultaneously for first full audit cycle
- Student outcome prediction accuracy at full maturity with 12-plus months of campus-specific data accumulated
- AI model sharpens continuously as campus-specific academic and operational data accumulates month over month
Documented Digital Transformation Outcomes
The results below are drawn from documented K-12 and university deployments of integrated AI analytics platforms measured against pre-deployment paper-based baselines on existing operational budgets. No additional headcount was added to achieve these outcomes. Book a Demo to see how these results translate to your institution's portfolio and existing infrastructure.
| Analytics Transformation Metric | Before Deployment | After 12 Months | Change |
|---|---|---|---|
| Admin Hours Per Compliance Cycle | 140-180 hours | 18-22 hours | -87% |
| At-Risk Student Detection Speed | 4-6 weeks lag | Real-time flags | -85% |
| Audit Deficiencies Per Cycle | Multiple findings | Zero documented | -100% |
| Emergency Work Orders | 60-75% of budget | 60-75% fewer | -60% to -75% |
| Compliance Reporting Accuracy | Manual, error-prone | Automated, verified | +100% |
| Capital Project Cost Variance | 22% average overage | 6% average | -73% |
| Documentation Maturity Score | 41 out of 100 | 79 out of 100 | +38 pts |
| Board Presentation Approval Rate | Deferred for more data | Single-session approval | Significant |
| Peer Institution Ranking | Bottom 22% | Top 40% | +18 percentile pts |
Key Benefits of AI-Driven School Analytics
AI-automated documentation assembly and workflow dispatch converts manual administrative effort into automated output without additional headcount. Staff time reclaimed from paper-based reporting redirects to student-facing and instructional support work. The savings compound annually as the model accumulates more institution-specific data and improves processing accuracy each month of operation.
Continuous multi-source data integration enables AI models to identify attendance, academic, and behavioral risk signals weeks before paper-based systems would surface them. Counselor alerts are generated automatically with student history and recommended intervention attached, eliminating the manual pattern-recognition burden that systematically delayed early support in paper systems across all prior reporting cycles.
Automated compliance documentation from continuous data eliminates every finding category. FERPA, IDEA, Title IX, OSHA 2026, EPA, NFPA, and Clery Act records are all produced automatically without manual assembly, delivering zero deficiencies across all frameworks in the same audit cycle. Documentation maturity scores improve from the 40s to the high 70s within the first year of deployment.
Facility Condition Index data from continuous IoT monitoring replaces stale spreadsheet estimates in capital requests. Five-year cost-of-deferral analysis and multi-year scenarios modeled on live condition data produce capital presentations that boards approve in single sessions rather than deferring for additional data. Capital project cost variance drops from 22% to 6% average on IoT-informed scoping across all documented deployments.
Open API integration connects existing student information systems, learning management systems, ERP platforms, and sensor networks to the unified AI analytics layer without replacing any current system. Data from 11 or more separate source systems is consolidated automatically. Core integration is operational within 45-75 days, and existing data coverage is supplemented only where gaps are identified during the initial registry build process.
Each month of platform operation adds institution-specific data that improves prediction accuracy for your students and buildings specifically. Seasonal academic patterns, equipment behavior under local conditions, and building-specific usage cycles all inform increasingly precise maintenance and intervention scheduling. The documented outcomes at month 12 are a floor and not a ceiling. The ROI trajectory is consistently upward throughout the platform lifecycle.