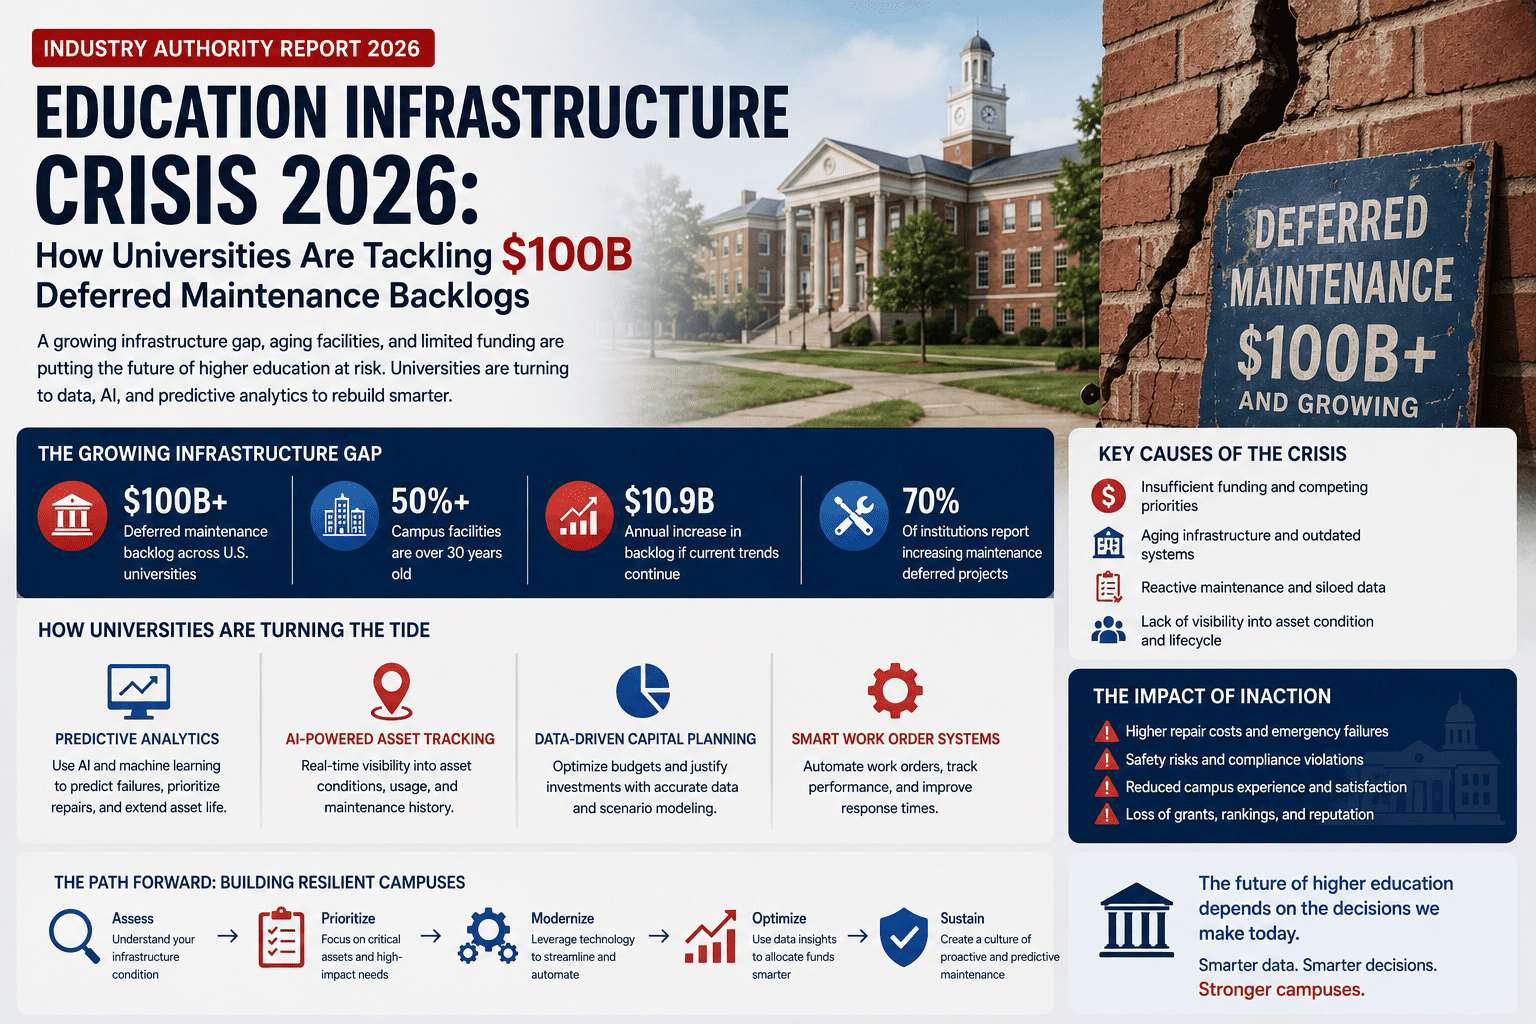
Universities across the United States are confronting a structural crisis that has been building for decades. Deferred maintenance backlogs on campuses have now crossed the $100 billion threshold nationally, with the average research university carrying $300 million to $900 million in unfunded facility obligations. In 2026, tightening federal budgets, enrollment pressures, and aging building stock have converged to make this the defining operational challenge for higher education leadership. Institutions that continue managing infrastructure through spreadsheets and reactive work orders are accelerating the cost curve against themselves. The universities resolving this crisis fastest share one operational shift: AI-powered predictive analytics replacing manual facility tracking with continuous, data-driven capital intelligence. Book a Demo to see how your institution can build a defensible capital strategy from live facility data.
The Scale of the 2026 University Infrastructure Crisis
The $100 billion deferred maintenance figure is not a projection. It is the current documented liability sitting on university balance sheets across the country, calculated from facility condition assessments, aging infrastructure inventories, and capital planning reports submitted to state legislatures and accreditation bodies. The number has grown by an estimated 18 to 22 percent over the past five years as capital replacement funding has consistently fallen short of annual deterioration rates at most institutions.
What makes 2026 a critical inflection point is the convergence of three accelerating pressures. First, federal infrastructure funding from prior stimulus cycles is expiring, removing a temporary buffer that allowed some institutions to defer the reckoning. Second, deferred systems are now reaching end-of-life simultaneously across campuses built in the 1960s and 1970s infrastructure boom, creating clustered failure risk. Third, enrollment declines at regional universities are compressing the per-student revenue base that funds capital reserves, making the math of catch-up investment harder to close. Book a Demo to assess your institution's current backlog exposure and capital planning maturity.
Why Deferred Maintenance Backlogs Keep Growing Despite Investment
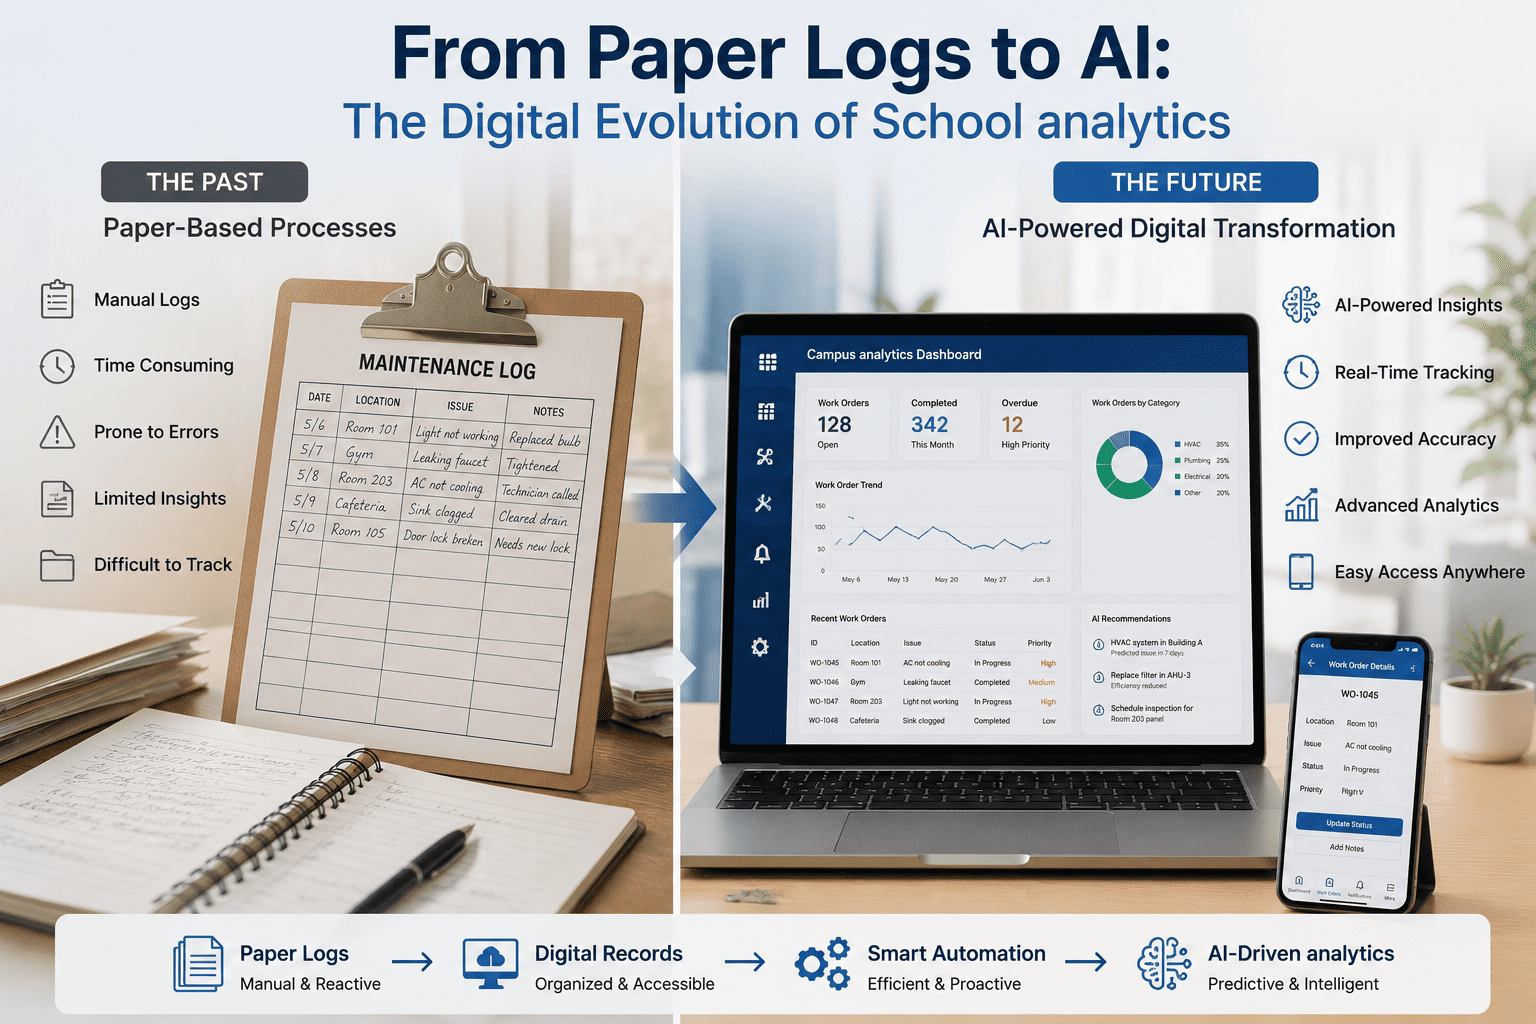
The persistent growth of deferred maintenance backlogs is not primarily a funding problem. It is a data problem. Universities that invest in capital renewal without accurate facility condition data systematically allocate to the wrong assets, fund visible deterioration over structural risk, and miss the intervention windows where planned maintenance prevents the 3x to 5x cost multiplier of emergency replacement. The result is that each dollar of capital investment produces less backlog reduction than it should, while the overall liability continues compounding.
Most universities conduct comprehensive facility condition assessments every 5 to 10 years. The data that drives capital decisions is therefore years out of date, systematically missing deterioration that has occurred since the last walkthrough and mispricing the actual intervention cost at current labor and material rates.
Without predictive failure data, facilities teams operate in reactive mode, responding to breakdowns rather than preventing them. Emergency work orders cost 3x to 5x more than planned interventions for the same scope, and 60 to 75 percent of total maintenance budgets at paper-managed institutions are consumed by reactive response rather than planned capital renewal.
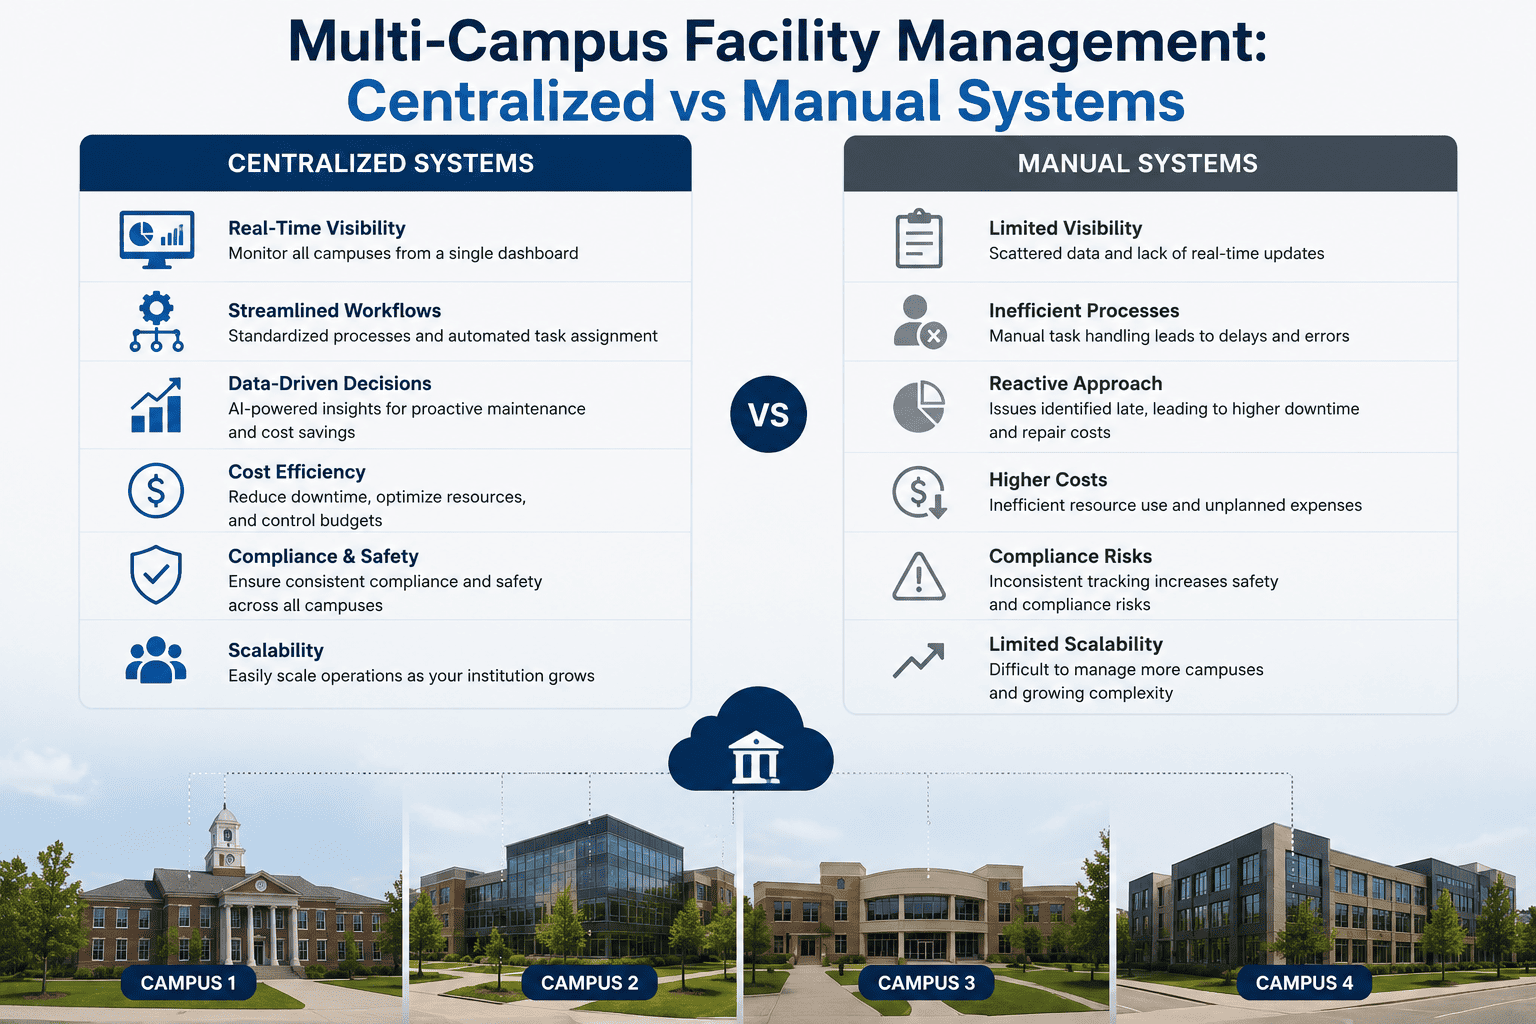
Campus facilities data exists across CMMS platforms, spreadsheets, paper logs, and departmental databases that never communicate. No single view of total asset condition exists, making cross-building prioritization and portfolio-level capital planning practically impossible without dedicated analyst hours that most facilities teams do not have.
Every deferred maintenance item has an optimal intervention window where the cost of repair is a fraction of eventual replacement cost. Manual inspection cycles miss these windows systematically because deterioration progresses between scheduled walkthroughs. AI continuous monitoring keeps the window visible and generates work orders while repair is still cost-effective.
Deferred maintenance items frequently overlap with regulatory compliance requirements under OSHA, EPA, NFPA, and ADA. Each year of deferral increases both the remediation cost and the regulatory exposure window. Institutions without automated compliance tracking are accumulating undocumented liability alongside their physical backlog, compounding the total risk position without visibility.
Capital requests built on stale FCI data and manual cost estimates are routinely deferred by boards requesting additional documentation, updated condition evidence, or revised cost modeling. These approval delays add 6 to 18 months to project timelines, during which deferred items deteriorate further and cost estimates become outdated again, restarting the cycle.
How AI-Powered Analytics Directly Addresses the Backlog Crisis
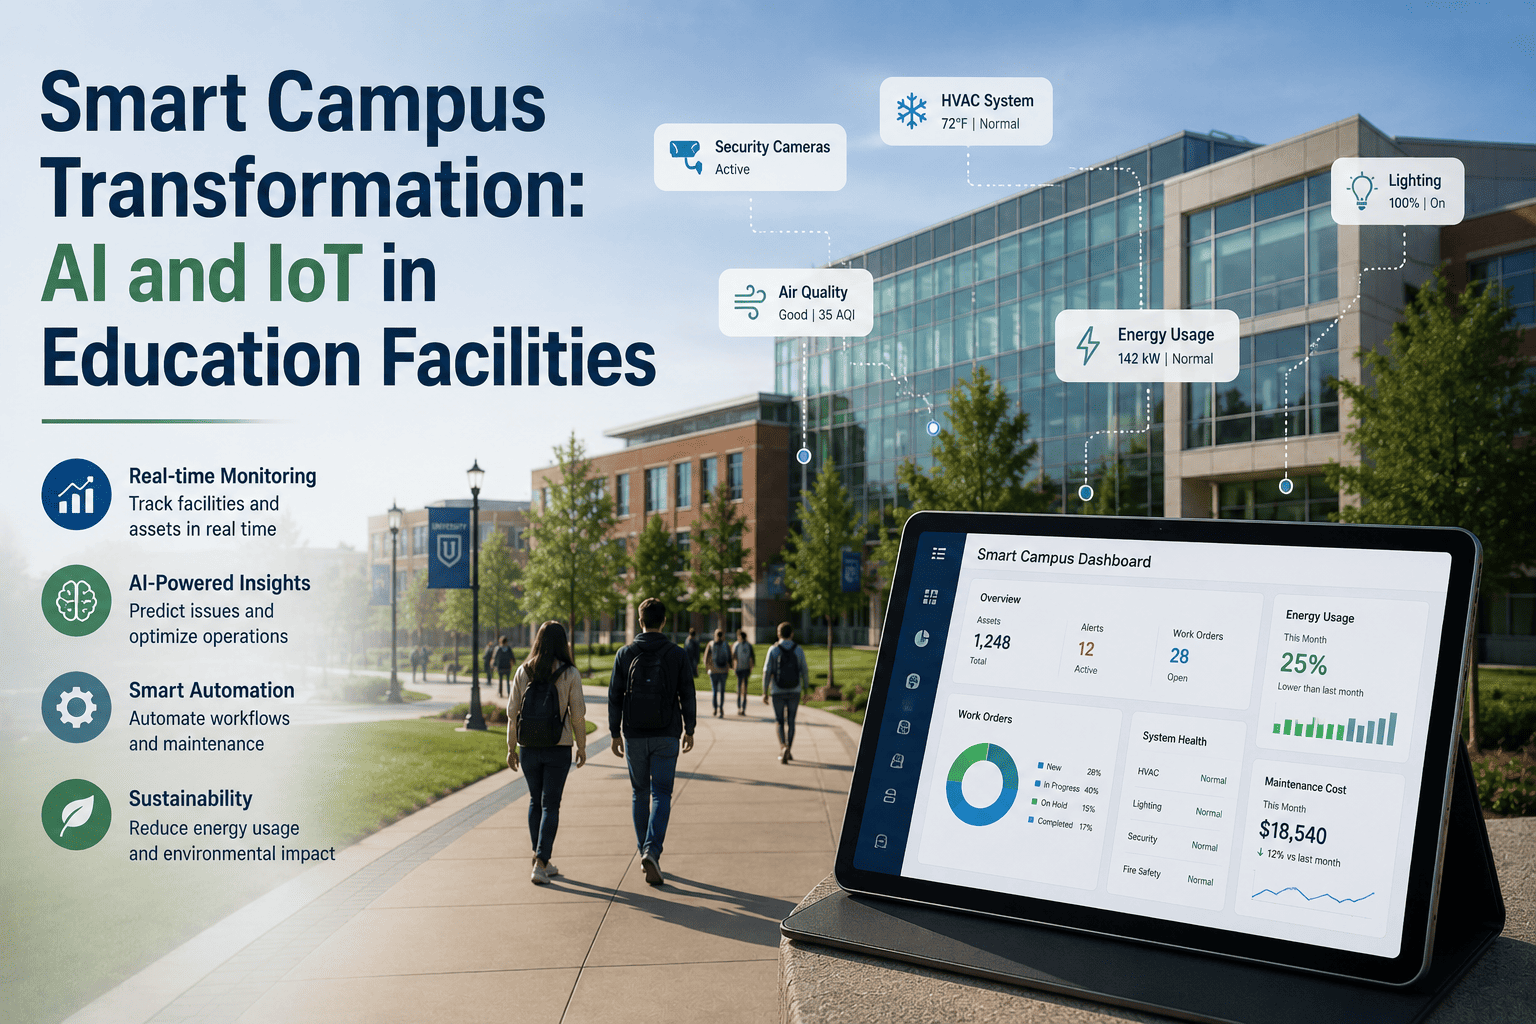
AI facility analytics platforms do not simply digitize existing maintenance workflows. They replace the underlying data architecture that makes deferred maintenance backlogs grow: infrequent manual inspection replaced by continuous IoT monitoring, fragmented asset records replaced by unified condition scoring, reactive dispatch replaced by predictive work order generation, and stale capital estimates replaced by live FCI data that boards actually approve. Book a Demo to see how the platform maps to your campus infrastructure portfolio.
- Sensor networks replace manual inspection cycles for HVAC, electrical, plumbing, and building envelope systems across all campus buildings simultaneously
- AI deterioration models identify failure trajectories weeks before physical symptoms appear, converting emergency replacements into planned interventions at a fraction of the cost
- Real-time FCI scores replace 5-year assessment snapshots with daily condition data that reflects actual current asset status across the entire portfolio
- Anomaly detection alerts automatically routed to assigned facilities staff with asset history, recommended action, and cost comparison between repair and replacement
- Multi-variable scoring ranks every deferred item by failure probability, cost-of-deferral trajectory, compliance risk, and academic mission impact simultaneously
- Five-year capital scenarios modeled automatically from live condition data, enabling boards to compare investment strategies with current cost and risk projections
- Per-building and per-system backlog quantification with confidence intervals replacing manual estimate ranges that boards consistently challenge for additional data
- Enrollment, research grant, and revenue context layered onto facility condition scoring to prioritize capital where academic mission impact is highest
- OSHA 2026 Heat Illness Prevention documentation produced automatically from continuous temperature sensor feeds across all campus buildings without staff assembly
- EPA indoor air quality, NFPA fire safety inspection records, and ADA compliance tracking all automated from connected system data and sensor inputs
- Audit packages assembled and exported on demand with complete evidence trails, corrective action records, and verification timestamps per regulatory requirement
- Corrective action tracking with automated closure verification so no open compliance item reaches audit without documented resolution status
- Capital presentations generated from live FCI and cost data with one-click export in board-required formats, replacing weeks of manual report assembly per budget cycle
- Scenario modeling shows cost of continued deferral against investment options with five-year cash flow projections that boards can interrogate rather than defer for more data
- Peer institution benchmarking integrated automatically so trustees can evaluate capital position against comparable universities without additional analyst work
- Single-session board approval rates documented at institutions replacing stale spreadsheet capital requests with live AI-informed data presentations
- Open API connects to all major CMMS, ERP, and SIS platforms without replacing existing systems, consolidating data from 11 or more source systems into a unified analytics layer
- Historical work order data, prior assessment records, and capital project histories ingested and used to sharpen AI deterioration models from day one of deployment
- Core integration operational within 45 to 75 days with no disruption to existing facilities workflows or staff operations during the transition period
- Sensor network deployment scoped to identified data gaps only, supplementing existing system coverage rather than requiring full campus infrastructure replacement
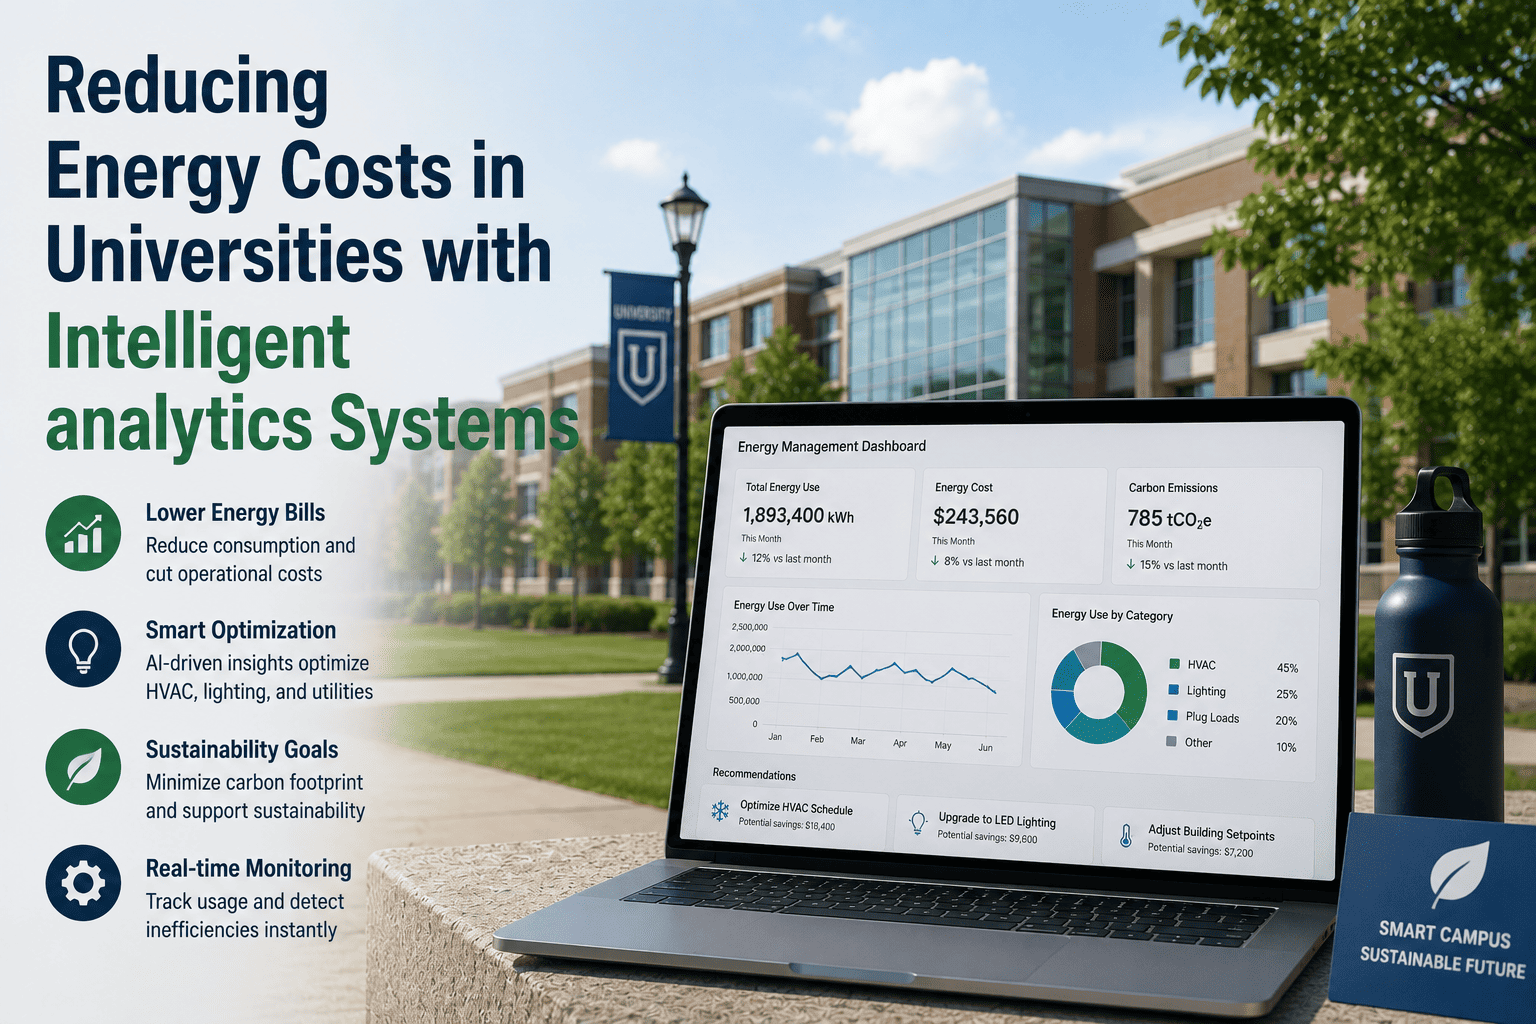
- Energy consumption monitoring per building integrated with facility condition data to identify inefficiency driven by aging or failing HVAC, insulation, and electrical systems
- Carbon footprint tracking against campus sustainability commitments with automatic reporting for EPA and state environmental compliance requirements annually
- Retrofit ROI modeling combines energy savings projections with deferred maintenance cost avoidance to build the full financial case for building envelope investments
- Green building certification documentation automated for LEED, ENERGY STAR, and state sustainability reporting frameworks from continuous sensor and utility data feeds
The Four-Phase Backlog Reduction Roadmap
Institutions addressing deferred maintenance backlogs with AI analytics follow a structured four-phase sequence that delivers measurable capital planning improvements at every milestone. All phases operate within existing budget frameworks. Core integration is live within 45 to 75 days. No existing system replacement is required at any phase.
- All CMMS, ERP, and facility sensor systems connected to the unified analytics platform via open API without system replacement
- Complete campus asset registry built from connected system inventory, historical work order data, and prior assessment records
- Initial AI facility condition dashboards operational across all connected buildings by week eight
- Facilities staff fully onboarded in under 12 hours total training with no disruption to ongoing operations
- AI deterioration models active across all connected building systems with real-time failure probability scoring per asset
- Complete deferred maintenance backlog quantified by building, system, and regulatory risk category with current cost estimates
- Emergency work order volume declining as predictive alerts convert reactive failures into planned interventions
- OSHA, EPA, and NFPA compliance documentation automation live across all monitored buildings and systems
- Five-year capital scenarios modeled from live FCI data with cost-of-deferral analysis per investment option
- Full compliance documentation automated for all regulatory frameworks with audit packages available on demand
- First board capital presentation produced from live AI-informed data, approved in single session
- Peer institution benchmarking integrated and capital position ranked against comparable university portfolios
- 60 to 75 percent reduction in emergency work orders documented and verified against pre-deployment baseline
- Zero audit deficiencies across OSHA, EPA, NFPA, and ADA compliance categories for first full audit cycle
- Capital project cost variance reduced from 22 percent average to 6 percent average on IoT-informed project scoping
- AI model prediction accuracy improving continuously as campus-specific asset history accumulates each month
Documented Outcomes at Universities Deploying AI Facility Analytics
The results below reflect documented deployments at universities and multi-campus systems measured against pre-deployment baselines on existing operational budgets. No additional facilities headcount was added to achieve these outcomes. Book a Demo to see how these results apply to your institution's portfolio and current backlog position.
| Facility Analytics Outcome Metric | Before Deployment | After 12 Months | Change |
|---|---|---|---|
| Emergency Work Order Volume | 60-75% of budget | 60-75% fewer orders | -60% to -75% |
| Reactive vs. Planned Maintenance Mix | 31% planned spend | 91% planned spend | +60 pts |
| Capital Project Cost Variance | 22% average overage | 6% average overage | -73% |
| Compliance Audit Deficiencies | Multiple findings | Zero documented | -100% |
| Documentation Maturity Score | 41 out of 100 | 79 out of 100 | +38 pts |
| FCI Score (0 = poor, 1 = excellent) | 0.42 average | 0.61 average | +0.19 pts |
| Board Capital Approval Cycle | Deferred 2-3 cycles | Single-session approval | Significant |
| Peer Institution Ranking | Bottom 22% | Top 40% | +18 percentile pts |
| Admin Hours Per Compliance Cycle | 140-180 hours | 18-22 hours | -87% |
| Corrective Action Closure Speed | At or past deadline | Month 10 vs. 18-month deadline | 8 months early |
Key Benefits for Universities Tackling Infrastructure Backlogs
Predictive failure detection converts emergency replacements into planned interventions at a fraction of the cost. The documented 22-percentage-point shift from reactive to planned maintenance spend accounts for over $600,000 in annualized savings per deployment without adding facilities headcount or increasing capital allocation.
Live IoT condition data produces project scope definitions that reflect actual current asset state rather than inspection-era estimates. Eliminating scope surprises removes the mid-project funding requests that damage board confidence in facilities leadership and derail multi-year capital programs before they reach completion.
Automated compliance documentation from continuous data eliminates every finding category that manual systems produce systematically. OSHA, EPA, NFPA, ADA, and state accreditation records are all produced automatically, delivering zero deficiencies across all frameworks in the same audit cycle with documentation maturity scores improving from 41 to 79 out of 100.
Capital requests built from live condition data, cost-of-deferral analysis, and peer benchmarking answer the questions that drove prior board deferrals. Single-session approval rates are documented across all recorded deployments, converting the capital approval cycle from a recurring obstacle into a reliable planning milestone for facilities leadership.
Open API integration consolidates data from all major CMMS, ERP, and facility sensor platforms into the unified analytics layer without replacing any current system. Core integration is operational within 45 to 75 days, and all facilities staff are fully onboarded in under 12 hours total training time with no interruption to ongoing operations.
Each month of operation adds institution-specific failure history, seasonal patterns, and equipment behavior data that sharpens prediction accuracy for your buildings specifically. Deterioration models calibrated to your campus produce more precise intervention windows than generic benchmarks, and the documented ROI at month 12 is a floor not a ceiling throughout the platform lifecycle.