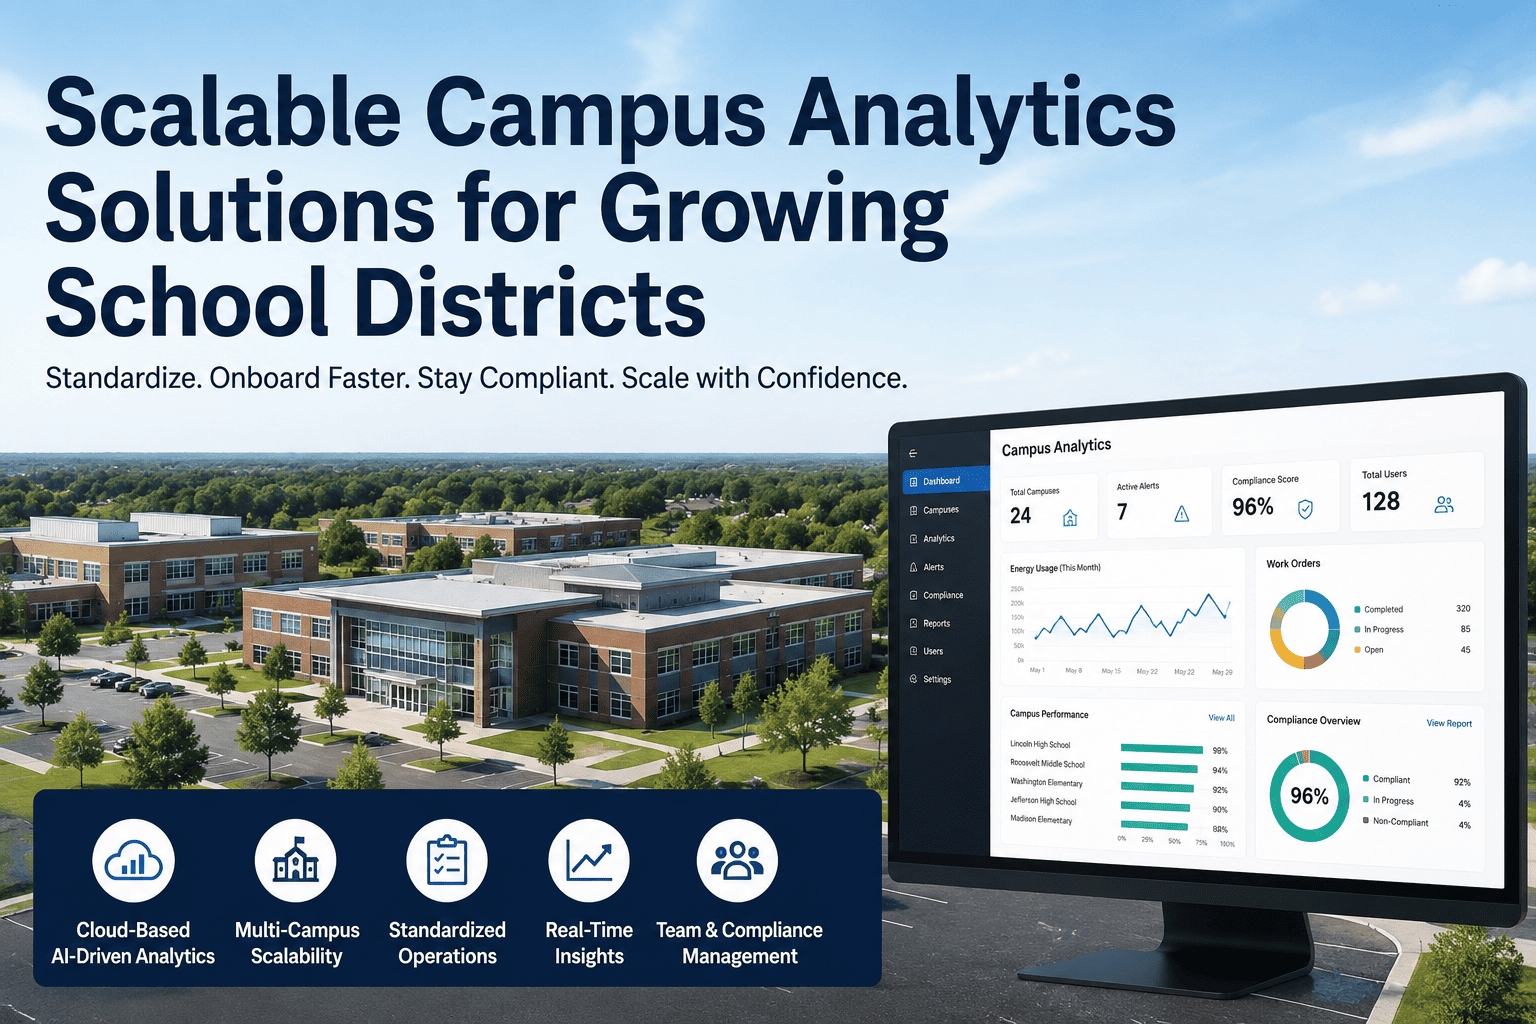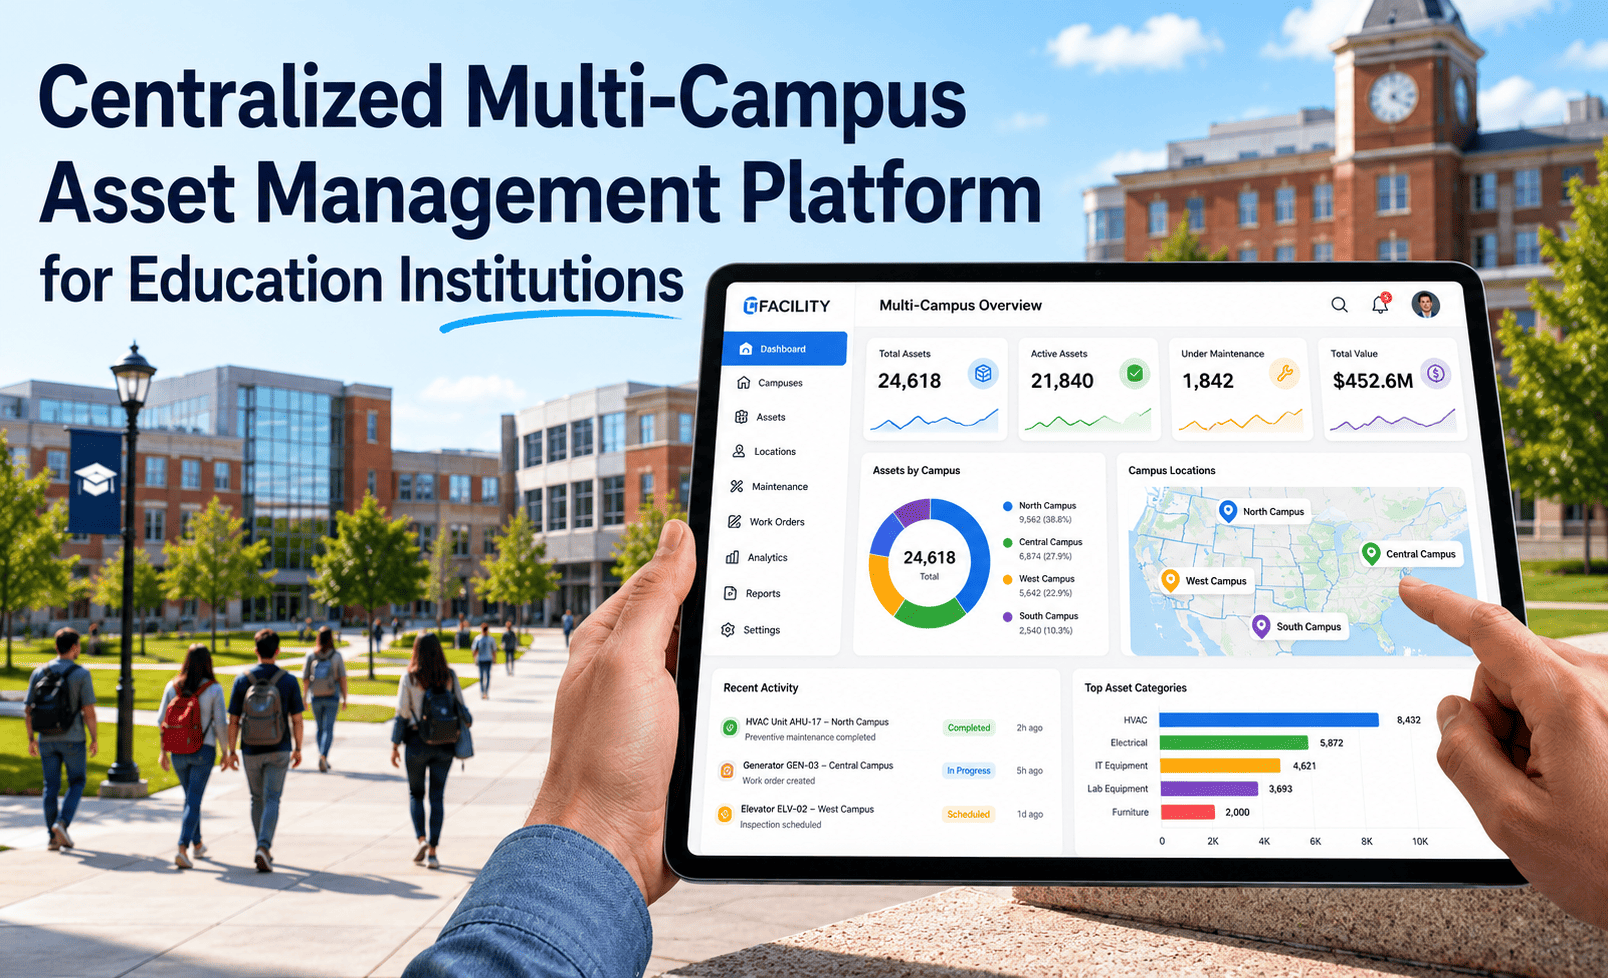
Managing facility operations across multiple campuses under a single institution is one of the most operationally demanding responsibilities in education administration. A university system running five campuses or a K-12 district managing thirty school buildings faces the same core problem: maintenance decisions, compliance documentation, energy performance, and capital planning data are distributed across disconnected systems, managed by separate teams, and reported through processes that produce information weeks or months after the conditions they describe have already changed. Manual multi-campus management does not scale. It produces chronic information gaps, inconsistent compliance posture across locations, and capital budgets built on stale condition estimates that routinely generate cost overruns. Centralized AI-driven facility management platforms eliminate these gaps by unifying data from every campus into a single analytics layer that produces real-time condition scores, automated compliance documentation, and portfolio-level capital planning from live asset data. Institutions that have made this transition report 18-30% maintenance cost reductions, 60-75% fewer emergency work orders, and zero audit deficiencies across all compliance categories simultaneously. Book a Demo to see how centralized AI-driven management maps to your multi-campus portfolio.
Why Multi-Campus Management Fails Under Manual Systems
Manual facility management works tolerably for a single-campus institution where one facilities director can maintain situational awareness across a bounded building portfolio through regular walk-throughs, staff conversations, and periodic inspection reports. The model breaks down structurally when applied to multi-campus operations. Each additional campus multiplies the information gap rather than adding linearly to the management burden. Condition data from campus three cannot be compared to campus one when it was collected six weeks earlier by a different inspector using a different rating framework. Compliance documentation from distributed locations arrives at the central office in inconsistent formats and at unpredictable intervals. Capital planning for the portfolio requires assembling stale data from multiple sources that were never designed to be aggregated.
The operational consequences are predictable and documented across university systems and K-12 districts operating at multi-campus scale. Emergency maintenance events spike because no system identifies deteriorating conditions campus-wide before failure. Compliance deficiencies concentrate in locations farthest from the central facilities office. Capital projects generate chronic cost overruns because condition estimates used for scoping are months or years out of date by the time construction begins. Centralized AI-driven management addresses all three failure modes with a single platform that unifies data from every campus in real time.
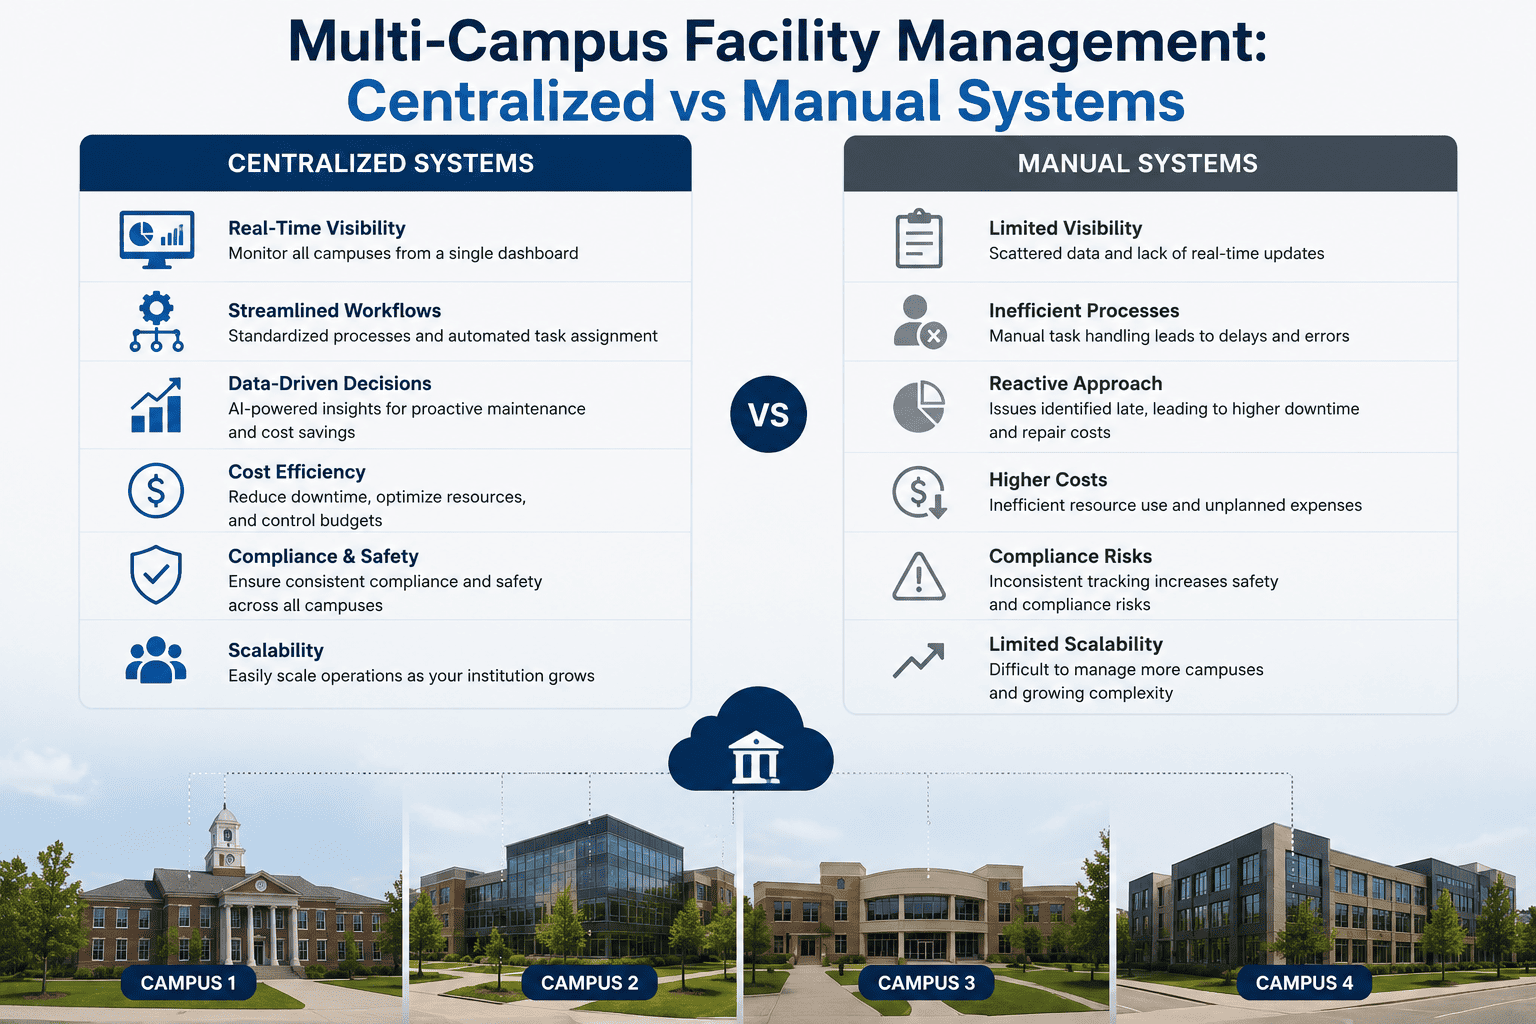
Direct Comparison: Centralized AI-Driven vs Manual Multi-Campus Management
The comparison below covers every primary operational domain of multi-campus facility management. Each category reflects documented performance differences between institutions operating centralized AI-driven platforms and those managing the same building types through traditional manual processes at comparable portfolio scale. Book a Demo to map this comparison directly to your institution's current operational model.
| Management Domain | Manual Multi-Campus | Centralized AI-Driven |
|---|---|---|
| Asset Condition Data | 18-26 months average data age. Condition known only at inspection, unknown between cycles. No cross-campus consistency. | Under 30 days average. Continuous IoT-informed scoring for every monitored asset across all campuses simultaneously. |
| Maintenance Scheduling | Reactive dispatch from complaint and failure. Emergency events consume 60-75% of maintenance budget. No predictive capability. | AI deterioration modeling schedules work orders before failure. Emergency share drops from 31% to 9% of total spend. |
| Cross-Campus Visibility | No unified view. Each campus reported separately on different schedules. Portfolio condition unknown without manual assembly. | Single dashboard with real-time condition, maintenance status, energy, and compliance data for every campus simultaneously. |
| Compliance Documentation | Manual assembly per campus. Approximately 140 hours per audit cycle. High deficiency rate at locations distant from central office. | Automated from live IoT and maintenance data. Approximately 18 hours per cycle. Zero deficiencies across all campuses documented. |
| Capital Planning Accuracy | Stale condition estimates. 22% average project cost variance. Capital presentations deferred for additional data frequently. | Live FCI per campus from continuous IoT data. Capital variance drops to 6%. Board approvals in single sessions. |
| Energy Management | Fixed-schedule programming campus-wide. No per-building consumption visibility. Energy anomalies invisible until failure. | Occupancy-driven optimization per campus. 15-19% cost reduction. Per-building benchmarking identifies outliers automatically. |
| Staff Accountability | Planned-to-reactive ratio untracked. No department-level performance data. Accountability limited to complaints received. | Real-time planned-to-reactive ratio per campus and department. Performance benchmarking across all locations. |
| Emergency Response | No early warning system. Failures discovered at complaint or visible breakdown. Emergency costs 3-5x planned maintenance. | IoT anomaly detection flags deterioration weeks before failure. 60-75% fewer emergency work orders documented. |
| Reporting to Leadership | Manual compilation from distributed systems. Data inconsistent across campuses. Reports reflect conditions weeks or months prior. | Board-ready and credit-agency-ready documentation exported on demand from live data. No manual assembly required. |
| System Integration | 11 or more disconnected systems per campus. No data sharing between BAS, CMMS, ERP, and energy systems. | All systems connected via open API into unified analytics platform. No replacement of existing systems required. |
Where Manual Multi-Campus Systems Break Down Specifically
Every multi-campus institution operating through manual processes experiences the same failure categories at predictable points in portfolio growth. Understanding where these breakdowns occur explains why incremental improvements to manual systems do not resolve the underlying problem and why centralized platform deployment produces documented results rather than marginal gains.
Inspection reports from five campuses collected over three months by different staff using different rating scales cannot be aggregated into a reliable portfolio condition score. The data is incompatible, stale, and inconsistently detailed. Capital planning built on this input produces estimates with 22% average cost variance because the scoping assumptions do not reflect actual current conditions at any location.
OSHA, EPA, NFPA, and ADA documentation requirements apply equally to every campus location regardless of distance from the central facilities office. Manual compliance processes produce coverage that degrades with distance. Campus locations that receive fewer central office visits accumulate documentation gaps that only surface at audit, by which time corrective action is reactive rather than preventive and formal findings are already recorded.
Without predictive maintenance capability across all campus locations, equipment failures at any site produce emergency work orders at 3-5 times the cost of equivalent planned interventions. At multi-campus scale this multiplier applies to every location simultaneously, converting 60-75% of the total maintenance budget into reactive spending that leaves no capacity for preventive programs that would reduce future emergency frequency.
Multi-campus institutions receiving consolidated utility bills have no visibility into which specific buildings or campuses are driving consumption above benchmark. Fixed-schedule HVAC programming applied uniformly across locations conditions empty spaces at every campus simultaneously. Without per-building energy data, efficiency interventions cannot be targeted, and maintenance failures driving excess consumption remain invisible until they produce equipment failures.
Manual multi-campus management cannot measure planned-to-reactive maintenance ratios per campus or per department because the data required for that calculation is distributed across disconnected work order systems, verbal reporting, and inspection logs that are never aggregated. Without measurement, accountability is complaint-driven rather than performance-driven, and chronic underperformance at specific locations is invisible until it produces a facility failure or compliance finding.
Preparing portfolio-level capital presentations for board approval under manual multi-campus management requires assembling condition estimates from multiple campuses that were collected at different times, by different inspectors, using different methodologies. The resulting document presents a composite of stale data that board members correctly question. Requests for additional information before approval delay capital authorizations by one to three cycles, deferring maintenance that compounds the underlying condition deterioration.
How Centralized AI-Driven Management Resolves Each Failure Mode
Centralized AI-driven facility management platforms are not improved versions of manual systems. They operate from a fundamentally different information architecture in which every campus feeds continuous real-time data into a unified analytics layer that produces condition scores, maintenance schedules, compliance documentation, and capital planning outputs automatically. The six resolution mechanisms below correspond directly to the six manual failure modes described above.
- IoT sensors and BAS feeds produce continuous condition data from every campus on a consistent methodology
- Asset condition scores updated under 30 days average across all monitored assets portfolio-wide
- Cross-campus condition benchmarking identifies which locations need capital investment first
- Capital project scoping uses live condition data, reducing cost variance from 22% to 6% average
- OSHA, EPA, NFPA, and ADA documentation generated from live IoT and maintenance data at every campus
- Distance from central office has zero effect on compliance coverage quality or completeness
- Corrective action tracking and verification fully automated across all locations simultaneously
- Documented deployments achieve zero deficiencies across all compliance categories in same audit cycle
- AI deterioration modeling identifies failing assets at every campus weeks before catastrophic failure
- Automated work orders route to correct technician or contractor across all locations without manual dispatch
- Emergency work order volume reduced 60-75% as planned maintenance replaces reactive dispatch
- Reactive share of maintenance spend drops from 31% to 9% of total budget within 18 months
- Occupancy-driven HVAC and lighting optimization active at every campus through unified platform
- Per-building energy use intensity calculated in real time across all locations simultaneously
- Highest-consuming buildings at any campus ranked automatically for targeted maintenance intervention
- 15-19% portfolio-level energy cost reduction documented across multi-campus deployments at 18 months
- Planned-to-reactive maintenance ratio tracked per campus and department in real time
- Performance benchmarking across all locations identifies underperforming campuses before failures occur
- Staff accountability shifts from complaint-driven to data-driven with consistent metrics across all sites
- Portfolio performance dashboard available to central facilities director and institutional leadership continuously
- Portfolio FCI from continuous IoT-informed condition scores replaces stale spreadsheet estimates entirely
- Five-year cost-of-deferral analysis per campus generated automatically for capital presentations
- Board-ready and credit-agency-ready exports produced on demand without manual data assembly
- Capital projects approved in single board sessions rather than deferred for additional information
Documented Outcomes: Centralized AI-Driven vs Manual Multi-Campus Results
The results below compare documented performance across multi-campus university and K-12 deployments of centralized AI-driven platforms against pre-deployment baselines representing manual multi-campus management. No additional headcount was required to achieve any of these outcomes. Book a Demo to see how these results translate to your specific campus portfolio and operational model.
| Performance Metric | Manual Multi-Campus | Centralized AI-Driven | Change |
|---|---|---|---|
| Maintenance Cost per Sq Ft | $4.85 reactive avg | $3.40-$3.99 | -18% to -30% |
| Emergency Work Orders | 60-75% of budget | 60-75% fewer | -60% to -75% |
| Reactive Maintenance Share | 31% of total spend | 9% of total spend | -71% |
| Asset Condition Data Age | 18-26 months average | Under 30 days | -98% |
| Compliance Reporting Hours | Approx 140 hrs/cycle | Approx 18 hrs/cycle | -87% |
| Audit Deficiencies | Multiple per cycle | Zero documented | -100% |
| Capital Project Cost Variance | 22% average overage | 6% average | -73% |
| Energy Operating Costs | No per-campus visibility | 15-19% reduction | -15% to -19% |
| Cross-Campus Condition Visibility | None unified | Real-time all campuses | Full visibility |
| Peer Institution Ranking | Bottom 22% | Top 40% | +18 percentile pts |
Implementation Timeline: Manual to Centralized in Four Phases
The transition from manual multi-campus management to a centralized AI-driven platform follows a four-phase deployment sequence. Service delivery is uninterrupted throughout all phases. Core integration across all campus systems is operational within 60-90 days. The platform connects to existing BAS, CMMS, ERP, smart meters, and sensor infrastructure via open API without replacing any current system.
- All BAS, CMMS, smart meters, and sensors across every campus connected to unified platform
- Asset registry built from IoT inventory and existing CMMS data for all locations
- AI baseline condition scores produced for all connected assets portfolio-wide by month 3
- All facilities staff across all campuses onboarded in under 12 hours total
- AI deterioration model active across all asset classes at every campus location
- Automated work order generation and dispatch operational campus-wide
- Emergency work orders declining at all locations as planned maintenance takes hold
- Energy optimization engine live with occupancy-driven HVAC and lighting at every campus
- Per-campus FCI dashboard live with continuous IoT-informed condition scores
- Compliance documentation automated for OSHA, EPA, NFPA, and ADA at all locations
- First board-ready multi-campus capital presentation produced from live FCI data
- Cross-campus performance benchmarking reports available to institutional leadership
- 18-30% maintenance cost reduction documented and audited across all campuses
- Zero audit deficiencies across all compliance categories and all campus locations
- 15-19% energy cost reduction measured against pre-deployment baseline
- AI model compounds accuracy continuously as 18 months of campus-specific data accumulates
Key Benefits of Centralized AI-Driven Multi-Campus Management
Condition scores, maintenance status, energy performance, and compliance data for every campus location visible from one platform simultaneously. No manual assembly, no reporting delays, and no information gaps between campus visits. Portfolio situational awareness that manual systems cannot produce at any staffing level.
Automated documentation from continuous IoT and maintenance data applies the same compliance standard to every campus location without requiring central office visits. OSHA, EPA, NFPA, and ADA requirements met simultaneously across all locations, producing zero deficiencies across all categories in the same audit cycle that manual systems produced multiple findings.
Live FCI per campus from continuous IoT monitoring replaces stale inspection estimates as capital project scoping data. Five-year cost-of-deferral analysis and multi-year CIP scenarios built on current condition rather than historical estimates reduce project cost variance and convert board capital presentations from requests for more information into single-session approvals.
Predictive maintenance scheduling across all campuses converts reactive emergency spend at 3-5x planned cost into scheduled preventive work at a fraction of the per-event cost. No additional headcount required at any campus location. The savings compound annually as the AI model accumulates more campus-specific deterioration data and improves prediction accuracy each month.
Open API integration connects existing BAS, CMMS, ERP, smart meters, and sensor networks at every campus into the unified analytics platform without replacing any current system. Data from 11 or more separate source systems per campus consolidated automatically. Core integration operational within 60-90 days of deployment start with no service interruption.
Planned-to-reactive ratios, energy performance, compliance completion rates, and capital project accuracy benchmarked across all campus locations simultaneously. Performance differences between locations become visible and actionable rather than hidden in disconnected reports. Accountability shifts from complaint-driven to data-driven across the entire multi-campus portfolio.