Every hour a university HVAC system fails during exams, an elevator goes offline in a building with mobility-dependent students, or a lab chiller shuts down mid-experiment represents compounding institutional cost. Unplanned downtime at critical campus assets is not random — it is predictable. Universities deploying predictive maintenance platforms report 60-75% fewer emergency work orders, 18-30% lower maintenance costs, and near-elimination of critical asset failures. The difference between institutions that experience chronic downtime and those that do not is not budget. It is data. See how predictive analytics prevents critical asset failures at your campus — Book a Demo.
Why Campus Downtime Is a Predictive Data Problem
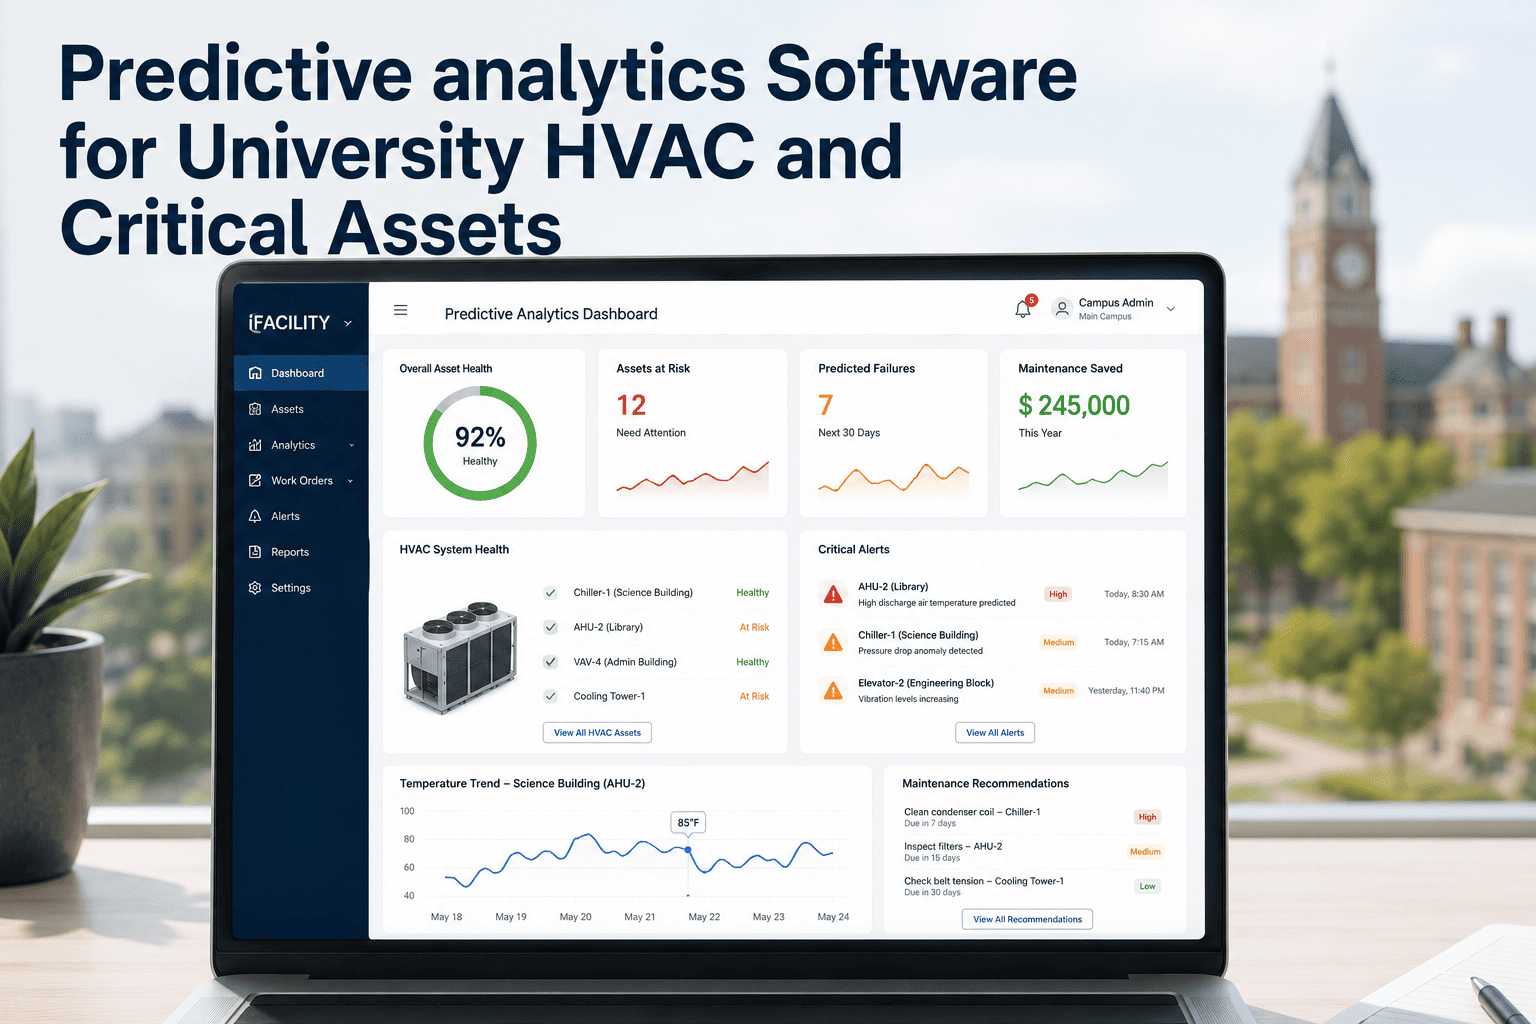
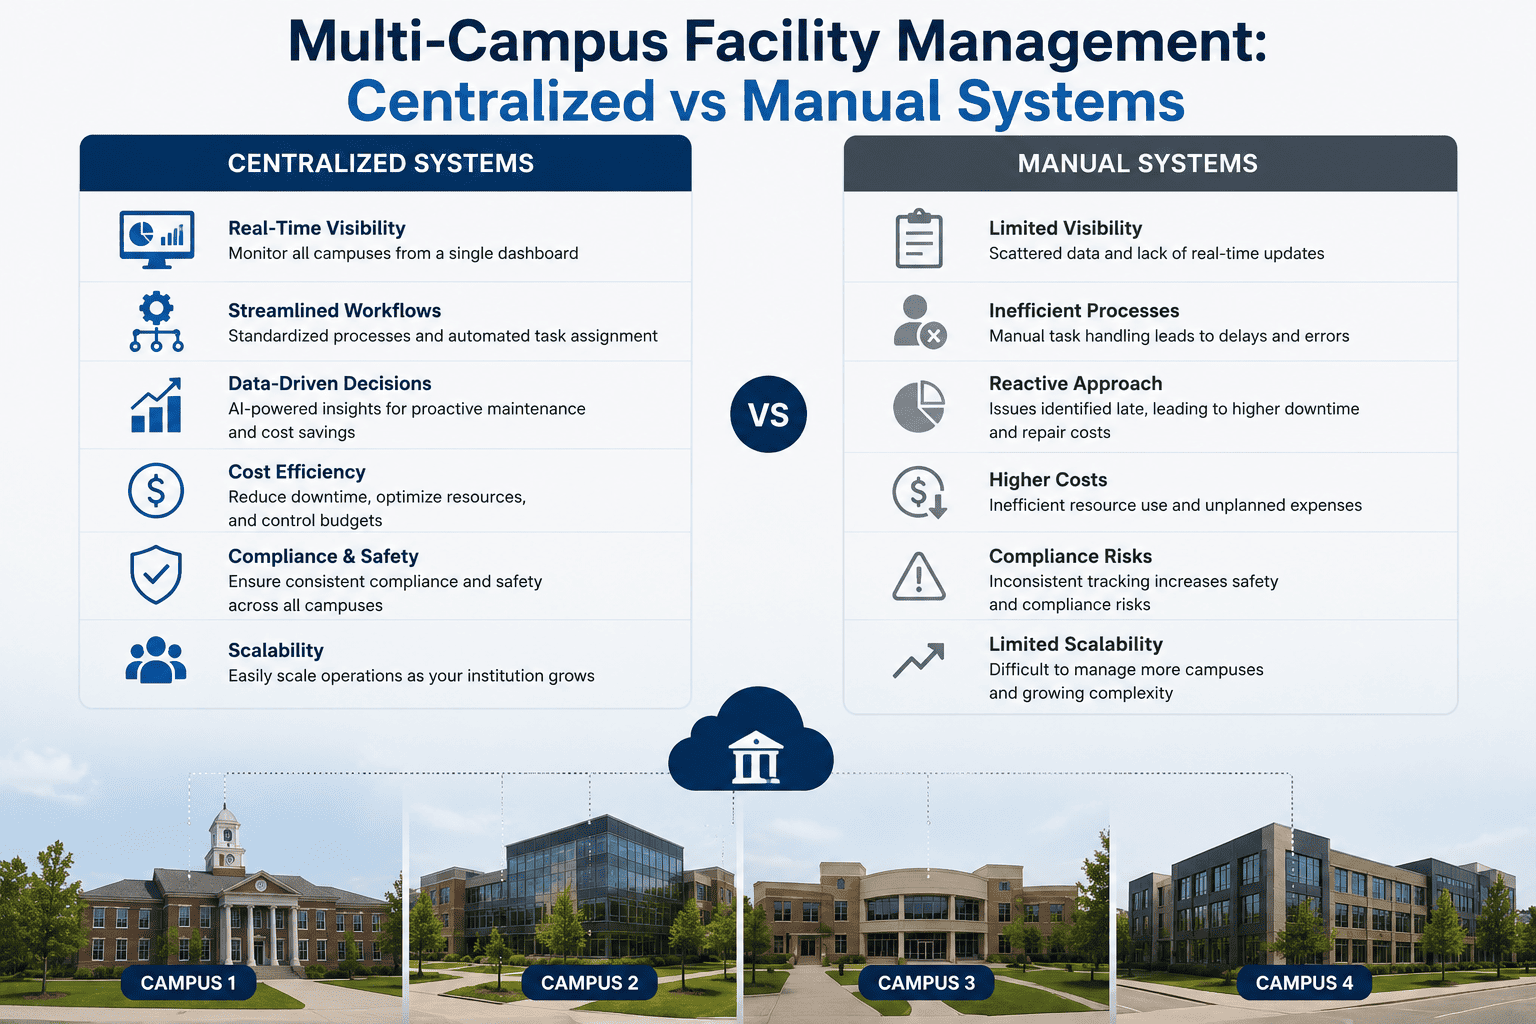
Campus asset failures look sudden but are almost never unannounced. HVAC systems degrade over weeks before complete failure. Elevators show abnormal motor signatures days before stopping. Lab chillers exhibit efficiency loss patterns 7-14 days before shutdown. Manual maintenance misses these signals entirely because inspection cycles are too infrequent and reactive dispatch only activates after disruption has already begun.
Predictive maintenance platforms solve this by monitoring critical assets continuously through IoT sensors and AI deterioration models that identify failure trajectories before any physical symptom is visible. Map continuous monitoring to your campus critical asset inventory — Book a Demo.
Critical Asset Classes and How Predictive Monitoring Works for Each
Different asset classes produce different failure signatures. Effective predictive maintenance requires sensors and AI models tuned to the specific deterioration patterns of each asset type across your campus portfolio.
Temperature, humidity, and compressor amp draw sensors detect efficiency degradation weeks before failure. Chiller performance loss of 8-12% typically precedes complete shutdown by 10-18 days — enough time to schedule intervention before any classroom or dormitory loses conditioning.
Motor current signatures, door cycle timing, and vibration sensors detect bearing wear or brake degradation 7-14 days before failure. For buildings serving mobility-dependent students, this detection window is the difference between a scheduled repair and an ADA compliance incident.
Temperature excursion sensors and compressor monitoring on lab freezers, incubators, and centrifuges protect research samples and compliance with storage protocols. A single undetected lab freezer failure can destroy months of research and trigger IRB compliance issues.
Power quality sensors monitoring harmonic distortion and voltage anomalies detect failing switchgear and transformer degradation before building-wide outages occur. A single panel failure can affect dozens of classrooms and research spaces simultaneously.
Flow sensors and acoustic leak detectors identify pipe degradation before visible water events. Legionella risk monitoring flags temperature and stagnation conditions in dormitory plumbing. Early detection prevents both physical damage and EPA compliance exposure that follows water system failures.
Fire alarm panel status, suppression system pressure, and emergency notification health are monitored continuously. NFPA compliance documentation is generated automatically from live system data. Any degradation triggers immediate alert and automated work order before a scheduled inspection would have detected the issue.
How the Predictive Maintenance Platform Works
The platform operates as a continuous loop: IoT sensor data → AI analysis → automated scheduling → compliance documentation — all in one operational system. See how each stage applies to your critical asset inventory — Book a Demo.
- Sensors on every critical asset feed real-time data to the unified platform around the clock
- Existing BAS, smart meters, and sensor networks connected via open API without replacement
- Data streams from 11+ source systems consolidated into a single monitoring layer
- AI model analyzes sensor data against asset age, usage patterns, and campus-specific deterioration rates
- Failure probability calculated per asset with intervention timing generated automatically
- Model accuracy improves monthly as campus-specific data accumulates
- Statistical anomalies flagged immediately when sensor readings deviate beyond threshold
- Multi-sensor correlation reduces false positives before alert dispatch
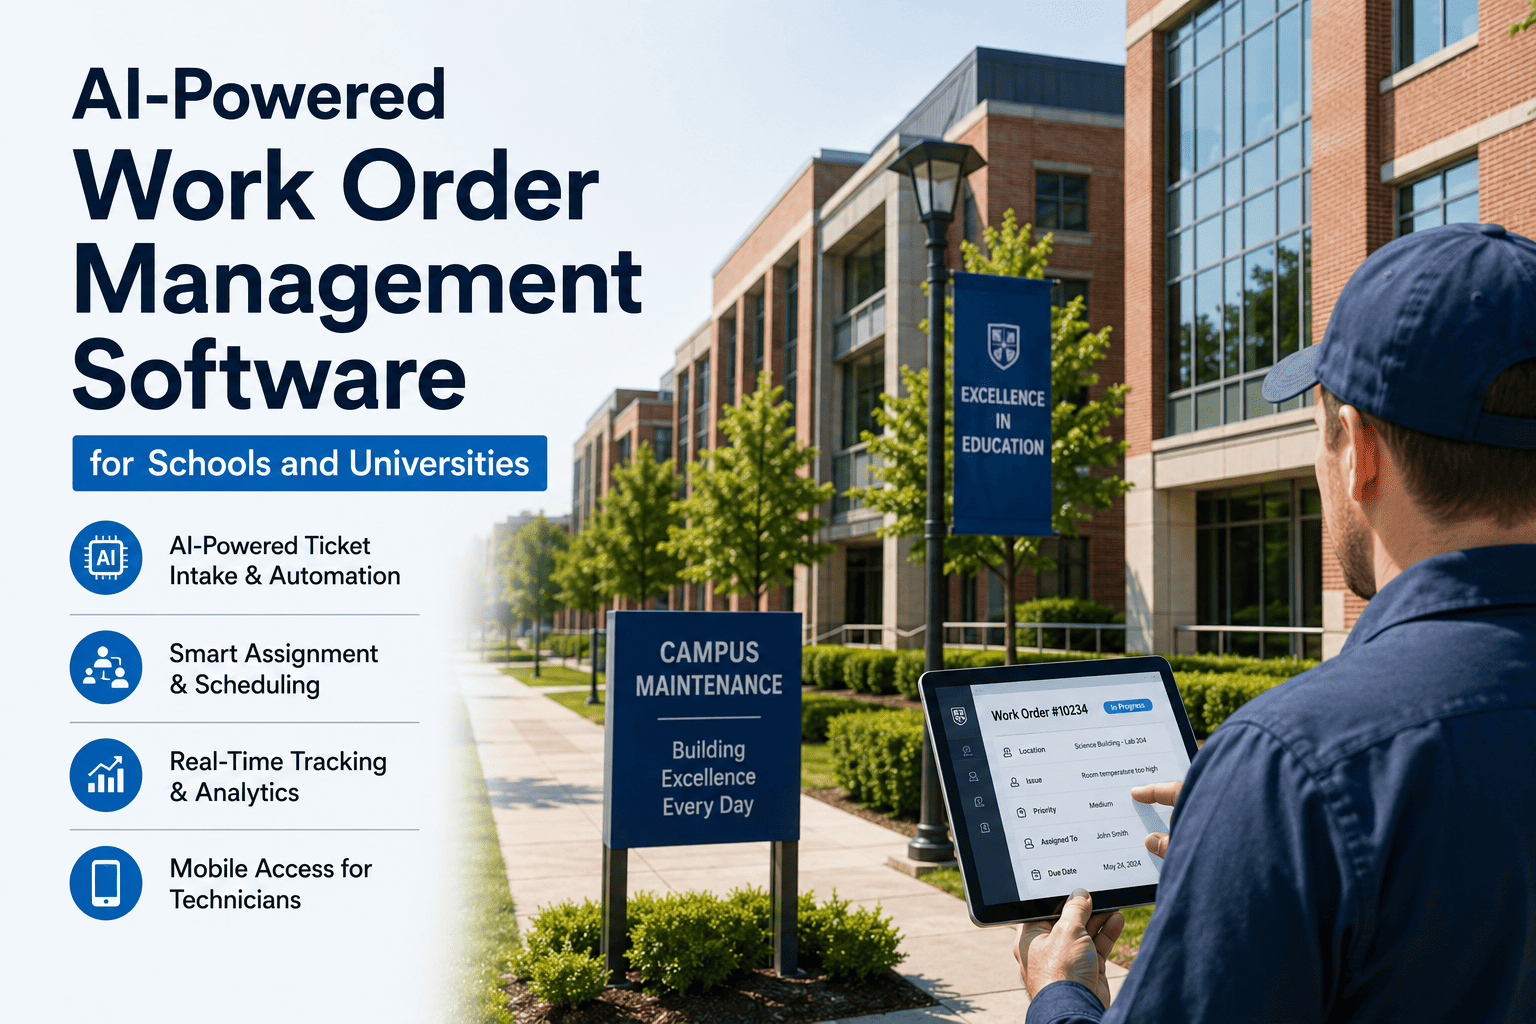
- Alerts routed to responsible technician with asset history and recommended action included
- Predictive work orders created from AI condition forecasts without manual scheduling
- Work orders routed to correct technician or contractor based on asset type and skill
- Semester break and low-occupancy windows scheduled automatically for major interventions
- OSHA, NFPA, EPA, and ADA records generated automatically from live IoT and maintenance data
- Inspection records and corrective action tracking produced without manual assembly
- Audit packages exported on demand — zero deficiencies in all documented deployments
- FCI per building calculated from continuous condition data for capital request documentation
- Cost-of-deferral projections per critical asset generated automatically for board presentations
- Capital project cost variance drops from 22% to 6% when scoped from live IoT condition data
Implementation Timeline: Predictive Monitoring Operational in 60-90 Days
- Existing BAS, meters, and sensors connected to unified platform via open API
- Critical asset registry built with AI baseline condition scores by month three
- Real-time anomaly detection operational across all monitored assets
- AI deterioration model active with automated work order generation campus-wide
- Emergency work orders declining as planned maintenance replaces reactive dispatch
- Critical asset failure rate dropping measurably in first two academic terms
- Automated compliance documentation live for OSHA, NFPA, and EPA requirements
- FCI dashboard operational with per-building capital replacement projections
- First board-ready capital presentation produced from live IoT-informed FCI data
- 18-30% maintenance cost reduction documented against pre-deployment baseline
- 60-75% fewer emergency work orders, reactive share reduced from 31% to 9%
- Zero audit deficiencies across all compliance categories in first post-deployment audit
Documented Outcomes From University Predictive Maintenance Deployments
Results measured against pre-deployment baselines on existing operational budgets. No additional headcount was added. See how these outcomes translate to your campus asset portfolio — Book a Demo.
| Downtime Reduction Metric | Before Deployment | After 18 Months | Change |
|---|---|---|---|
| Emergency Work Orders | 60-75% of budget | 60-75% fewer | -60% to -75% |
| Maintenance Cost per Sq Ft | $4.85 reactive avg | $3.40-$3.99 | -18% to -30% |
| Reactive Maintenance Share | 31% of total spend | 9% of total spend | -71% |
| Asset Condition Data Age | 18-26 months average | Under 30 days | -98% |
| Capital Project Cost Variance | 22% average overage | 6% average | -73% |
| Audit Deficiencies | Multiple per cycle | Zero documented | -100% |
| Compliance Reporting Hours | 140 hrs per cycle | 18 hrs per cycle | -87% |
| Energy Operating Costs | No per-building visibility | 15-19% reduction | -15% to -19% |