Universities are making billion-dollar infrastructure decisions on data that is often two years out of date. A digital twin changes this entirely. By creating a continuously updated virtual replica of every campus building, system, and asset, universities can simulate failures before they happen, model capital investments before committing budget, and monitor facility condition in real time without waiting for the next physical inspection. Book a Demo to see a live digital twin campus walkthrough and map it to your facility risk profile.
What a Digital Twin Actually Is in a University Facility Context
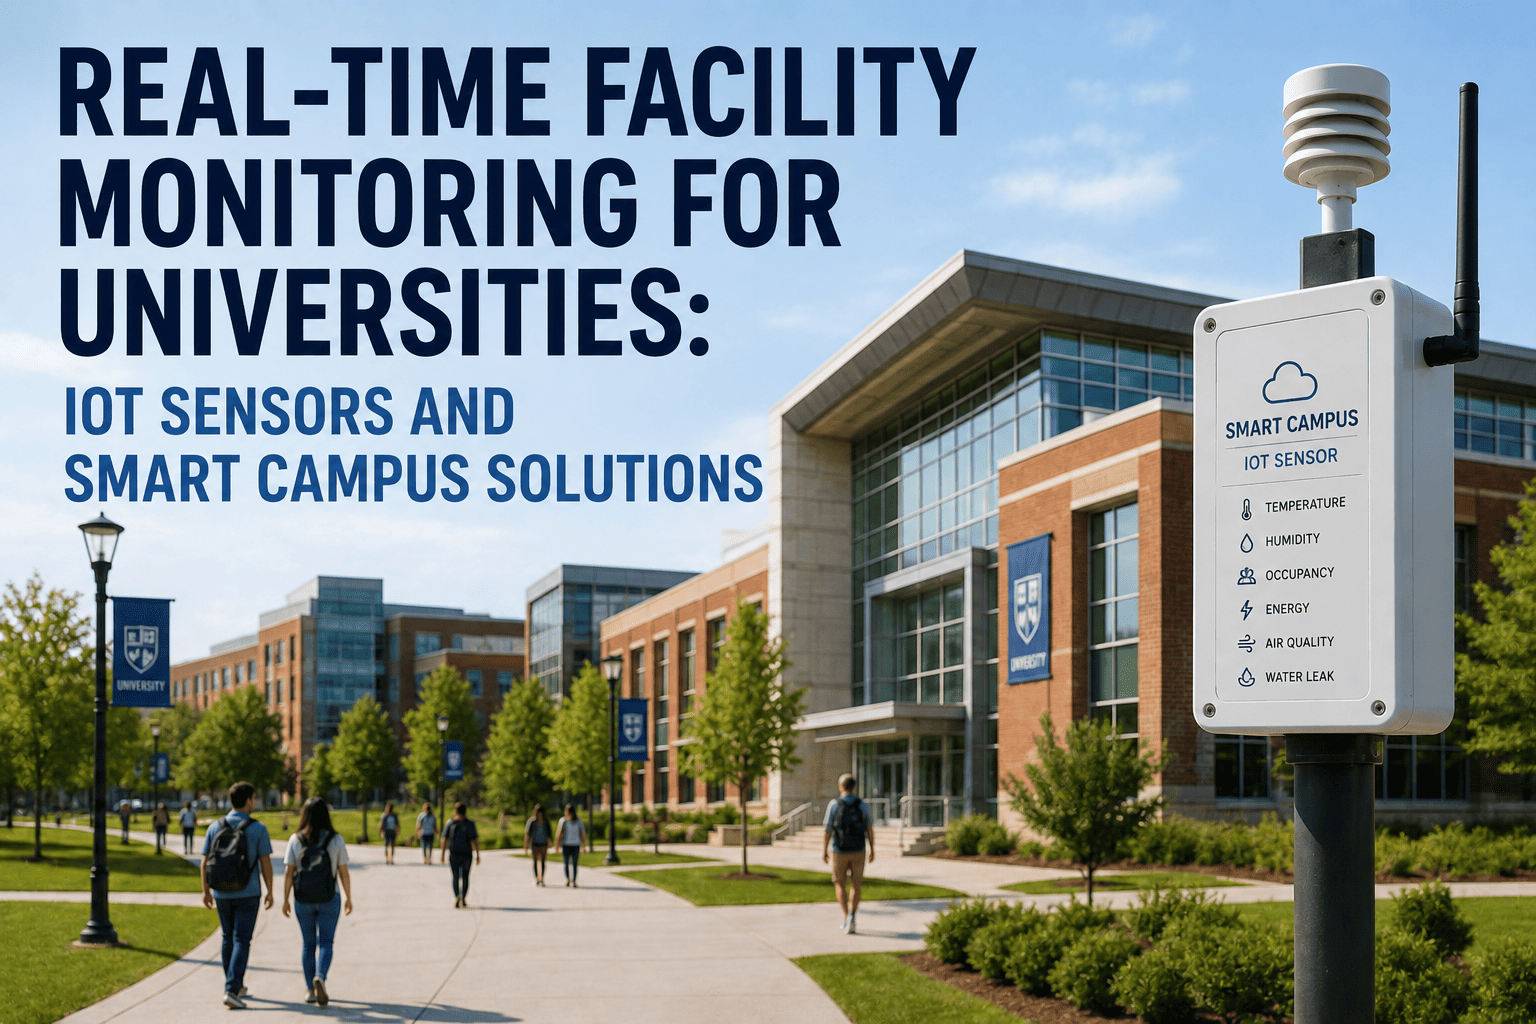
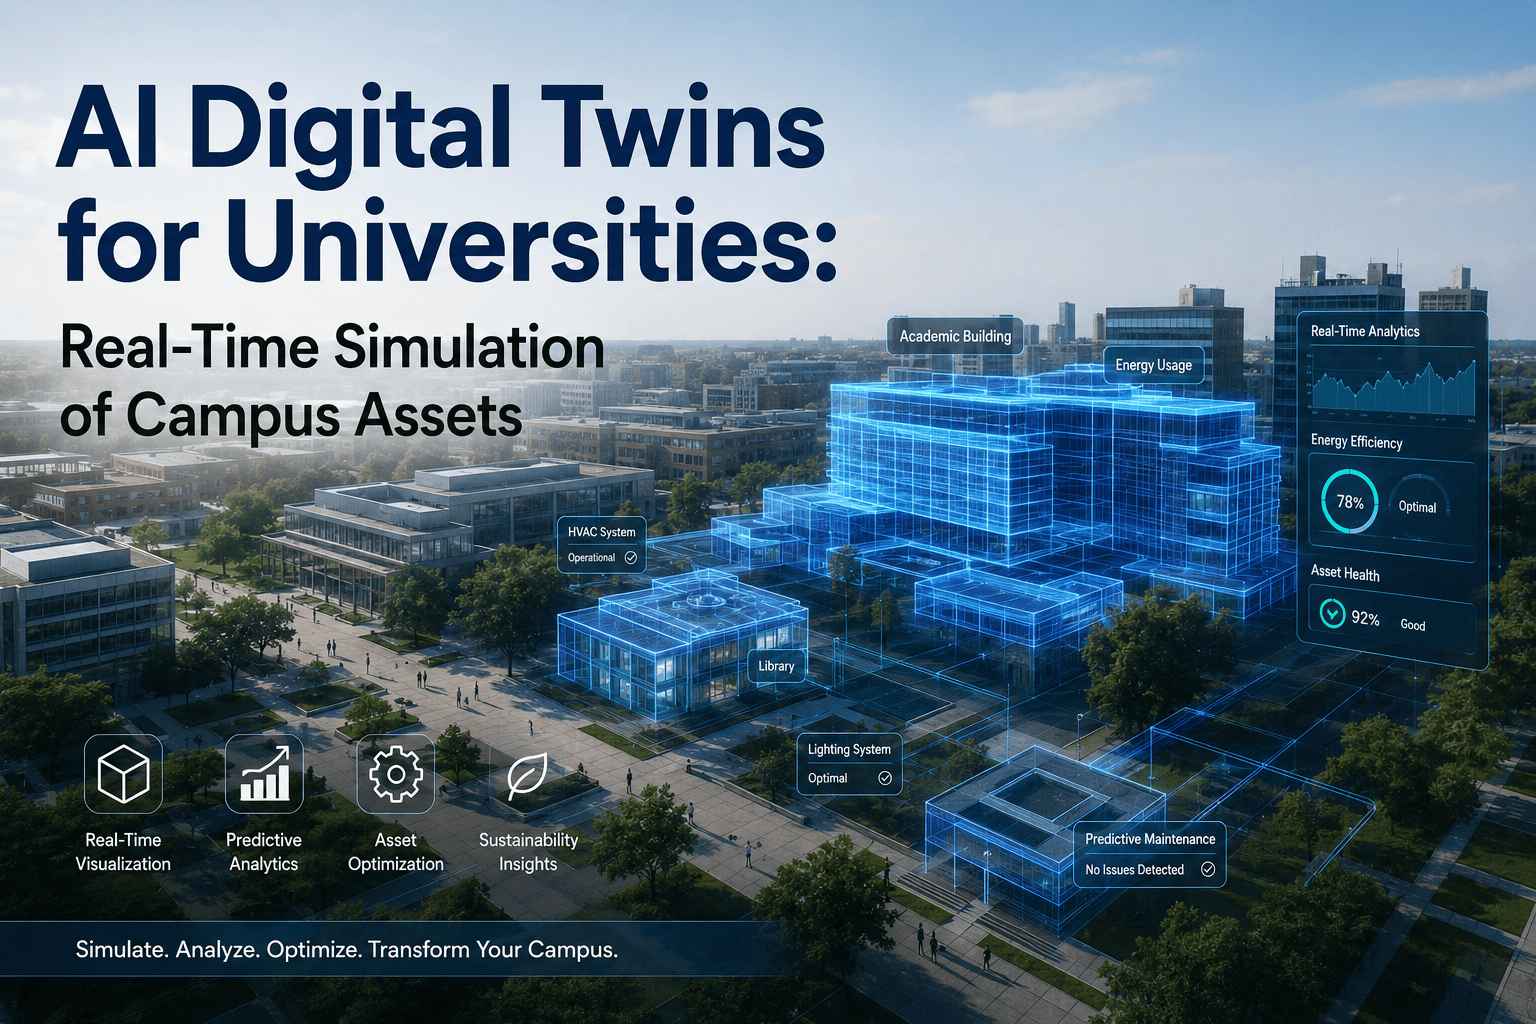
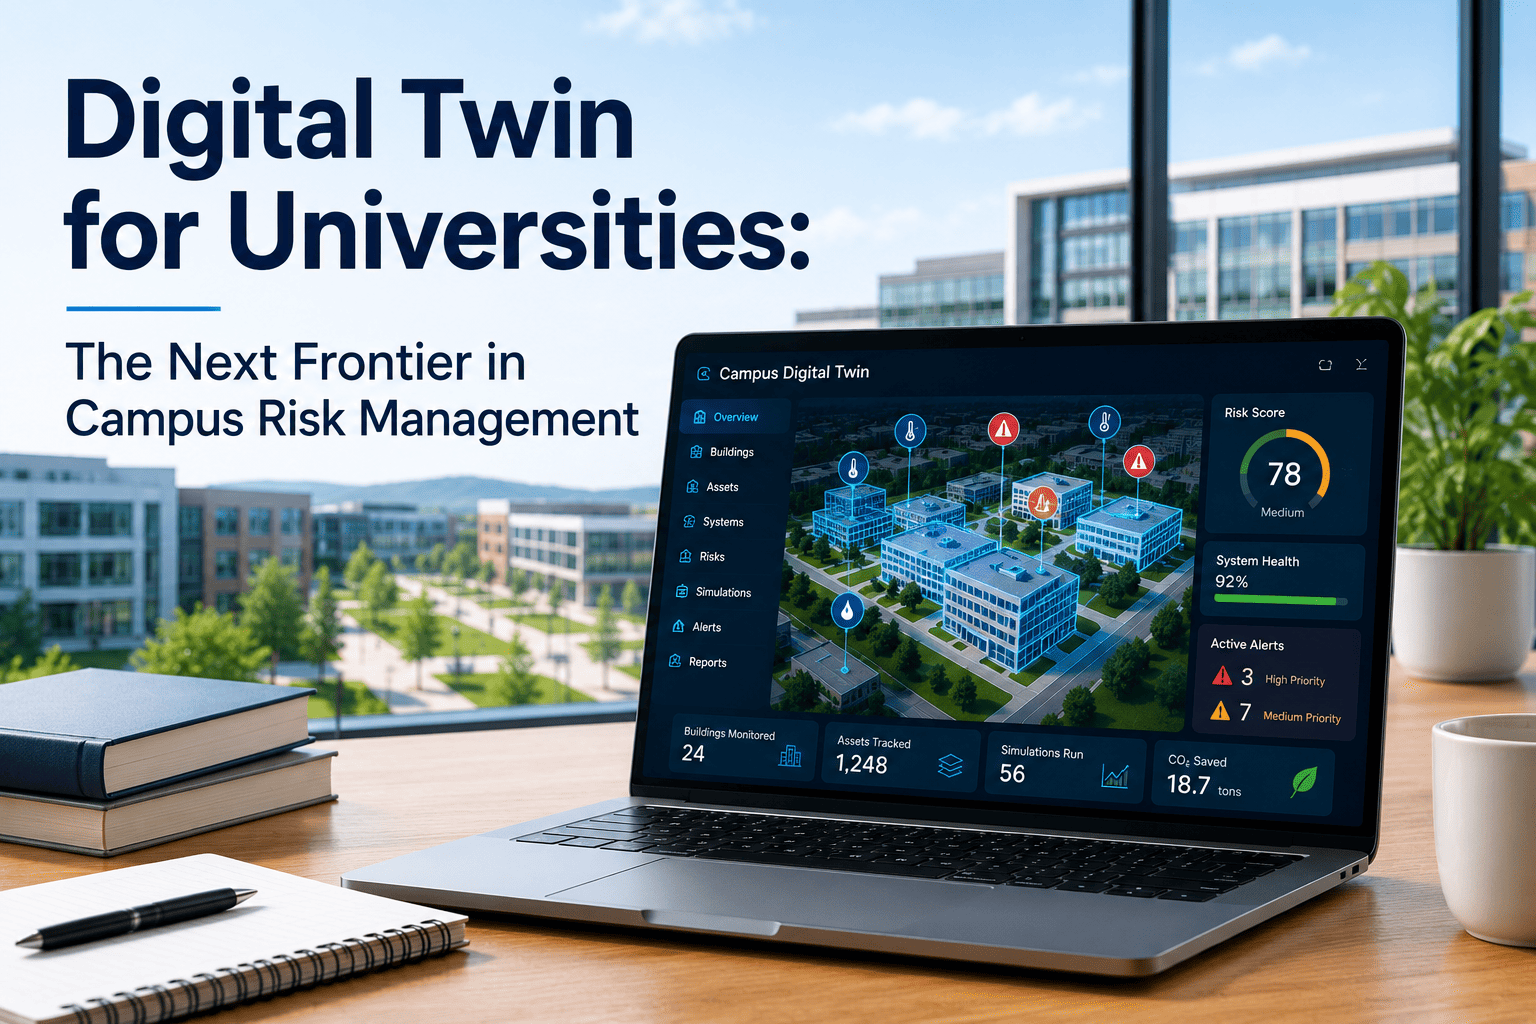
A digital twin is not a 3D model or a static BIM file. It is a living, continuously updated virtual representation of a campus that reflects current real-world condition within hours of any change. It ingests data from IoT sensors, building management systems, maintenance records, energy meters, and occupancy monitors to maintain an accurate operational picture of every tracked asset simultaneously.
Where BIM captures what was built, a digital twin models what is happening now and what will happen next. AI deterioration models run continuously against live data, projecting how each building system will behave given current usage patterns, environmental conditions, and maintenance history. Book a Demo to see how digital twin condition scoring works across a live multi-building campus portfolio.
The Problem Digital Twins Solve: Why Static Data Fails Universities
The core failure in traditional campus facility management is the gap between when condition data is collected and when decisions are made from it. Physical assessments occur every two to three years. Capital planning committees review asset reports that are 18-26 months old. Capital requests routinely miss actual scope by 20% or more, generating mid-project reauthorizations and board confidence losses that compound over time.
Six Ways Digital Twins Reduce Facility Risk and Cost
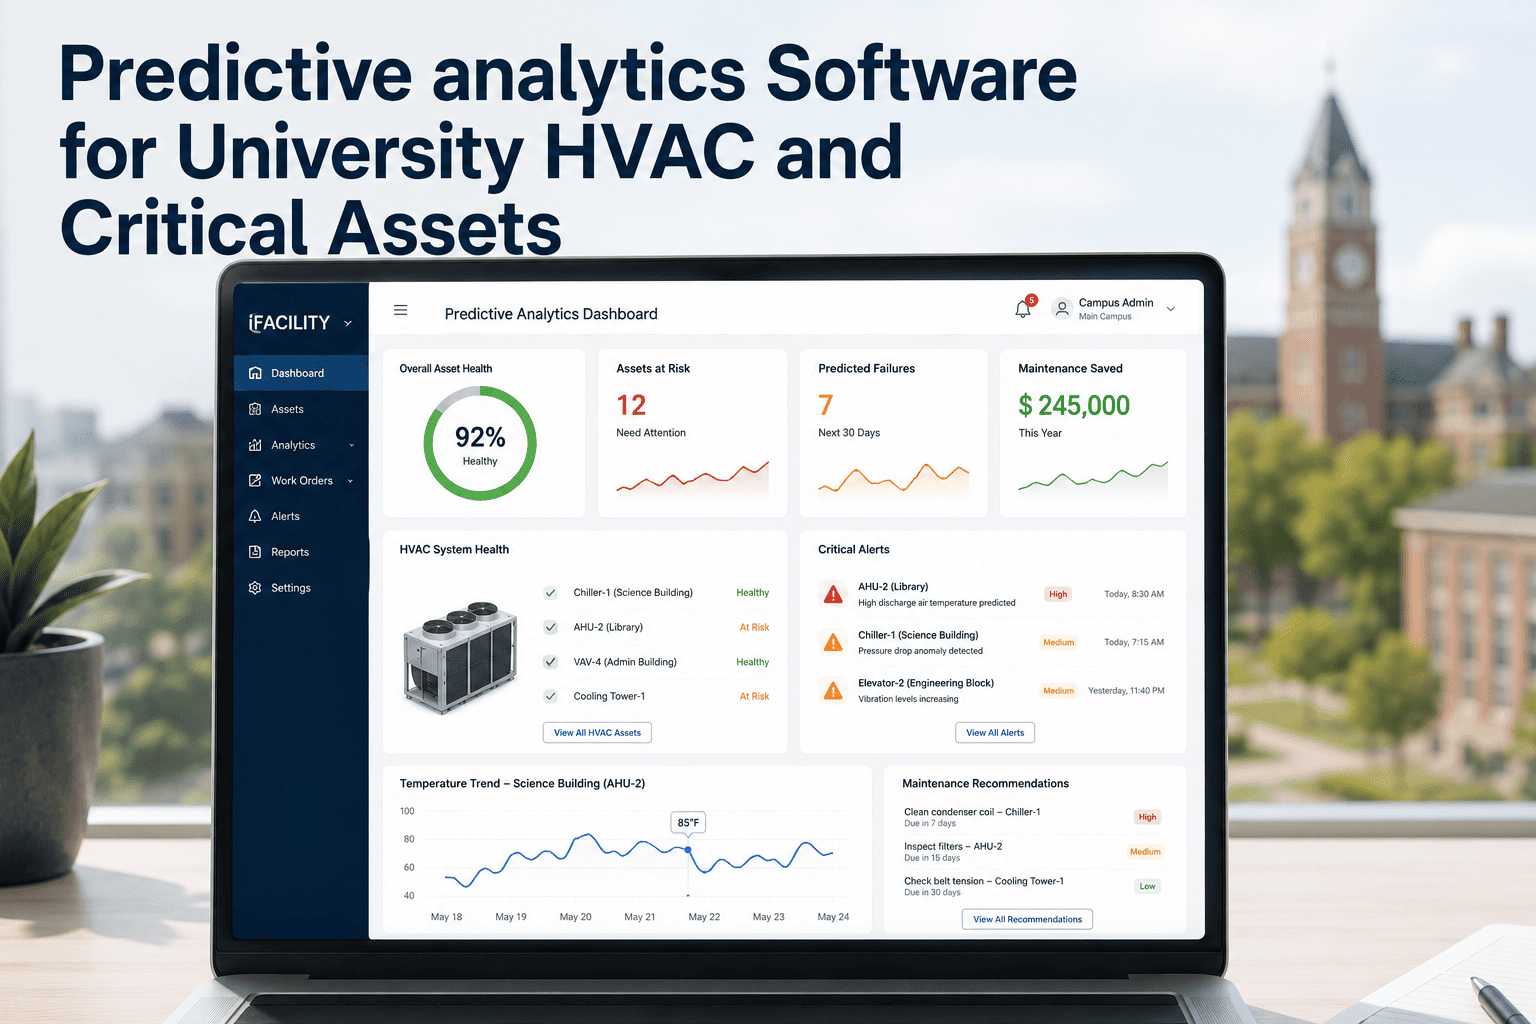
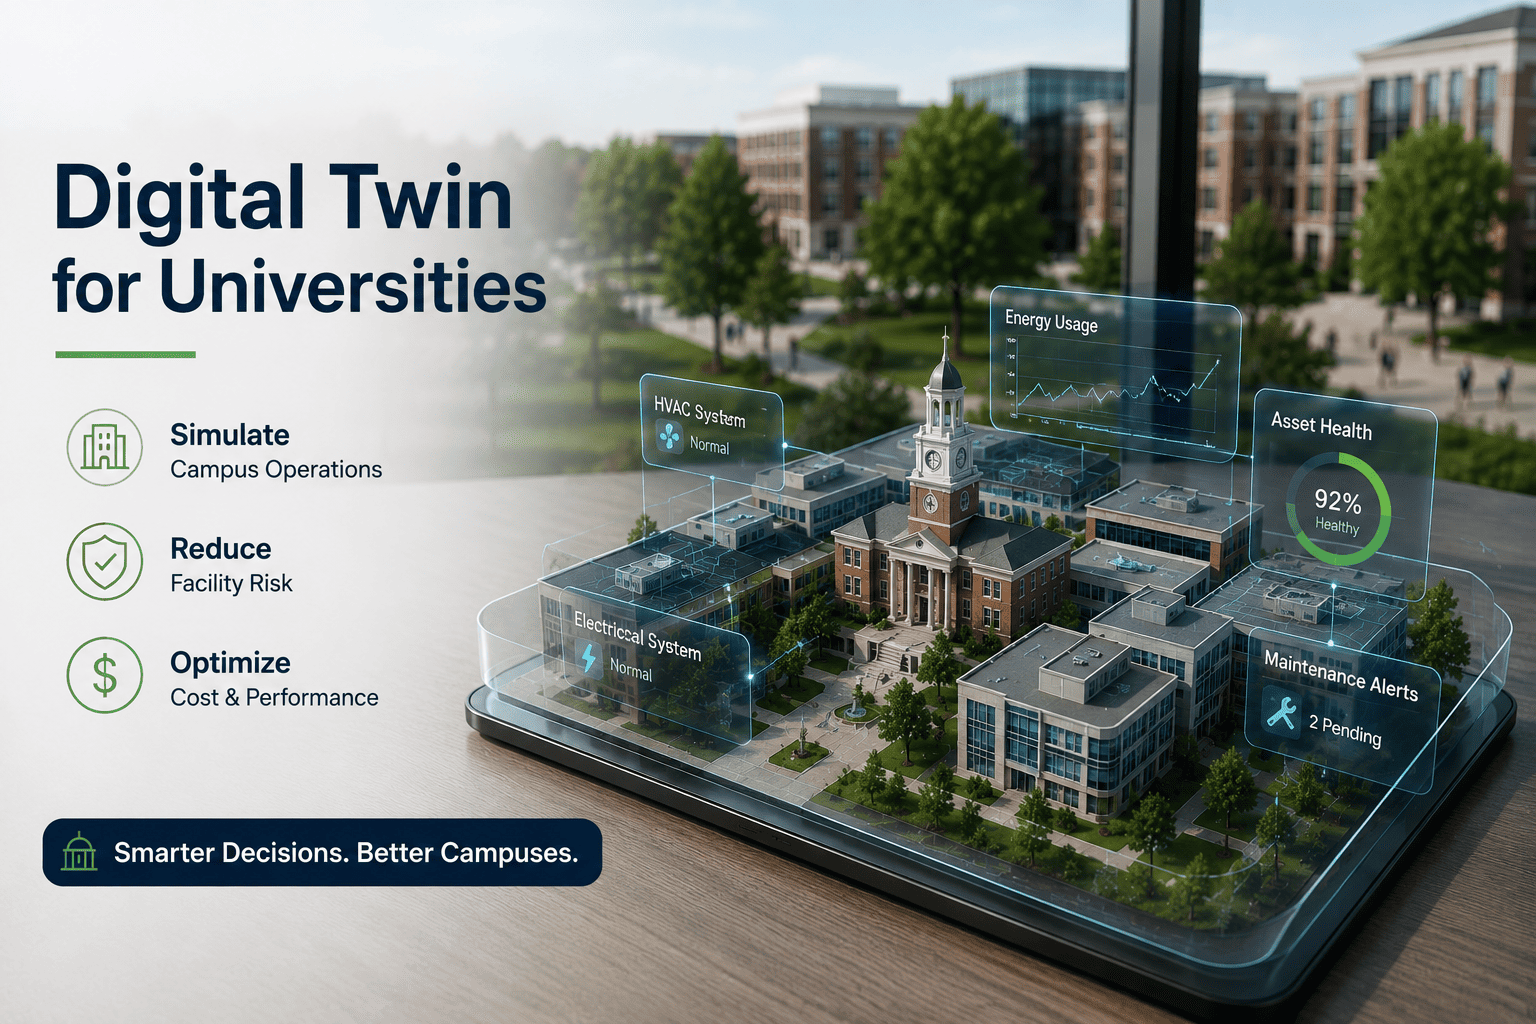
Digital twin technology reduces campus facility risk across six integrated application areas. Each builds on the same data layer, meaning the investment delivers value across every use case simultaneously.
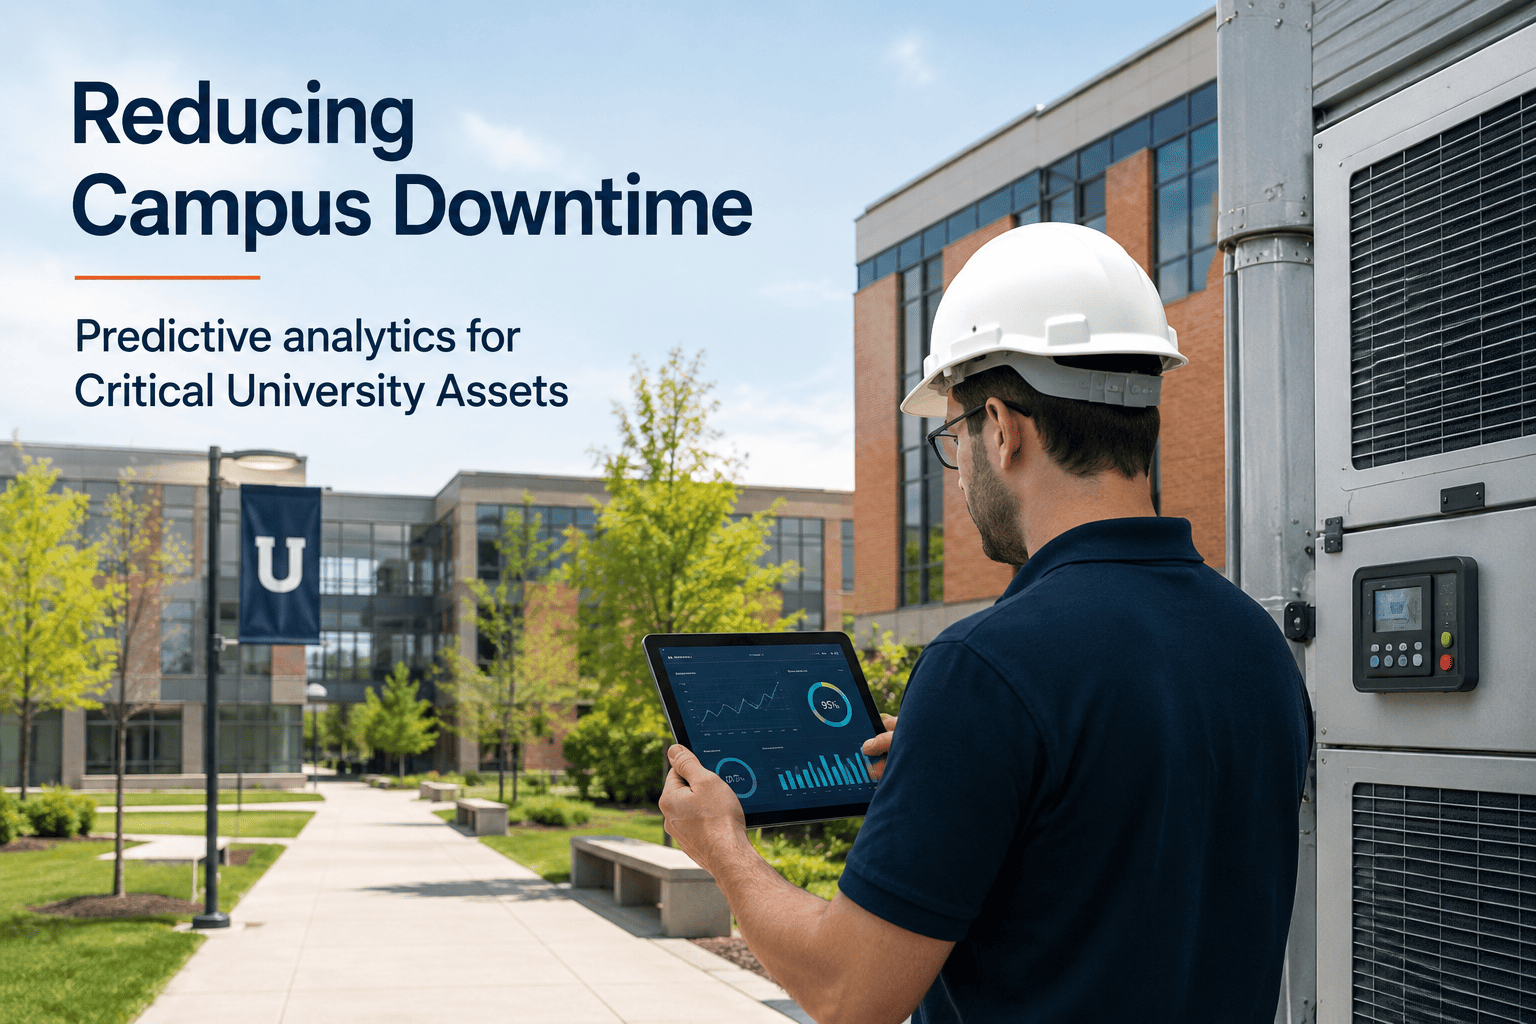
- AI scores failure probability continuously from sensor and usage data
- Deteriorating assets flagged weeks before reaching critical threshold
- Automated work orders generated at optimal intervention point
- 85% reduction in unplanned system failures documented within 18 months
- Model renovation configurations and compare projected cost and ROI
- Simulate decommissioning impact on utility loads and compliance obligations
- Five-year cost-of-deferral calculated per building from live condition data
- Board-ready capital packages exported in one click with full FCI documentation
- Temperature, humidity, vibration, and power quality tracked per instrument
- Environmental deviations flagged before compromising experiment integrity
- Calibration and maintenance history maintained automatically per asset
- ISO and GLP compliance documentation generated from continuous sensor data
- Per-building energy tracked continuously against dynamic seasonal baselines
- Maintenance failures driving consumption spikes flagged for resolution
- 15-20% energy cost reduction documented across campus deployments
- EPA and state energy reporting automated from live twin operational data
- OSHA, EPA, ADA, and accreditation records generated from live twin data
- Maintenance history current and exportable for every tracked asset
- Compliance preparation reduced from 140 hours to 18 hours per cycle
- Credit-agency-ready FCI documentation with remediation trajectory on demand
- Simulate cascading effects of any building change before physical work begins
- Model HVAC reconfiguration impact on neighboring buildings before commitment
- Identify hidden system interdependencies before they become change-order costs
- Reduce renovation scope variance from 22% average to under 6% documented
Digital Twin vs Traditional Condition Assessment
The difference is not a matter of degree. It is a structural difference in how campus facility intelligence is generated, maintained, and applied to institutional decisions.
| Capability | Traditional Assessment | Digital Twin Platform |
|---|---|---|
| Condition data age | 18-26 months at time of use | Under 30 days, continuously updated |
| Failure detection method | Physical inspection or complaint | AI prediction weeks before failure |
| Capital planning basis | Stale assessment estimates | Live condition index with FCI scoring |
| Scenario modeling | Not available | Multi-scenario simulation before commitment |
| Energy visibility | Aggregate campus bill only | Per-building, per-system live consumption |
| Compliance documentation | Manual assembly under audit pressure | Automated generation from live data |
| Capital project cost variance | 22% average overage | 6% average documented |
| Staff hours per reporting cycle | 140 hours manual | 18 hours automated |
| Model accuracy over time | Declines between assessments | Improves continuously with more data |
Implementation: How Universities Deploy a Digital Twin
Deployment does not require replacing existing campus infrastructure. The platform integrates with building management systems, CMMS, energy meters, and ERP through open API connections that require no data migration and minimal IT involvement. Twin baseline accuracy is established within 60-90 days. Full predictive maturity develops over 12-18 months.
- BMS, CMMS, energy, and ERP connected via open API
- Asset registry validated across all buildings
- IoT sensors deployed on priority assets
- Digital twin baseline with initial condition scoring established
- AI deterioration models active across all integrated asset classes
- Failure prediction alerts and automated work orders live
- Per-building energy intelligence dashboard deployed
- First compliance reporting cycle produced automatically from twin data
- Capital planning dashboard with live FCI data deployed for leadership
- Renovation and decommissioning scenario modeling activated
- Five-year cost-of-deferral projections generated per building
- Emergency work orders down 40-60% from pre-deployment baseline
- AI model at peak accuracy from 18 months of campus-specific data
- Condition data under 30 days for all asset classes across campus
- Capital project cost variance reduced from 22% to 6% documented
- Zero compliance audit deficiencies across all tracked systems
Documented Results: Digital Twin Outcomes at Universities
All outcomes below are documented across university deployments measured against the same operational budget before and after implementation. No additional funding was required. Book a Demo to model these outcomes against your institution's specific facility and capital profile.
| Metric | Without Digital Twin | With Digital Twin | Change |
|---|---|---|---|
| Capital project cost variance | 22% average overage | 6% average documented | -73% |
| Unplanned system failures | Complaint-driven, reactive | 85% reduction documented | -85% |
| Asset condition data age | 18-26 months average | Under 30 days continuously | -98% |
| Energy operating costs | No per-building visibility | 15-20% reduction documented | -15% to -20% |
| Compliance preparation hours | 140 hrs per cycle | 18 hrs automated | -87% |
| Asset lifespan | Premature replacement | 40% extension documented | +40% |
| Maintenance cost per sq ft | $4.85 reactive average | $3.40-$3.99 documented | -18% to -30% |