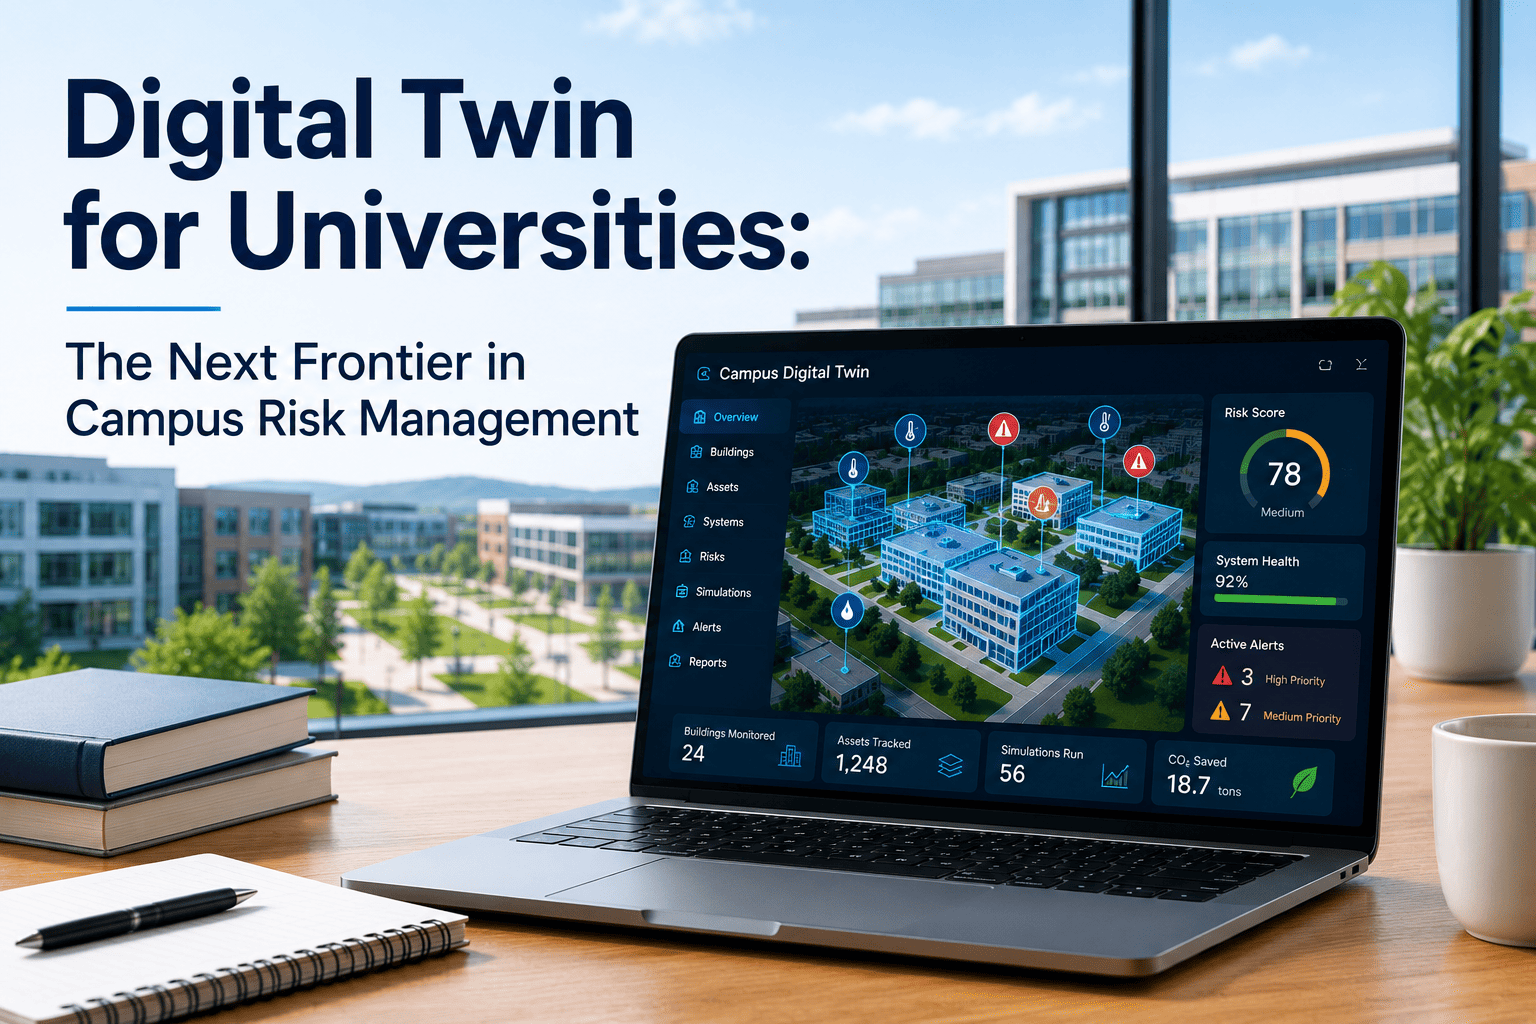
A digital twin is a live virtual model of a physical campus — built from IoT sensor feeds, maintenance records, and building system data — that runs continuously alongside the real infrastructure it represents. Universities deploying digital twin platforms are using them to simulate equipment failures before they occur, model capital investment scenarios on current condition data, identify compliance exposure before audits, and optimize energy systems in real time. This is not experimental technology. Documented university deployments show 18-30% maintenance cost reductions, 60-75% fewer emergency work orders, and capital project cost variance dropping from 22% to 6% on existing operational budgets. See how a digital twin maps to your campus infrastructure and risk profile in a live demo.
What a University Digital Twin Actually Is
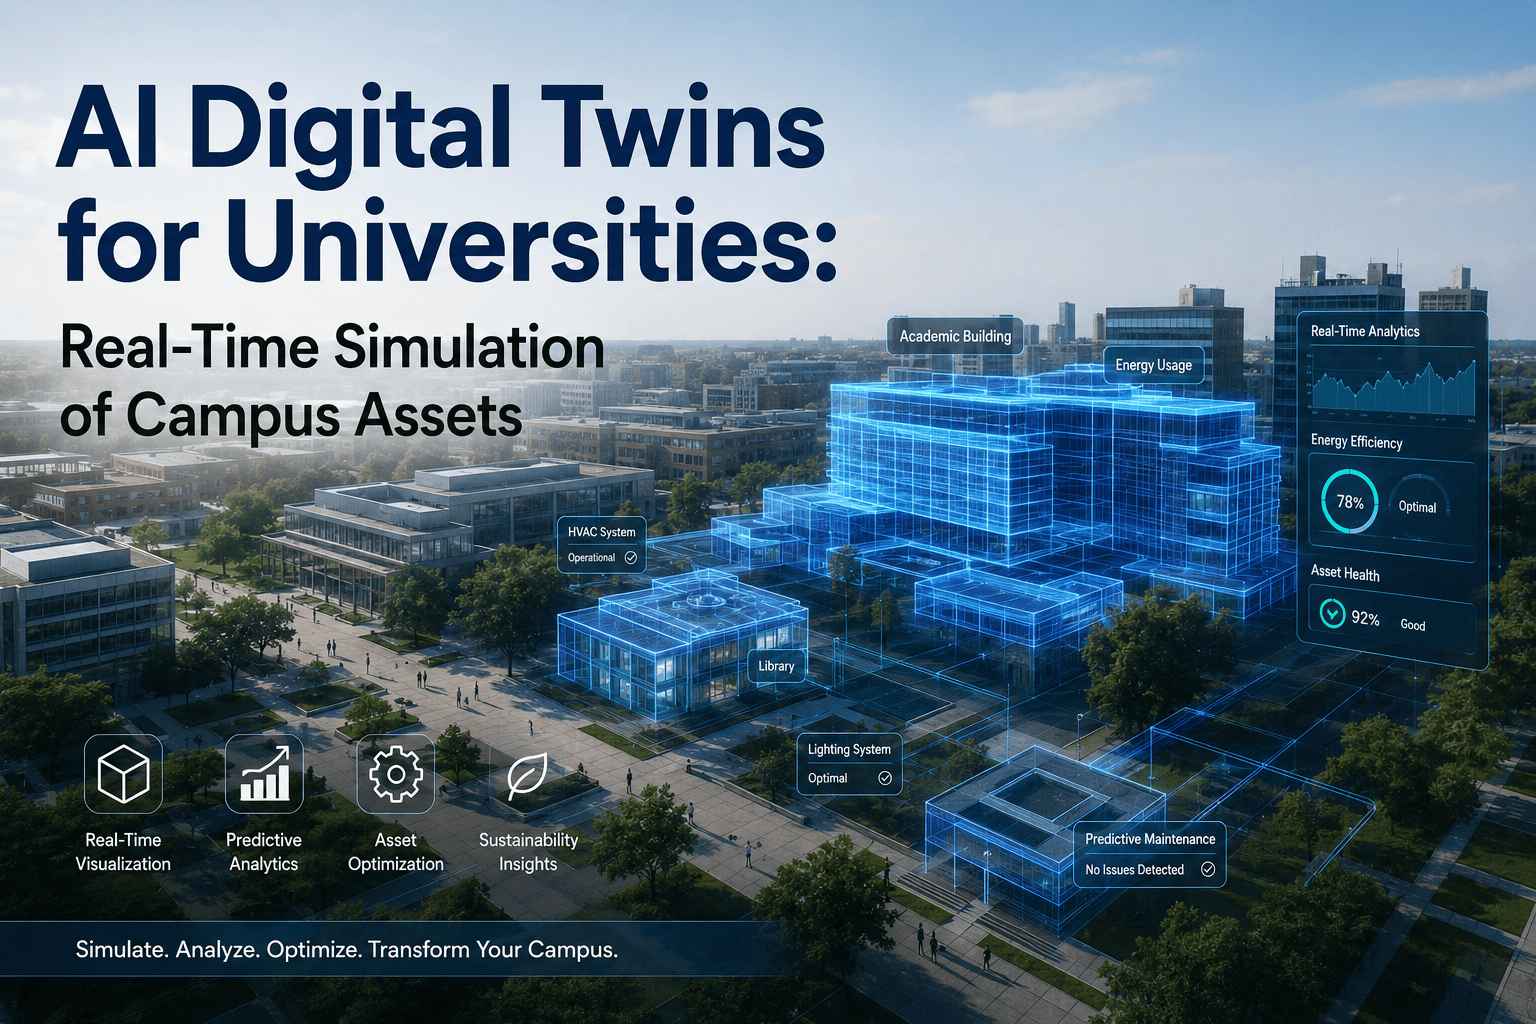
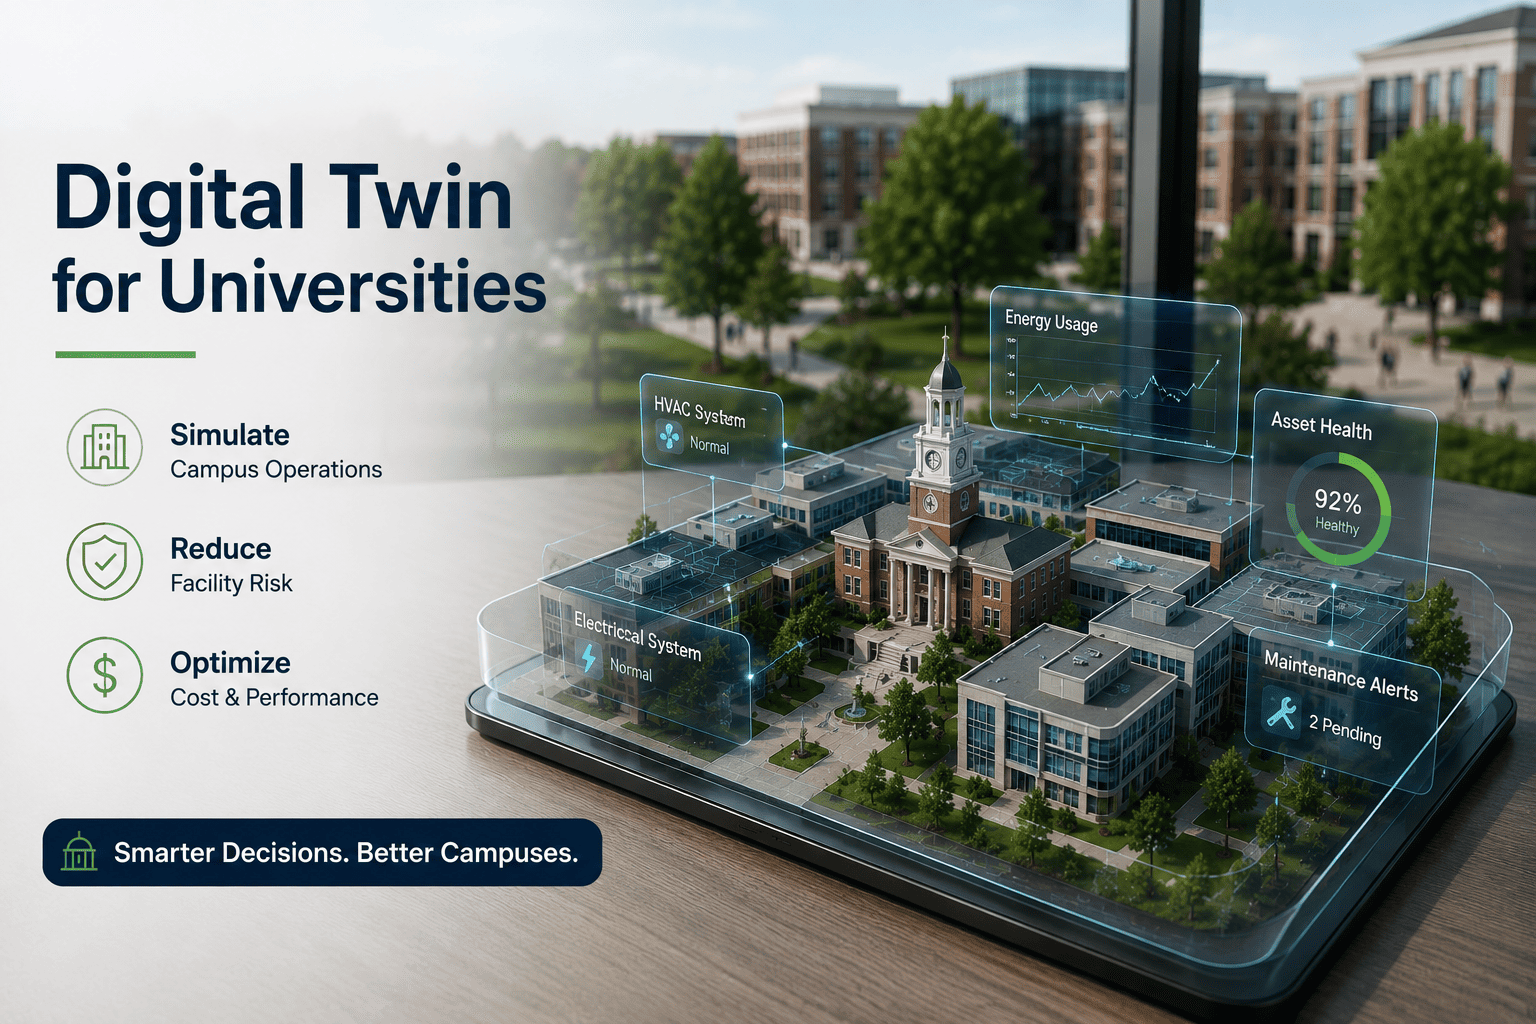
A digital twin is not a 3D building model or a floor plan database. It is a continuously updated virtual representation of physical campus systems — fed by live IoT sensor data, maintenance records, energy consumption feeds, and occupancy signals — that mirrors the real-world state of every monitored asset in real time. When a chiller degrades, the digital twin degrades. When a roof section absorbs moisture, the twin registers it. When electrical load signatures shift abnormally, the twin flags it before the physical system fails.
The distinction between a digital twin and a traditional facility management system is the direction of information flow. Traditional systems record what has already happened. A digital twin continuously predicts what is about to happen and simulates the consequences of intervention or deferral decisions before any physical action is taken. See a live digital twin demonstration mapped to a campus portfolio like yours.
- Records failures after they occur
- Condition data 18-26 months stale at decision time
- Capital scoped on historical estimates
- Compliance assembled manually before audits
- Energy optimized on fixed schedules
- Risk visible only after it materializes
- Predicts failures weeks before they occur
- Condition data under 30 days old continuously
- Capital scoped on live condition scores
- Compliance generated automatically from live data
- Energy optimized from real-time occupancy signals
- Risk quantified and ranked before it materializes
Six Ways Digital Twins Reduce Campus Risk
The digital twin runs deterioration models against live sensor data for every monitored asset class — HVAC, electrical, plumbing, roofing, and elevators — and generates failure probability scores updated continuously. When a chiller's efficiency degradation pattern matches historical pre-failure signatures, the twin flags it 7-21 days before physical failure. The intervention happens on a scheduled timeline at planned cost rather than emergency rates.
Traditional capital planning scenarios are modeled on condition estimates that may be 18-36 months stale. The digital twin runs five-year capital scenarios on live condition scores per building, showing the cost of each investment decision at current conditions rather than estimated ones. Capital project cost variance drops from 22% to 6% because scoping is based on what the building actually is, not what it was assessed to be.
The twin monitors compliance status across OSHA, EPA, NFPA, and ADA frameworks continuously from live maintenance and sensor data. Documentation gaps, missed inspection windows, and corrective action deadlines are surfaced automatically — not discovered by auditors. Institutions with digital twin platforms have documented zero deficiencies across all compliance categories simultaneously in post-deployment audit cycles.
The twin's energy layer monitors per-building consumption continuously and identifies consumption anomalies indicating equipment faults, HVAC inefficiency, or occupancy scheduling mismatches. Occupancy-driven optimization replaces fixed-schedule programming, eliminating conditioning of empty spaces. Documented deployments achieve 15-19% energy cost reductions and 12-18% peak demand charge reductions from this layer alone.
The digital twin calculates the cost-of-deferral for every backlogged asset on live condition data — showing what a $2M deferred project costs in compounding deterioration, compliance risk, and emergency replacement probability over one, three, and five years. Board capital presentations backed by this data are approved in single sessions rather than deferred for additional information.
Credit agencies and accreditors increasingly require documented, current facility condition data in institutional assessments. The digital twin produces FCI per building from continuous IoT monitoring, multi-year capital scenarios, and deferred maintenance backlog documentation in lender-ready and accreditor-ready formats. Asset data maturity improved from 41 to 79 out of 100 in documented single-cycle deployments.
How a University Digital Twin Is Built: The Four Layers
A campus digital twin is built from four layers that each add a distinct capability. The layers work together — removing any one of them reduces the twin from a predictive system to a monitoring system. See how each layer maps to your campus infrastructure and existing sensor coverage in a demo.
All existing BAS, smart meters, HVAC sensors, electrical monitors, occupancy counters, and access control systems connected via open API without system replacement. Data from 11 or more separate source systems consolidated into a unified real-time feed. Sensor gaps supplemented where identified during asset registry build. Core integration operational in 60-90 days.
AI model processes continuous sensor feeds against asset age, usage patterns, and campus-specific deterioration rates to generate failure probability scores per asset updated in real time. Statistical anomalies flagged when sensor readings deviate beyond threshold with multi-sensor correlation before alert dispatch to reduce false positives. Model accuracy improves monthly as campus-specific data accumulates.
FCI calculated per building from continuous condition data. Five-year cost-of-deferral projections per asset generated automatically. OSHA, EPA, NFPA, ADA, and Clery Act documentation produced from live maintenance and sensor data without manual assembly. Audit packages exported on demand. Board-ready and credit-agency-ready capital presentations generated from live FCI data.
Predictive maintenance work orders generated automatically from AI condition forecasts and routed to the correct technician without manual scheduling. Summer break and low-occupancy maintenance windows populated automatically from occupancy data. Energy optimization applied continuously from occupancy signals. Planned-to-reactive ratio tracked in real time with accountability reporting per department.
Documented Outcomes From University Digital Twin Deployments
Results from university and K-12 deployments on existing operational budgets. No additional headcount in any documented case. Get outcome documentation specific to your institution's portfolio size and existing infrastructure.
Planned preventive work replaces reactive emergency dispatch at 3-5x cost differential. Reactive maintenance share drops from 31% to 9% of total spend within 18 months.
AI failure prediction converts emergency events into scheduled planned work. The shift accounts for approximately $610,000 in annualized savings per deployment at average cost differentials.
Live FCI replaces stale inspection estimates in capital scoping. For a $20M annual capital program, this variance reduction avoids $3.2M in annual overrun costs.
Occupancy-driven optimization from the twin's energy layer eliminates conditioning of empty spaces. For a $3M annual energy spend, a 17% midpoint reduction produces $510,000 in annual savings.
Automated documentation from live twin data eliminates the 140-hour manual assembly burden per compliance cycle, achieving zero deficiencies across all frameworks simultaneously.
The largest single-cycle maturity improvement recorded in state benchmarking reports. Directly informs credit agency and accreditor assessments of institutional stewardship quality.