The plant floor at a mid-sized automotive supplier hums with a familiar tension. A line supervisor watches a real-time dashboard showing a critical station's cycle time creeping up by 0.4 seconds per part. He knows this drift, if uncorrected, will cost 2,300 units of lost throughput by the end of the shift. Across the plant, the maintenance team is unaware — they're firefighting a coolant pump alarm on a different line. The quality manager is reviewing a batch of 200 parts that just failed a dimensional check, and the supply chain planner is wondering why the daily material consumption report is two hours late. This is the reality of disconnected manufacturing data — where the visibility needed to prevent a cascading loss of $47,000 in a single day is scattered across five different systems, none of which talk to each other.
One Platform to See, Understand, and Control Every Corner of Your Plant Floor
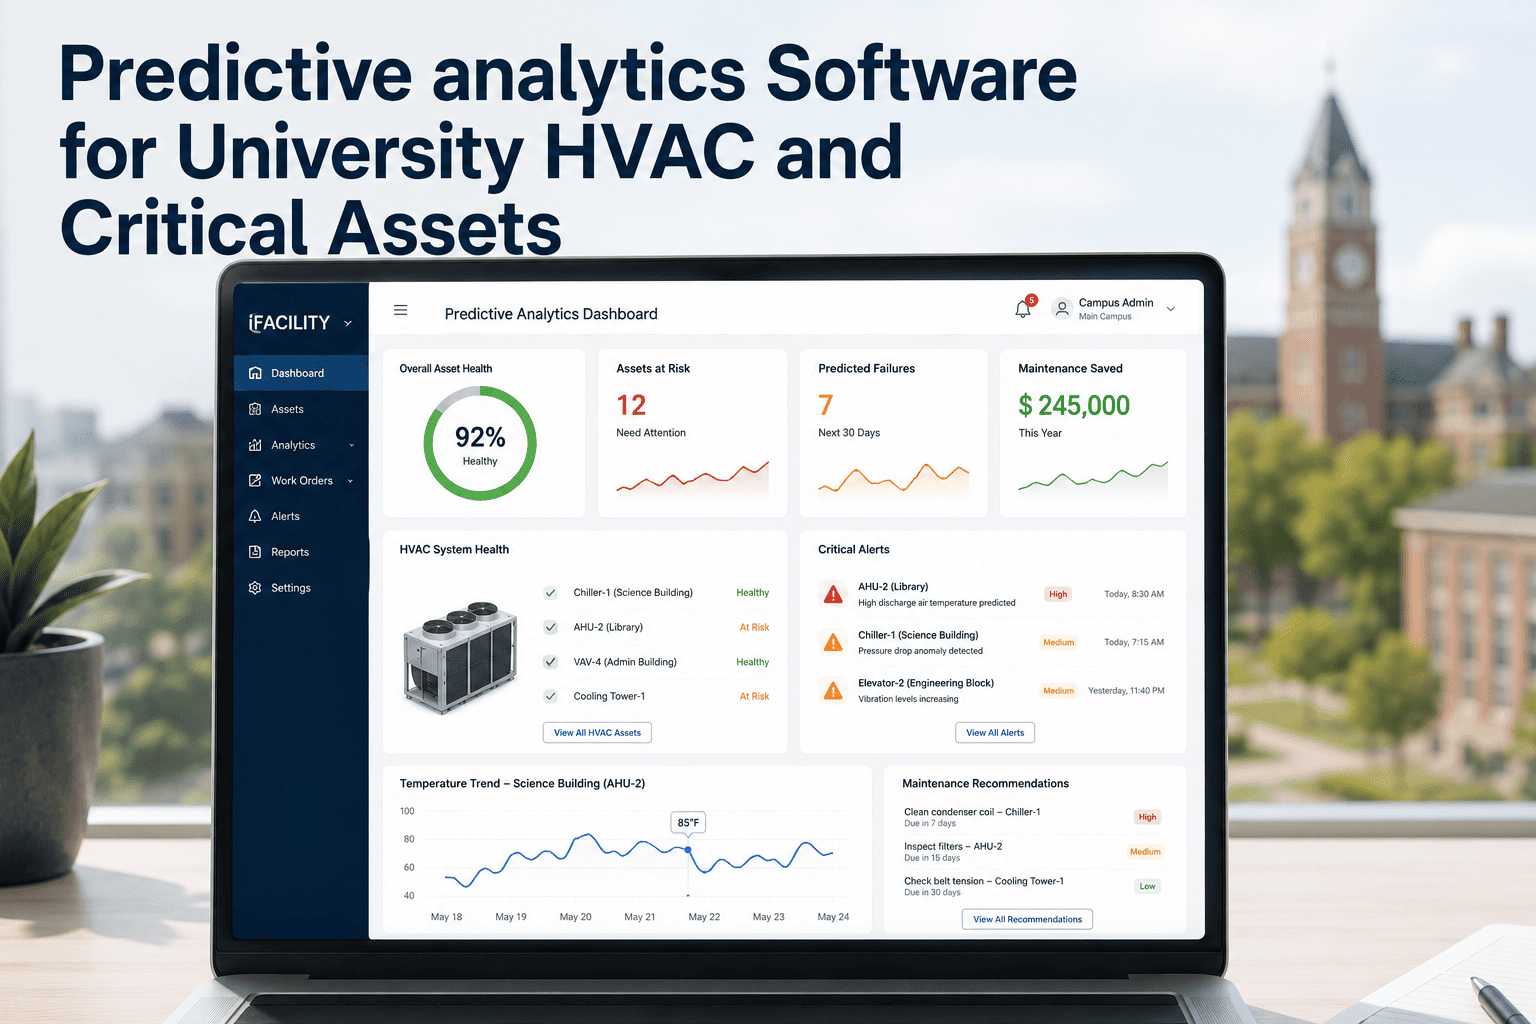
Stop managing manufacturing data in silos. iFactory gives you a unified, real-time view of production, quality, maintenance, and energy — without cloud dependency or months of integration.
iFactory is not a point solution. It is an AI-native manufacturing intelligence platform that absorbs the operational roles of legacy plant systems — from production monitoring to quality analytics, from energy management to predictive maintenance — and delivers them through a single, on-premise appliance. The platform connects directly to your PLCs, SCADA, CMMS, and MES data sources, ingests and normalizes that data in real time, and surfaces actionable insights through role-specific dashboards, automated alerts, and AI-driven predictions. There is no data leaving your network. There is no multi-year deployment. The pilot delivers a working, integrated view of your plant within one quarter.
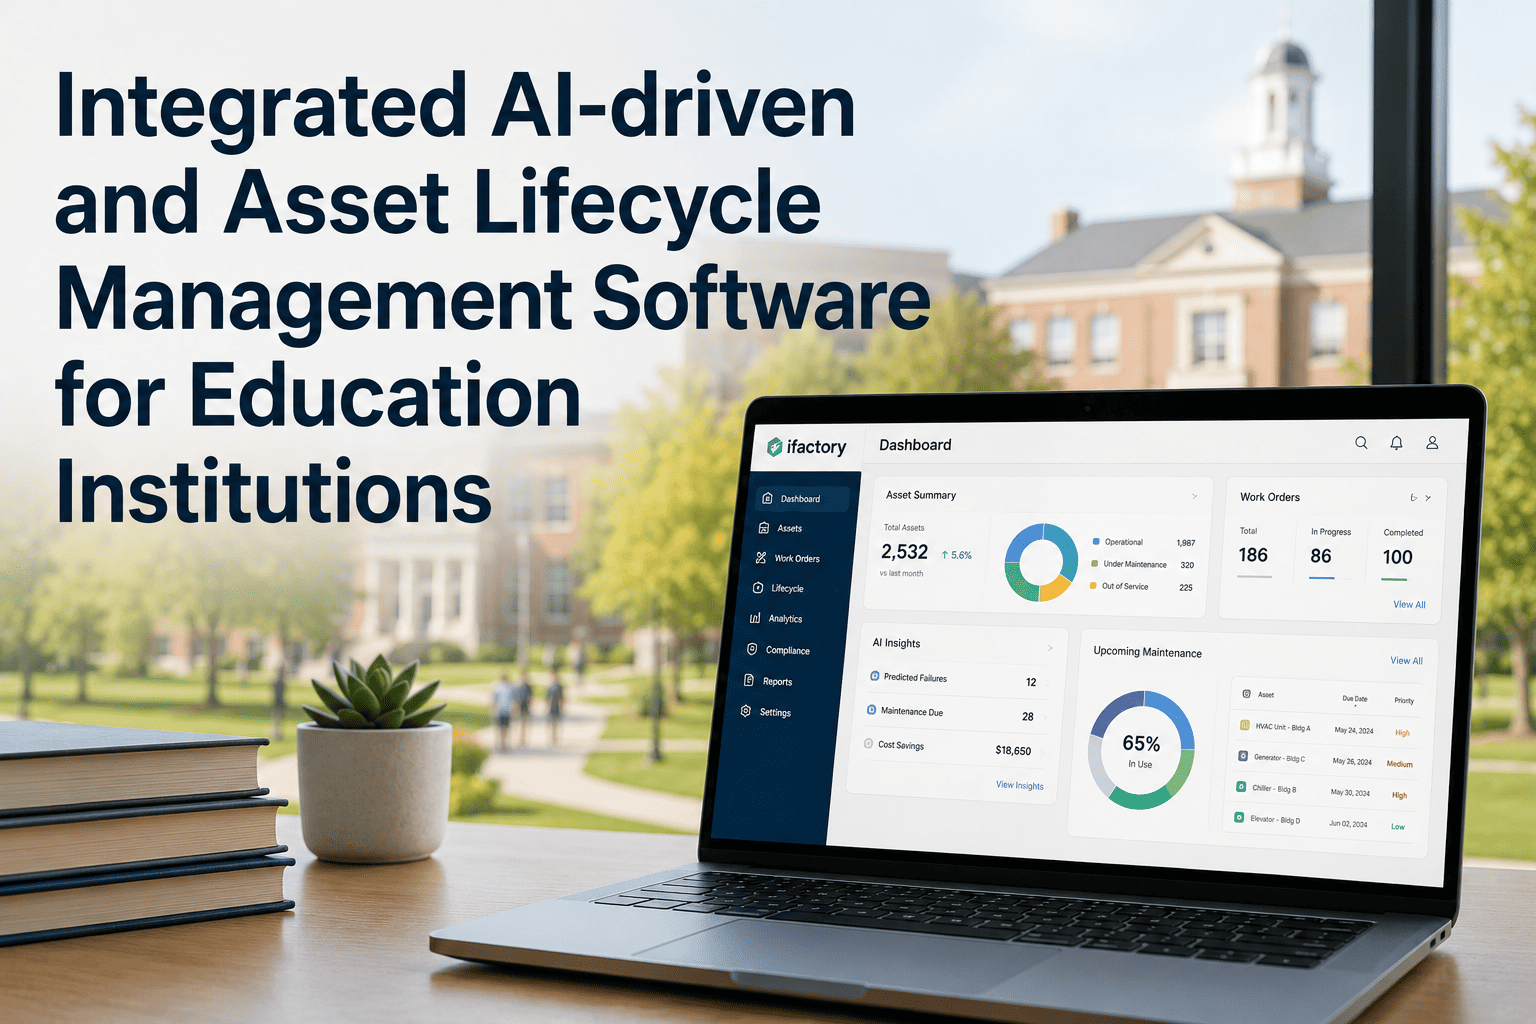
A Complete Manufacturing Operations Platform, Delivered in One Appliance
Six core capabilities, grouped by domain, that replace the need for multiple standalone systems and the data integration projects that connect them.
Real-Time OEE & Throughput Tracking
Monitor overall equipment effectiveness, cycle times, and throughput for every machine and line in real time. Alerts trigger automatically when performance deviates from target, enabling immediate corrective action before losses compound.
Automated Production Scheduling
Ingest order data from your ERP and schedule production across lines based on real-time equipment availability, material status, and changeover constraints. The AI recommends optimized sequences and updates the schedule dynamically as conditions change.
In-Process Quality Analytics
Connect to gauges, CMMs, and vision systems to collect dimensional and attribute data in real time. Statistical process control charts update automatically, and out-of-control conditions generate alerts that stop the line or trigger a containment workflow.
AI-Driven Defect Prediction
Train AI models on historical quality data and real-time process parameters to predict defect risk before a part is made. The system recommends parameter adjustments to prevent non-conformance and reduce scrap by up to 30%.
Predictive & Condition-Based Maintenance
Ingest vibration, temperature, current, and other sensor data to predict equipment failures 2–14 days in advance. Maintenance work orders are generated automatically and prioritized by production impact, reducing unplanned downtime by up to 45%.
Real-Time Energy & Utility Monitoring
Track electricity, compressed air, cooling water, and natural gas consumption per machine, line, or plant. AI identifies abnormal consumption patterns and correlates them with production events, enabling targeted energy reduction of 8–15%.
From Data Source to Actionable Insight in Four Steps
The platform is designed for rapid deployment and immediate value. No cloud, no data egress, no complex integration projects.
Connect
iFactory connects directly to your PLCs, SCADA, CMMS, MES, and ERP systems via standard industrial protocols. No middleware, no data transformation scripts.
Ingest & Normalize
The platform ingests data from all sources in real time, normalizing it into a unified data model that spans production, quality, maintenance, and energy domains.
Analyze & Predict
Built-in AI models analyze the unified data stream to detect anomalies, predict failures, and recommend optimal actions. Models are trained on your plant's specific data and improve over time.
Act & Automate
Role-specific dashboards, automated alerts, and direct integrations with control systems and work order management enable immediate action. The platform can automatically adjust parameters or trigger workflows.
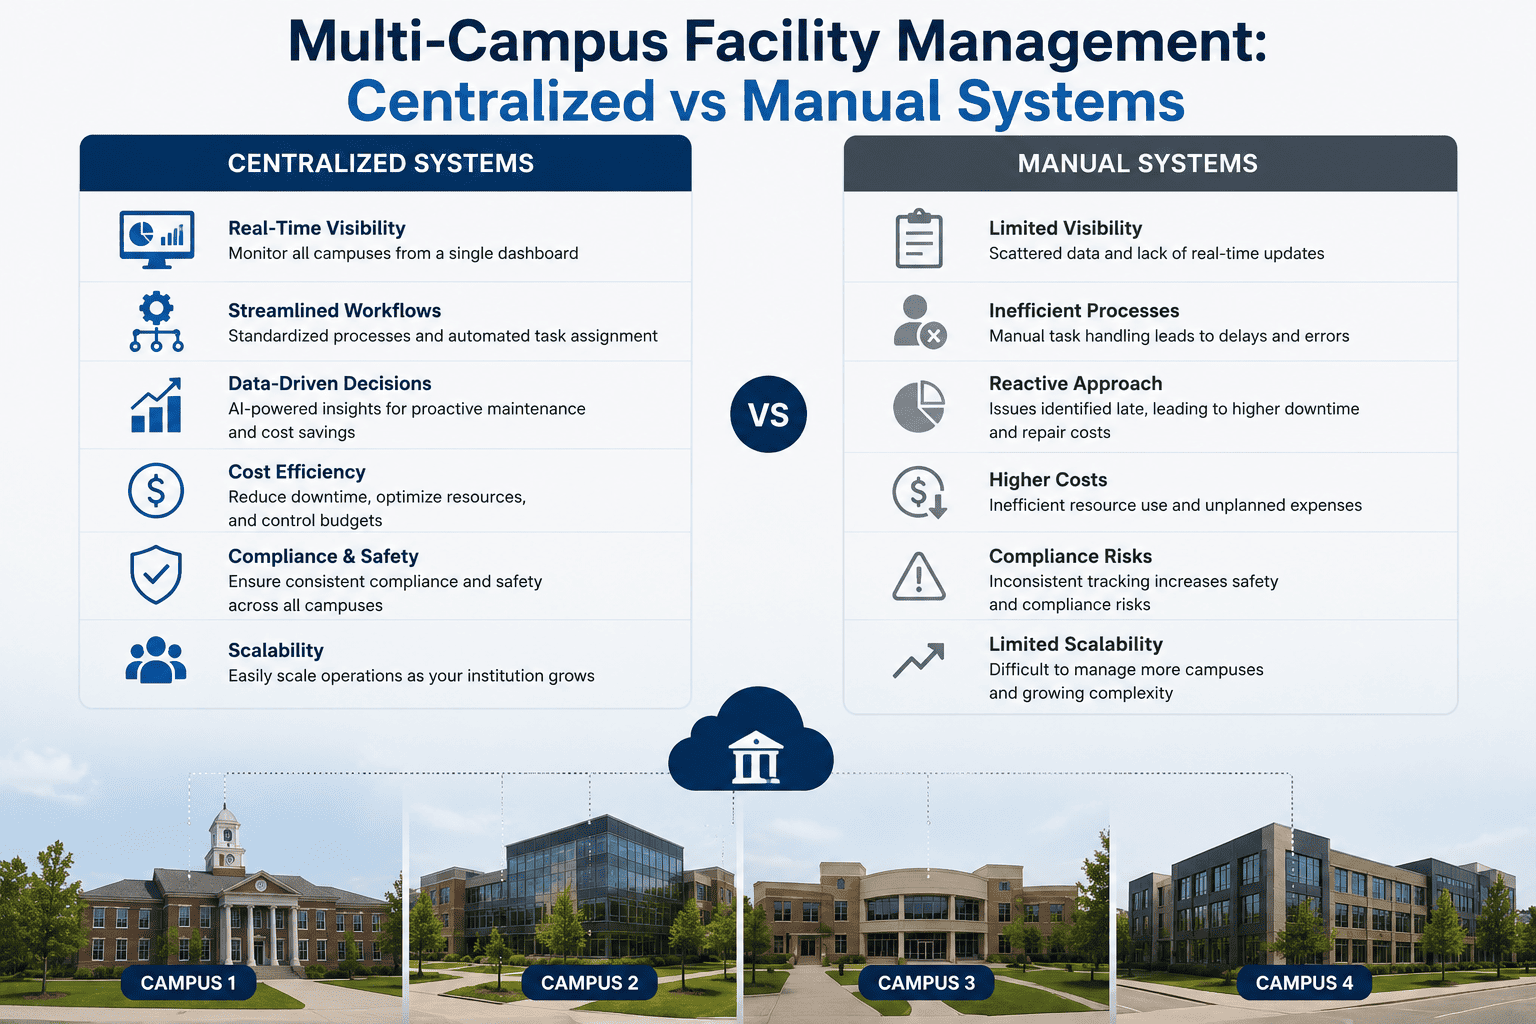
The Real Cost of Disconnected Plant Data
When production, quality, maintenance, and energy data live in separate systems, the plant operates blind to the interactions that drive cost and risk. Here is what that fragmentation costs every day.
Lost Throughput from Unseen Drift
A 0.3-second cycle time increase on a 24-station line operating at 85% utilization goes undetected for two shifts. The cumulative loss: 1,800 units at $22 margin each = $39,600.
Scrap from Delayed Quality Feedback
A vision system detects a dimensional drift but the data is batched and reviewed hourly. In that hour, 480 parts are produced outside spec. Scrap cost at $4.50 per part: $2,160.
Emergency Maintenance from Missed Warning Signs
A bearing vibration trend on a critical conveyor motor is visible only in the CMMS data, reviewed weekly. The bearing fails mid-shift, causing 4 hours of downtime at $1,200 per minute: $288,000.
What a Unified Platform Delivers in the First Year
These are the documented results from iFactory deployments across mid-to-large manufacturing plants. Your actual results depend on plant size, current baseline, and deployment scope.
See how a single platform replaces five standalone systems and delivers a unified view of your plant in one quarter. Book a 30-min walkthrough and we'll show you live on your data.
Questions Plant Operators Ask About a Unified Platform
Stop Managing Manufacturing Data in Silos
One platform. One appliance. One quarter to pilot. See what a unified view of your plant floor looks like with your own data.