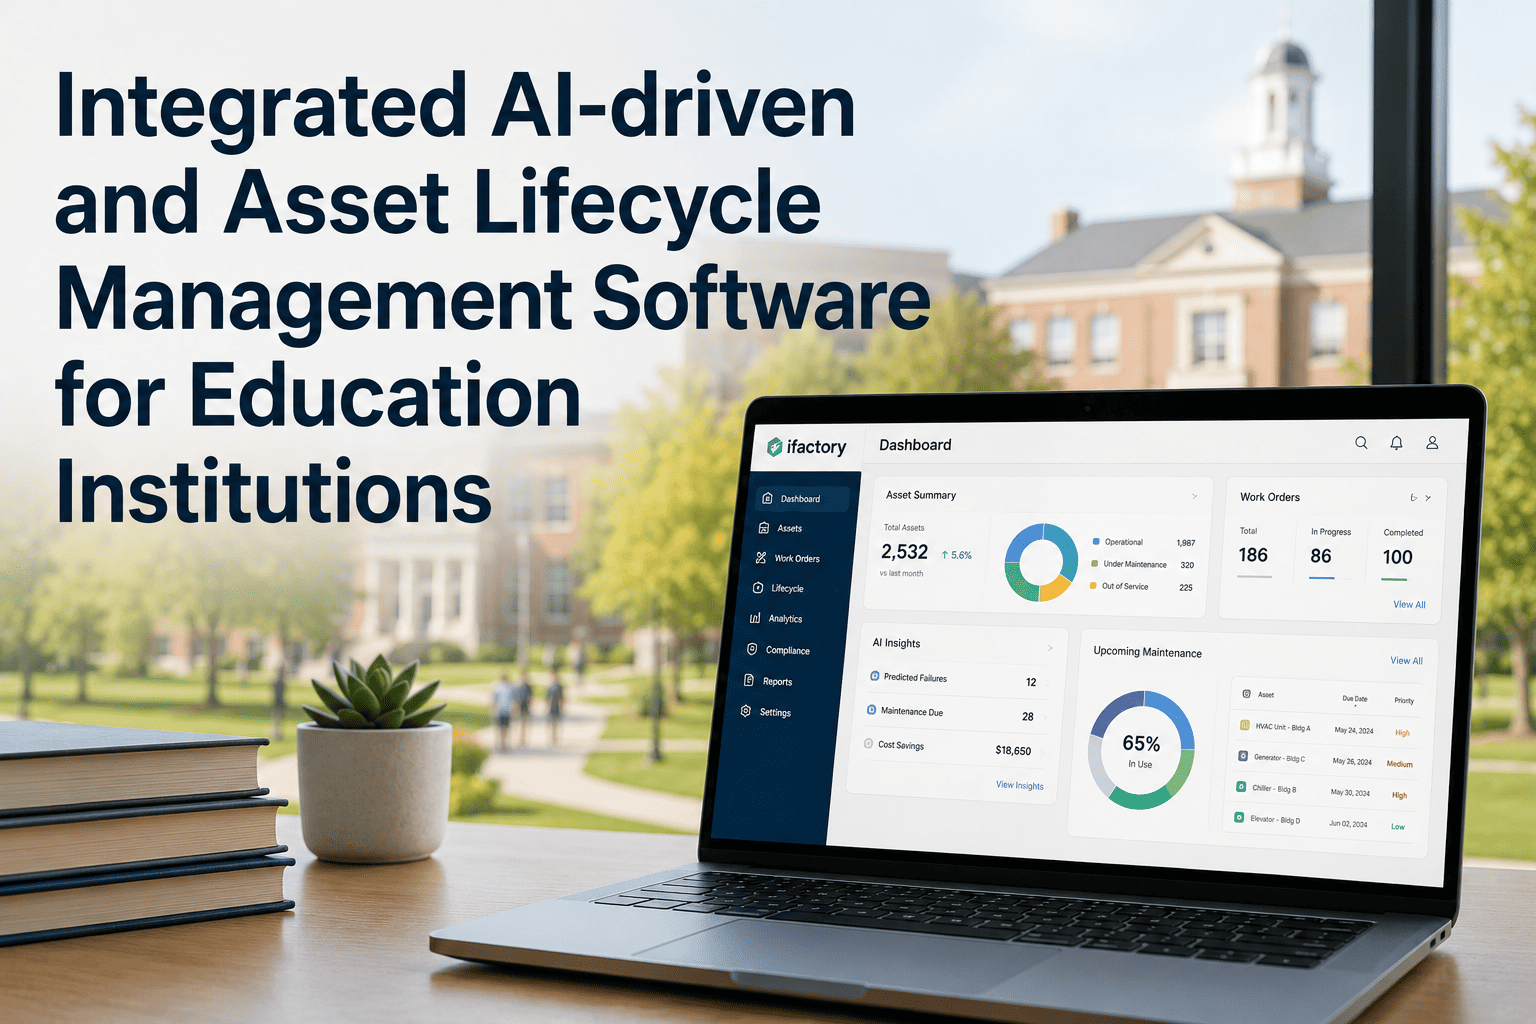
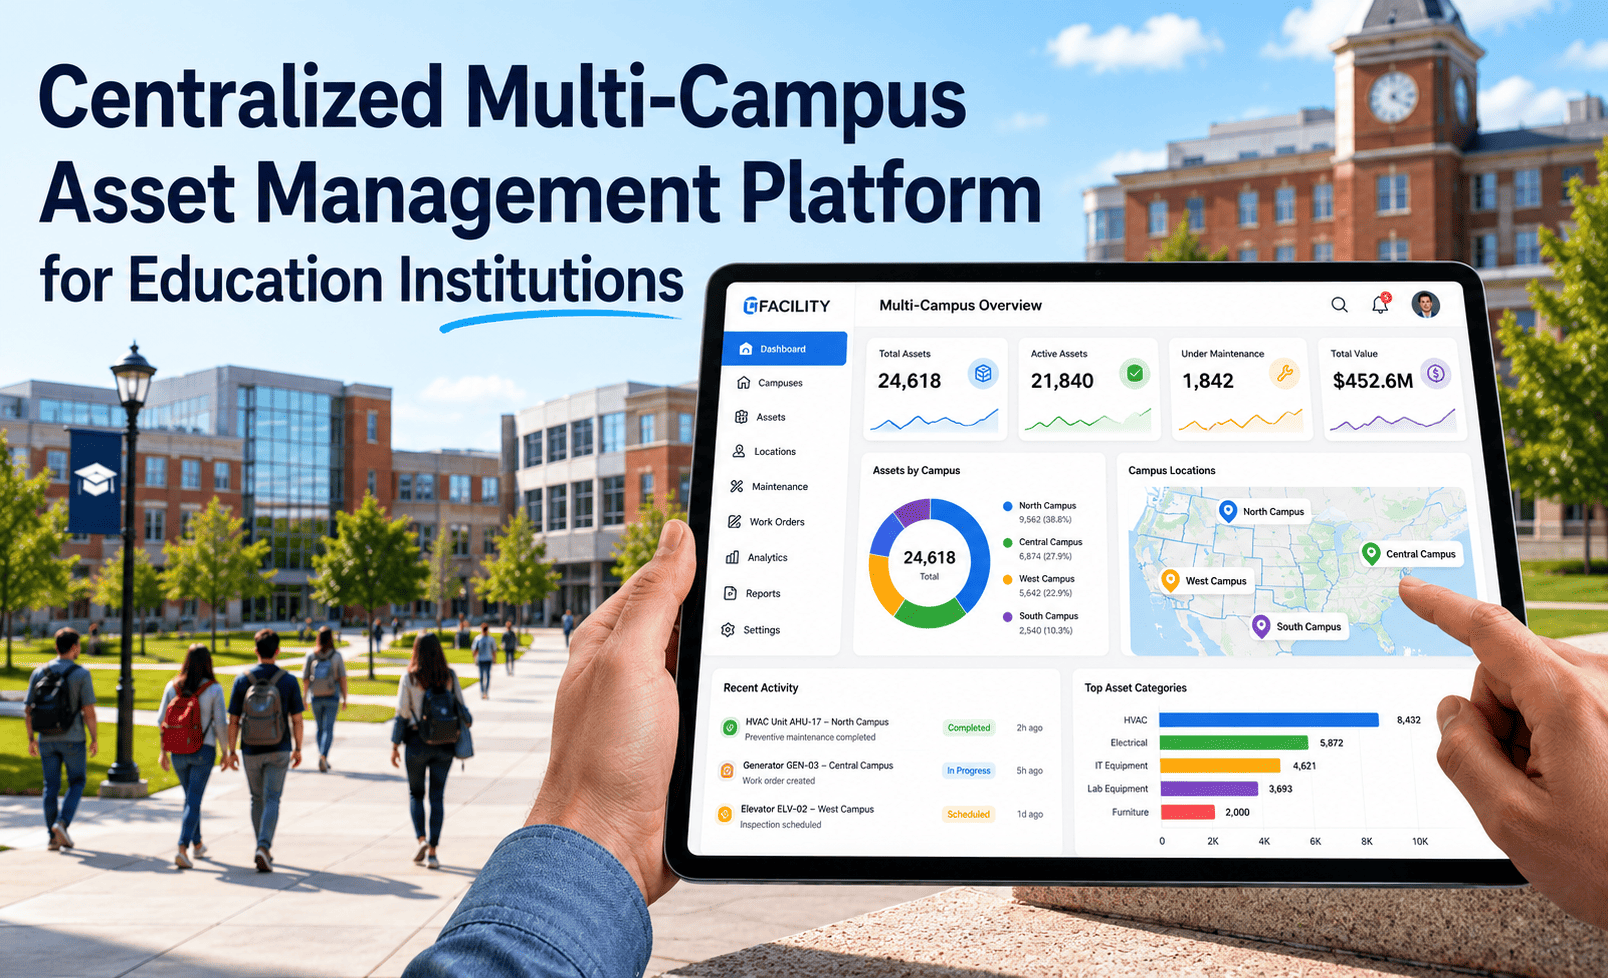
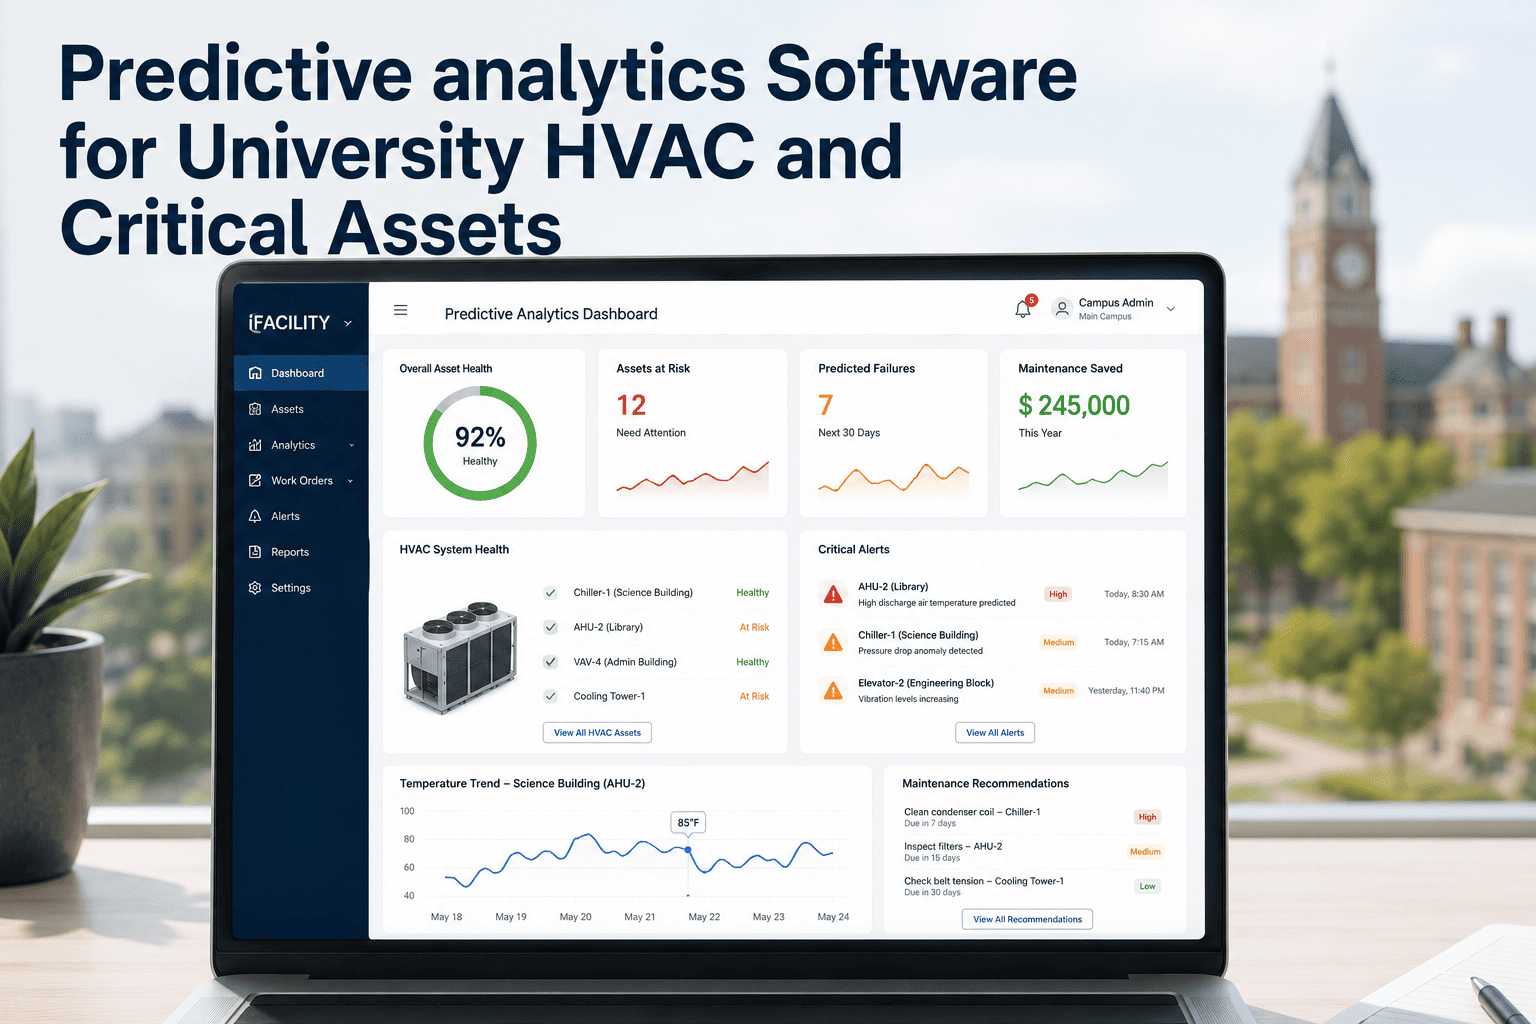
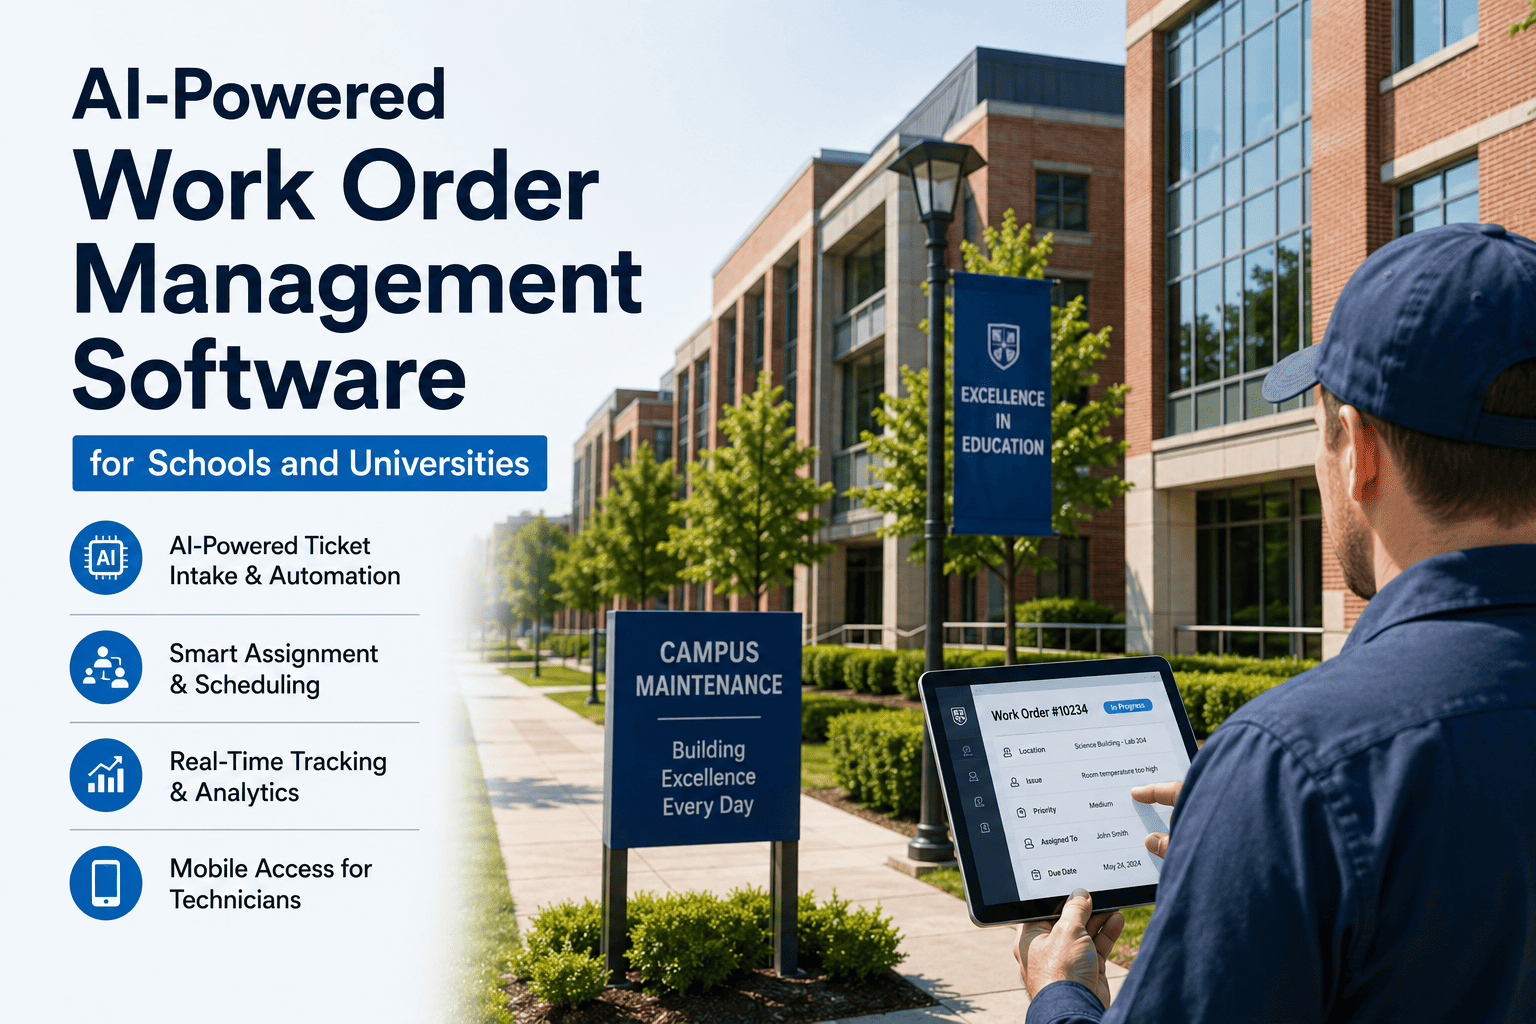
Across K-12 districts and university campuses, a quiet crisis is consuming budgets that should be funding classrooms, faculty, and students. Poor asset lifecycle management costs U.S. educational institutions billions annually in avoidable emergency repairs, compliance penalties, and deferred capital decisions made without current condition data. With enrollment pressures reducing revenue, OSHA and EPA requirements tightening compliance costs, and credit agencies now factoring deferred maintenance documentation into institutional assessments, schools still operating reactively are not just spending more. They are borrowing more and planning less. Book a Demo to see how AI-driven asset management transforms your campus from reactive to predictive.
Why Campus Asset Management Demands Attention in 2026
Universities operate some of the most complex asset ecosystems in the world. From high-value laboratory instruments and medical simulation equipment to IT infrastructure, HVAC systems, and classroom technology, a mid-size campus may manage tens of thousands of individual assets simultaneously. Yet most institutions still rely on disconnected spreadsheets, manual inspection cycles, and reactive maintenance schedules that drain budgets and accelerate equipment degradation.
Three converging forces make 2026 a defining year for campus asset management. Enrollment revenue pressures are reducing per-student budgets while fixed facility costs remain constant. New federal compliance mandates are adding cost pressure that reactive budgets cannot absorb. Credit agencies now explicitly factor deferred maintenance documentation into institutional credit assessments, meaning universities that cannot substantiate their asset condition pay higher borrowing rates. Book a Demo to map these pressures to your campus asset profile.
The Hidden Costs: What Poor Asset Management Actually Costs Universities
The problem with reactive asset management is that most of its cost never appears on a single line item. Emergency repair overruns are buried in contingency funds. Compliance penalties are categorized as legal expenses. Lost instructional time from a broken HVAC unit is absorbed as a scheduling disruption rather than a facilities cost. The true price only becomes visible when measured systematically and the numbers are significant across every institution type.
Without lifecycle tracking, install dates, replacement schedules, or condition scoring, replacement needs are discovered only after failures occur at 3-5x planned cost. Emergency budgets consume 60-75% of available maintenance spend at peak reactive failure rates, leaving preventive programs perpetually underfunded.
2026 Compliance Pressures Making Reactive Operations Indefensible
For years, reactive asset management was tolerated as a funding problem. In 2026 it has become a compliance and creditworthiness problem. Three regulatory and financial developments are eliminating the margin for institutions that cannot document asset condition and maintenance performance systematically.
New federal rule requires documented HVAC maintenance schedules and temperature monitoring records in all occupied spaces. Reactive operations with no maintenance records cannot demonstrate compliance and face penalty exposure on every building without documentation.
Lead, air quality, and chemical exposure testing now require documented facility condition baselines and maintenance histories. Schools without continuous data systems face retroactive testing costs, remediation exposure, and enforcement action that reactive paper trails cannot defend against.
Credit agencies now explicitly factor deferred maintenance backlogs into institutional credit assessments. The university that can present a documented asset condition registry with remediation trajectory borrows at a lower rate than the one that cannot. Undocumented backlogs translate directly to higher debt service costs year over year.
The Solution: AI-Driven Asset Lifecycle Management for Campuses
The shift from reactive to predictive asset management is not a technology purchase. It is an operational transformation. Institutions that have made this transition report documented cost reductions of 18-30% on the same budget, 60-75% fewer emergency work orders, and equipment lifespans extended by up to 40%. The platform capabilities that enable this outcome operate across six integrated functions that replace every siloed spreadsheet-dependent process. Book a Demo to see how each function applies to your campus asset portfolio.
- All buildings, systems, and equipment in a single tracked record with full lifecycle data
- Install dates, lifecycle estimates, and condition scores maintained per asset continuously
- Cross-building deduplication eliminates conflicting records across departments
- Real-time sync removes manual data transfer and reconciliation burden from staff
- Deterioration modeling predicts condition changes between physical inspections continuously
- Asset health score calculated per item and updated automatically in real time
- Alert triggers notify managers when condition thresholds are breached before failure
- Condition data never more than 30 days stale versus 18-26 months at reactive institutions
- Preventive work orders generated from AI condition forecasts without manual scheduling
- Summer break scheduling for major turnarounds and renovations automated
- PM completion rates tracked by building, department, and asset class in real time
- Planned-to-reactive maintenance ratio monitored with department-level accountability
- All capital requests scored on a unified defensible methodology across asset categories
- Multi-year replacement scenarios modeled with live condition data replacing stale estimates
- Five-year total cost of deferral calculated per asset to support board presentations
- Board-ready and lender-ready audit package export available in one click
- Continuous usage data reveals which assets are over or underutilized across campus
- Cross-department sharing opportunities identified and scheduling conflicts flagged
- Documented deployments show 15-30% improvement in asset utilization rates
- Evidence-based procurement decisions replace assumption-driven capital requests
- OSHA, EPA, ISO, and accreditation compliance documentation generated automatically
- Maintenance history records current and exportable for every tracked asset at all times
- Accreditation and state reporting packages produced on demand without manual assembly
- Credit-agency-ready deferred maintenance documentation with condition trajectory reporting
Asset Categories Across University Campuses
Effective campus asset management requires tailored approaches for different equipment categories, each with distinct lifecycle characteristics, compliance requirements, and utilization patterns. The platform manages all categories from a single unified interface.
| Asset Category | Typical Lifespan | Key Maintenance Driver | Primary Compliance Requirement | AI Impact Area |
|---|---|---|---|---|
| Laboratory Instruments | 8-15 years | Calibration frequency | ISO / GLP certification | Predictive calibration scheduling |
| IT Infrastructure | 4-7 years | Performance degradation | Data security audits | Utilization and refresh forecasting |
| HVAC and Facilities | 15-25 years | Energy efficiency | Building code compliance | Failure prediction from sensor data |
| Medical Simulation Equipment | 7-12 years | Regulatory inspection | Accreditation body standards | Inspection scheduling and audit logs |
| AV and Classroom Technology | 5-8 years | Usage wear | Accessibility standards | Utilization tracking and scheduling |
| Research Vehicles and Fleet | 8-12 years | Mileage and service intervals | DOT and safety regulations | Mileage-based predictive maintenance |
| Grounds and Maintenance Equipment | 10-20 years | Seasonal usage cycles | OSHA safety standards | Seasonal scheduling optimization |
The Transition Path: From Reactive to Predictive in Four Phases
Transitioning from reactive to predictive campus asset management does not require a budget increase or a service disruption. The program is structured in four phases sequenced to deliver measurable compliance and cost outcomes first while building the long-term AI model that makes predictive scheduling increasingly accurate over time. Core data integration and initial condition scoring are operational within 60-90 days of deployment.
- All campus asset systems connected to unified platform via open API
- Asset registry standardized and validated across all buildings and departments
- Condition data age reduced from 18-26 months to 8 months average
- All facilities staff onboarded and operational in under 12 hours
- AI condition scoring engine active across all campus asset classes
- Automated PM scheduling live for HVAC, lab, electrical, and facility systems
- Reactive maintenance rate begins structural measurable decline
- First compliance-ready reporting cycle produced automatically
- Capital planning dashboard deployed across all campus departments
- Asset condition index calculated per building in board-ready capital request format
- Five-year cost-of-deferral modeling activated for all critical assets
- Emergency work orders down 40-60% from pre-deployment baseline
- 18-30% total maintenance cost reduction fully documented
- Condition data under 30 days for all asset classes across campus
- Equipment lifespan extension of 40% documented across tracked categories
- AI model sharpens continuously as campus-specific data accumulates
Results: What AI-Driven Asset Management Delivers for Universities
Across university campuses and K-12 districts, the transition to AI-driven predictive asset management has produced documented measurable outcomes across cost, compliance, capital planning, and staff efficiency. All results are measured against the same operational budget with no additional funding allocated. Book a Demo to see how these outcomes translate to your institution's specific asset portfolio.
| Metric | Reactive Baseline | AI-Driven Platform | Change |
|---|---|---|---|
| Equipment Lifespan | Premature replacement | Up to 40% extension documented | +40% |
| Maintenance Cost per Sq Ft | $4.85 average reactive | $3.40-$3.99 documented | -18% to -30% |
| Emergency Work Orders | 60-75% of total budget | 60-75% fewer events | -60% to -75% |
| Asset Condition Data Age | 18-26 months average | Under 30 days | -98% |
| Equipment Utilization Rate | Under 40% average | 15-30% improvement documented | +15% to +30% |
| Compliance Audit Deficiencies | Undocumented exposure | Zero findings documented | -100% |
| Capital Planning Defensibility | Anecdotal crisis requests | Data-backed single-session approvals | Transformational |
| Staff Hours per Reporting Cycle | Approx 140 hrs manual | Approx 18 hrs automated | -87% |
| Capital Project Cost Variance | 22% average overage | 6% average documented | -73% |
Key Benefits for Universities and School Districts
The transition to AI-driven predictive asset management delivers compounding value across budget performance, compliance standing, capital credibility, and long-term institutional sustainability. Each outcome reinforces the institution's ability to serve students in an increasingly resource-constrained environment where every dollar lost to reactive overruns competes directly with instructional investment.
Condition-based maintenance prevents premature failure, eliminates maintenance gaps from poor record-keeping, and monitors environmental factors that silently shorten equipment life. Each contributor applies simultaneously across thousands of assets, compounding savings year over year without additional capital expenditure.
AI-driven scheduling converts reactive emergency spend at 3-5x planned cost into preventive work orders that cost a fraction of the emergency equivalent. The savings compound annually as the model sharpens with campus-specific data and seasonal operational patterns unique to each institution.
Condition-backed capital plans with five-year cost-of-deferral analysis replace anecdotal crisis summaries. Documented deployments show boards approving full capital requests in single sessions when asset condition data is current and defensible rather than estimated costs based on assessments years out of date.
The 2026 compliance environment requires documentation that reactive operations cannot produce: maintenance schedules, condition records, and testing histories across all occupied spaces and regulated equipment. The platform generates all required reports automatically from live data, eliminating manual assembly burden simultaneously.
Continuous usage data surfaces which expensive assets sit idle for 70% of available hours, which assets are shared inefficiently between buildings, and where scheduling conflicts are driving shadow procurement. These insights directly inform capital planning decisions and prevent duplicate purchases across departments.
Each month of platform operation adds campus-specific deterioration data that improves AI model accuracy, sharpens PM scheduling, and reduces capital cost variance. The cost savings documented at month 18 are a documented floor. The trajectory is upward as the model matures and the institution accumulates multi-year condition history.
Conclusion
Poor asset lifecycle management is not a symptom of underfunding. It is a cause of it. U.S. universities spend billions annually on avoidable emergency repairs, compliance exposure, and capital decisions made without current data. In 2026, with enrollment revenue declining, compliance requirements tightening, and credit agencies evaluating asset documentation, the cost of remaining reactive is no longer purely financial. It is institutional.
The institutions achieving 40% equipment lifespan extension, 18-30% cost reductions, 60-75% fewer emergencies, and clean compliance audits are not operating on larger budgets. They are operating on better data. AI-driven predictive asset management platforms convert the same maintenance dollar from reactive emergency spend into planned preventive work and generate the capital planning documentation that gives boards confidence to fund infrastructure rather than defer it indefinitely.
The cost of deploying AI-driven asset management infrastructure is fixed and quantifiable. The cost of the reactive liability it prevents is neither. Book a Demo or Contact Support to begin quantifying your institution's reactive asset management exposure today.