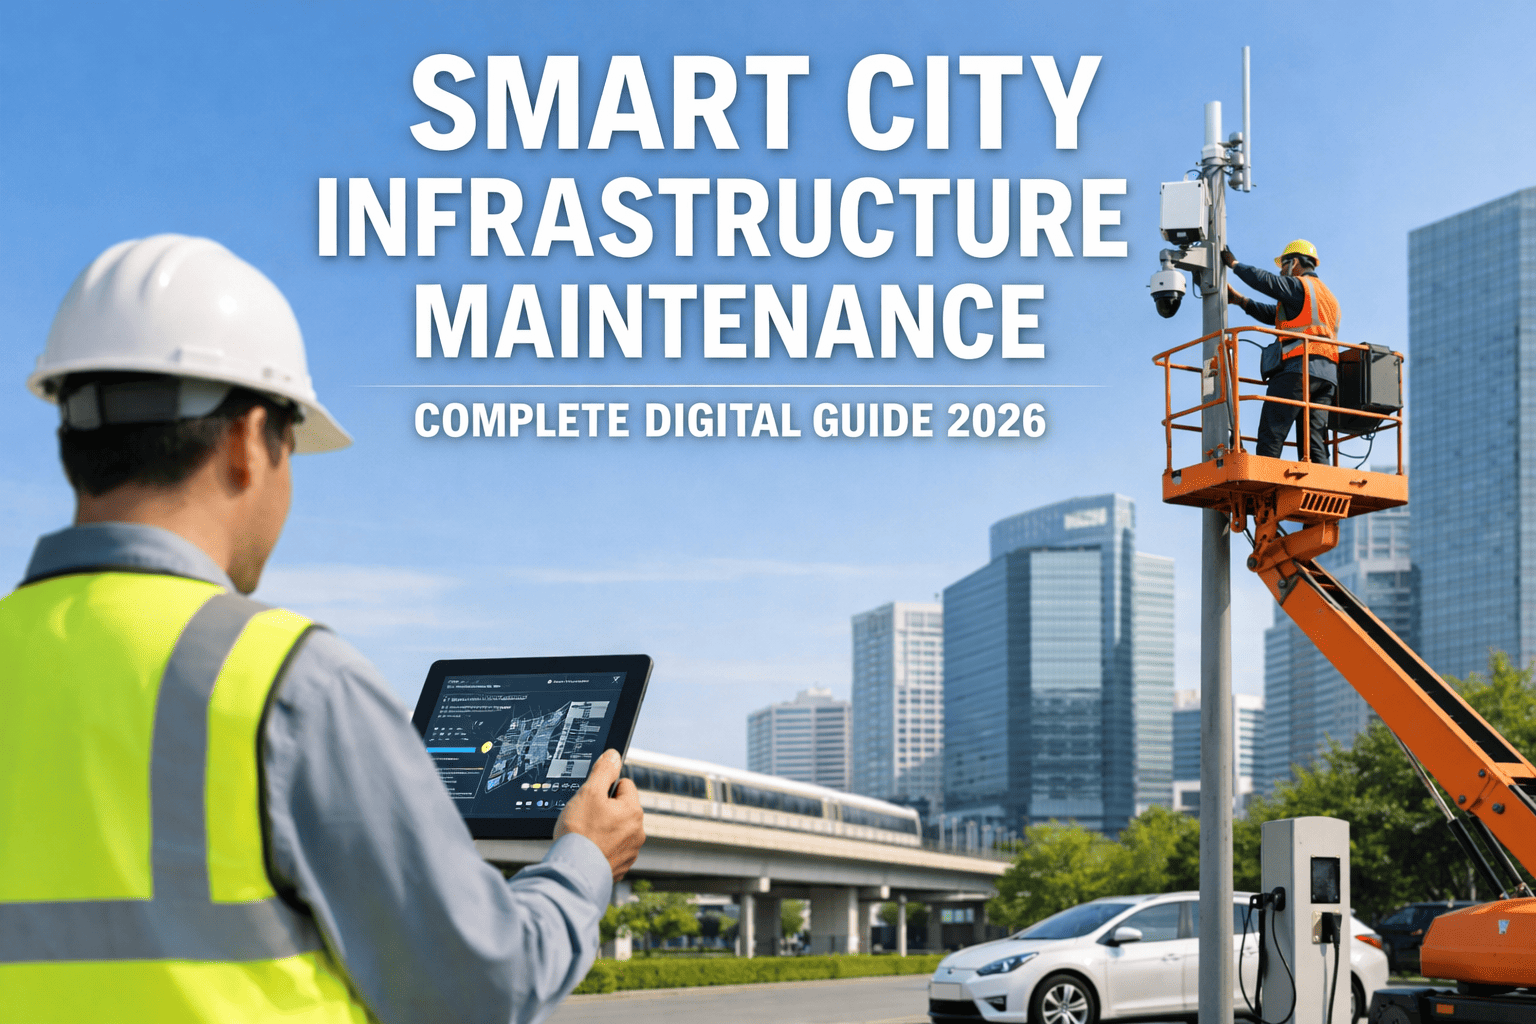
Every smart city initiative lives or dies by the quality of its sensor data. Air quality monitors, weather stations, noise detectors, traffic counters, and water quality probes collectively generate millions of data points daily—each one feeding the algorithms, dashboards, and automated systems that city administrators rely on for decisions affecting public health, transportation, and environmental policy. When sensors drift out of calibration or degrade without detection, the downstream consequences range from inaccurate pollution reports to misallocated emergency resources. This guide breaks down the maintenance and calibration practices that keep municipal IoT sensor networks accurate, compliant, and cost-effective across their full operational lifecycle. Talk to our infrastructure support team to evaluate your city's current sensor maintenance posture.
How IoT Sensor Networks Power Modern Smart Cities
Smart city sensor networks are interconnected systems of environmental, structural, and traffic monitoring devices that collect real-time data across urban landscapes. Unlike isolated monitoring equipment, these networks communicate through wireless protocols—LoRaWAN, NB-IoT, cellular, and mesh topologies—feeding centralized platforms where AI and analytics transform raw readings into actionable urban intelligence.
Environmental Monitoring
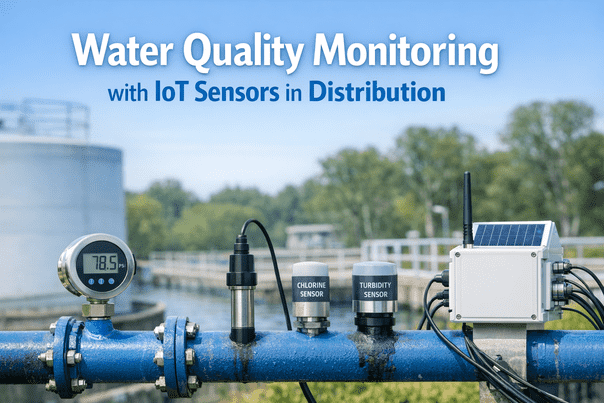
PM2.5, PM10, NO2, O3, CO, and SO2 sensors track air quality in real time. Water quality probes monitor pH, dissolved oxygen, and turbidity in rivers and reservoirs. These sensors form the foundation for public health alerts and regulatory compliance reporting.
Noise & Acoustic Mapping
Class 1 and Class 2 sound level meters measure ambient decibel levels with frequency weighting across residential zones, construction corridors, and nightlife districts. Data feeds noise policy enforcement and urban planning decisions.
Weather & Climate Stations
Multi-parameter stations capture temperature, humidity, barometric pressure, wind speed and direction, rainfall, and solar radiation. Data supports flood warning systems, heat advisories, and infrastructure resilience planning.
Traffic & Mobility Sensing
Radar, LiDAR, infrared, and inductive loop detectors count vehicles and pedestrians, measure speed, and classify vehicle types. This data optimizes signal timing, identifies congestion patterns, and informs transportation planning.
$15B
Projected global smart city IoT sensor market size in 2025, growing at 15% CAGR
150M+
IoT sensor units shipped globally for smart city applications in recent years
10-30%
Improvement in quality-of-life indicators enabled by smart city sensor technology
Why Sensor Calibration Accuracy Determines Smart City Success
Calibration is the process of comparing a sensor's output against a known reference standard and adjusting its readings to minimize error. In municipal sensor networks, calibration accuracy is not optional—it directly determines whether environmental data meets regulatory standards, whether public health alerts trigger at the correct thresholds, and whether infrastructure budgets are allocated based on reality rather than drift-corrupted data.
Sensors deployed outdoors in urban environments face aggressive calibration challenges: daily temperature swings stress electronic components, airborne pollutants poison electrochemical cells, UV radiation degrades optical elements, and humidity infiltration corrupts sensitive measurement circuits. Every sensor type drifts at a different rate, and without structured calibration programs, data quality degrades invisibly—producing readings that look plausible but are silently wrong.
Not sure which calibration standards apply to your municipal sensors? Our infrastructure team helps cities identify the right reference methods and compliance requirements for every sensor type in their network.
Reach out to iFactory support for a calibration compliance review.
Air Quality Sensor Drift: Causes, Detection, and Prevention
Air quality sensors are the most maintenance-intensive devices in any smart city network. Electrochemical gas cells degrade from continuous exposure to target pollutants, optical particle counters accumulate dust on internal optics, and cross-sensitivity to non-target gases introduces measurement bias that worsens over time. Understanding the specific drift mechanisms for each sensor type is essential for designing effective maintenance responses.
Electrochemical Gas Sensors
Primary Drift Cause
Electrolyte depletion and electrode poisoning from prolonged pollutant exposure
Detection Method
Increasing baseline offset between zero calibrations; slower response time to concentration changes
Typical Lifespan
18-24 months before replacement is necessary
Prevention
Quarterly zero/span calibration; protective diffusion barriers; avoid continuous high-concentration exposure
Optical Particle Counters
Primary Drift Cause
Dust accumulation on laser optics and photodetectors; light source degradation over years
Detection Method
Declining R-squared correlation when compared against reference gravimetric measurements
Typical Lifespan
3-5 years with proper maintenance
Prevention
Monthly intake filter cleaning; quarterly reference collocation; firmware correction factor updates
Humidity & Temperature Probes
Primary Drift Cause
Capacitive humidity elements degrade from prolonged saturation; thermal cycling stresses RTD elements
Detection Method
Persistent offset remaining after calibration correction; sluggish response to rapid environmental changes
Typical Lifespan
2-5 years depending on exposure severity
Prevention
Semi-annual rotation with factory-calibrated spares; radiation shields for outdoor temperature probes
Stop Silent Data Degradation Across Your Sensor Network
iFactory gives municipalities a centralized platform to track calibration drift, automate maintenance scheduling, and generate compliance-ready audit trails across thousands of sensor nodes—so every data point your city relies on stays accurate.
Seasonal Maintenance Protocols for Weather Stations
Weather stations require maintenance cycles aligned to seasonal conditions, not just calendar intervals. Spring pollen clogs intake filters, summer heat accelerates capacitor aging, autumn debris accumulates in rain gauges, and winter ice damages anemometer bearings and freezes tipping bucket mechanisms. A seasonally-aware maintenance program prevents the most common weather station failure modes before they compromise data integrity.
Spring
Deep-clean all intake filters and radiation shields clogged by pollen
Inspect and clear rain gauge funnels of debris and insect nests
Verify humidity probe accuracy after winter condensation exposure
Test solar panel output and clean photovoltaic surfaces
Summer
Check temperature probe radiation shield ventilation for heat bias
Inspect UV sensor optical surfaces for degradation
Verify battery health under peak solar charge cycles
Confirm data transmission stability during high-temperature periods
Autumn
Clear fallen leaves from wind sensors and rain gauges
Perform annual anemometer bearing inspection or swap
Calibrate barometric pressure sensors ahead of storm season
Test backup power systems before shorter daylight reduces solar input
Winter
Install heated rain gauges or activate de-icing elements where applicable
Monitor for ice accumulation on cup anemometers and wind vanes
Check enclosure seal integrity against moisture ingress
Verify data logger clock accuracy after any power interruptions
Building seasonal maintenance schedules for distributed weather stations? Our team helps municipalities configure automated task generation tied to seasonal triggers and local climate patterns.
Connect with iFactory support to set up season-aware maintenance workflows.
Predictive Maintenance vs. Scheduled Maintenance for IoT Sensors
The traditional approach to sensor maintenance—fixed calendar schedules regardless of actual sensor condition—wastes resources on healthy devices while missing degradation between visits. Predictive maintenance uses real-time telemetry from the sensor network itself to identify which devices actually need attention, when, and why. The shift from scheduled to predictive maintenance is the single biggest operational efficiency gain available to smart city sensor programs.
Scheduled Maintenance
Fixed intervals regardless of device health status
Up to 35% of field visits find no issue to resolve
Failures between visits go undetected for weeks
Higher per-sensor labor cost with lower data quality ROI
Calibration gaps grow as networks scale beyond team capacity
65%
Field trip efficiency
Predictive Maintenance
AI monitors battery, signal quality, and drift in real time
Dispatches only when telemetry confirms a confirmed need
Detects degradation patterns before they impact data quality
Optimizes technician routes across geographically spread nodes
Scales efficiently as networks grow from hundreds to thousands
92%
Field trip efficiency
Common Sensor Failure Modes in Urban Deployments
Urban environments introduce failure modes that controlled laboratory or industrial settings rarely encounter. Field technicians managing smart city sensors must anticipate environmental contamination, physical damage from weather or vandalism, connectivity disruptions, and power supply failures—each requiring different diagnostic approaches and preventive countermeasures.
Experiencing unexplained data gaps or erratic sensor readings? Our diagnostic team helps municipalities identify root causes across distributed sensor networks and implement targeted fixes.
Contact iFactory support for remote sensor diagnostics assistance.
How CMMS Platforms Automate Smart City Sensor Operations
Managing hundreds or thousands of sensors across a metropolitan area without a centralized system leads to missed calibrations, lost maintenance records, and compliance gaps. A Computerized Maintenance Management System purpose-built for IoT infrastructure connects sensor health telemetry to automated workflows—turning raw device data into dispatched work orders, tracked calibration records, and auditable compliance documentation.
01
Continuous Health Monitoring
The CMMS ingests real-time telemetry from every sensor node—battery voltage, signal strength, data freshness, calibration drift indicators, and environmental exposure metrics. Dashboards flag anomalies automatically without manual log reviews.
02
Intelligent Work Order Generation
When telemetry crosses predefined thresholds—low battery, calibration drift exceeding tolerance, or connectivity degradation—the system automatically creates a work order with the correct maintenance procedure, parts list, and reference instrument requirements for that specific sensor model.
03
Route-Optimized Dispatch
Work orders are grouped by geographic proximity and technician skill set, creating optimized field routes that minimize travel time while ensuring the right person with the right equipment arrives at each sensor location.
04
Calibration Documentation & Compliance
Every maintenance and calibration event is logged with timestamps, technician ID, reference instruments used, before-and-after readings, and pass/fail determinations. This creates an unbroken chain of traceability for regulatory audits and data quality assurance reviews.
The biggest risk in a smart city sensor network is not a sensor that fails obviously—it is the sensor that drifts slowly, undetected, feeding your dashboards data that looks plausible but is silently wrong. Automated calibration tracking through a CMMS is the only reliable defense against invisible data degradation across a network of hundreds or thousands of nodes.
— Municipal IoT Infrastructure Director
Sensor Lifecycle Planning: From Procurement to Retirement
Every sensor has a finite useful life. Electrochemical gas cells degrade after 18-24 months regardless of maintenance quality. Optical components lose sensitivity over 3-5 years. Mechanical elements like anemometer bearings and rain gauge tipping buckets wear with every measurement cycle. Proactive lifecycle management ensures that no sensor in your network silently crosses the threshold from accurate to unreliable without a planned replacement waiting. Talk to iFactory support about configuring automated lifecycle alerts for your sensor fleet.
Phase 1
Procurement & Commissioning
Select sensors meeting accuracy specifications for intended deployment environment. Factory calibration certificates are verified, asset tags assigned, and baseline readings recorded before field installation. Serial numbers, warranty dates, and expected lifespan are logged in the CMMS.
Phase 2
Active Monitoring Period
Sensors operate under scheduled calibration and preventive maintenance cycles. Calibration drift trends are tracked over time to identify when a sensor is aging faster than expected. Health telemetry feeds continuous condition assessment algorithms.
Phase 3
Degradation Tracking
As sensors age, calibration corrections become larger and more frequent. The CMMS flags sensors where post-calibration accuracy no longer meets minimum thresholds. Replacement planning begins before actual failure to prevent data gaps.
Phase 4
Retirement & Replacement
End-of-life sensors are decommissioned with final calibration records archived. Replacement units are deployed with fresh factory calibration, and the new asset inherits the monitoring location's maintenance schedule and calibration history.
Bring Precision and Accountability to Every Sensor in Your City
Your city's data-driven decisions are only as trustworthy as the sensors behind them. iFactory helps municipalities automate calibration tracking, manage sensor lifecycles, optimize maintenance routes, and maintain the audit-ready compliance documentation that regulators and citizens demand from smart city programs.
Frequently Asked Questions
How often should smart city air quality sensors be calibrated?
Air quality sensors—particularly electrochemical gas cells and optical particle counters—should undergo calibration checks at least every 90 days. Electrochemical sensors need zero and span verification using certified gas standards, while particulate matter sensors require collocation with reference-grade gravimetric samplers. In areas near heavy traffic corridors or industrial zones, tightening the calibration cycle to every 60 days may be necessary to maintain data quality within regulatory tolerance.
Contact iFactory support to configure automated calibration scheduling for your air quality sensor fleet.
What causes sensor drift in outdoor urban environments?
Sensor drift in urban deployments results from multiple concurrent mechanisms: chemical degradation of sensing elements from sustained pollutant exposure, thermal stress from daily temperature cycling, humidity infiltration affecting capacitive and electrochemical components, optical surface contamination from airborne particulates, and gradual electronic component aging. Each mechanism operates on a different timescale, which is why single-frequency calibration programs miss drift that multi-interval schedules catch. Monitoring drift trends over time through a CMMS allows maintenance teams to predict when a sensor will exit its accuracy window and schedule intervention before data quality is compromised.
What is the difference between field calibration and factory calibration for sensors?
Field calibration is performed at the sensor's installed location using portable reference instruments, correcting for site-specific environmental factors. It is faster and avoids removing the sensor from service but may have slightly lower precision than laboratory methods. Factory calibration is conducted in controlled conditions by the manufacturer using primary reference standards, providing the highest achievable accuracy. Best practice for municipal networks is to use field calibration for routine quarterly checks and rotate sensors to factory calibration when field corrections can no longer bring readings within acceptable tolerance bands.
Can a CMMS platform manage sensor networks across multiple cities or districts?
Yes. Modern CMMS platforms support multi-site, multi-region deployments with role-based access controls. Each municipality or district manages its own sensor assets, calibration schedules, and maintenance histories while regional administrators maintain oversight across the entire network. Centralized dashboards aggregate health metrics from all locations, enabling consistent maintenance standards and cross-site benchmarking regardless of geographic distribution.
Reach out to iFactory support to discuss multi-site CMMS configuration for your sensor infrastructure.
How does predictive maintenance reduce costs for municipal sensor networks?
Predictive maintenance leverages real-time health telemetry—battery voltage trends, signal quality degradation, data variance patterns, and calibration drift rates—to forecast exactly when each sensor will need attention. This eliminates unnecessary scheduled visits to healthy sensors, reducing field trip waste by up to 35%, while simultaneously catching degradation before it produces data gaps. Cities using predictive approaches report fewer emergency dispatches, extended average sensor lifespans, and measurably higher data completeness rates compared to traditional calendar-based programs.