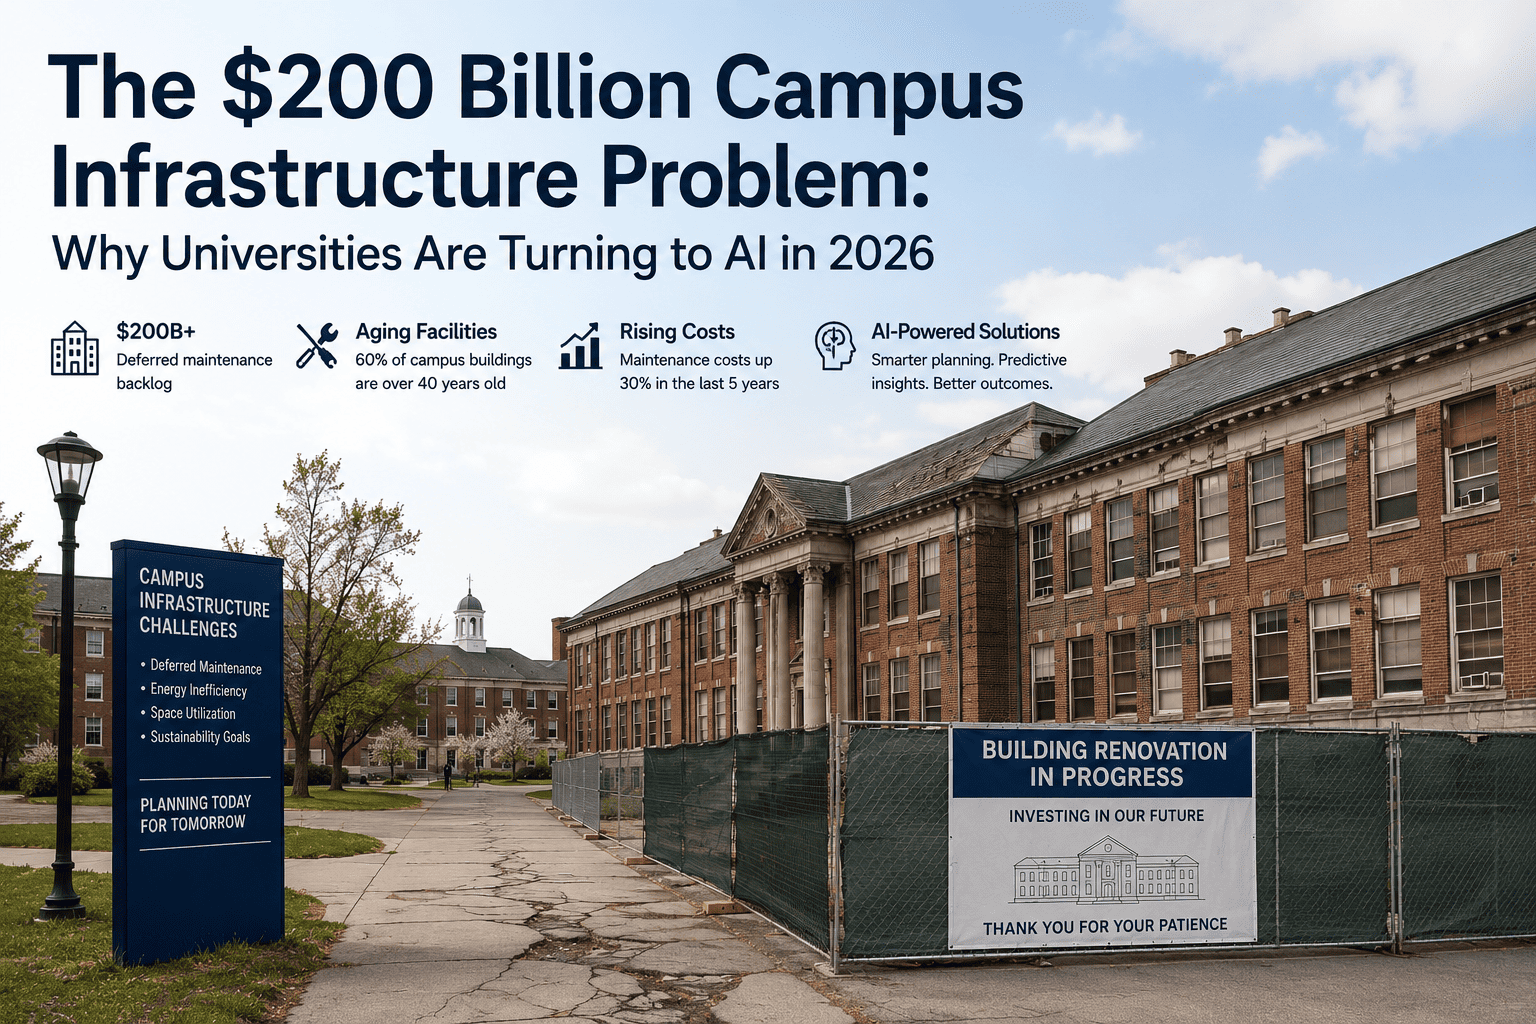
Universities across the US and UK are carrying deferred maintenance backlogs that now exceed $100 billion combined, and the compounding rate is outpacing capital budgets at most institutions. This is not a new problem — but in 2026 it has become an acute one. Aging infrastructure, tightening compliance requirements, and credit agency scrutiny of deferred maintenance documentation have transformed a capital planning embarrassment into an operational and financial liability that board-level leaders can no longer defer. The institutions closing the gap are not doing it with more money. They are doing it with better asset data. See how AI-powered capital planning reduces your institution's backlog exposure in a demo.
How AI-powered maintenance planning reduces capital risk, prevents operational downtime, and closes deferred maintenance backlogs at US and UK universities.
Why $100 Billion and Why Now
The $100 billion figure is a floor, not a ceiling. It reflects only formally documented deferred maintenance at institutions that have completed recent condition assessments. Most universities have not. Assets deteriorate continuously between inspection cycles, meaning the true liability at any given institution is typically 20-35% higher than the figure appearing in capital planning documents.
Three forces converged in 2026 to elevate this from a planning problem to a governance problem. Post-war campus construction cohorts are reaching simultaneous end-of-useful-life. Credit agencies now explicitly incorporate deferred maintenance backlogs and documentation quality into institutional bond ratings. And expanded OSHA, EPA, and accreditation requirements tied to facility condition data have created regulatory exposure that manual management systems cannot reliably contain. Get a deferred maintenance exposure assessment for your institution in a demo.
At institutions without predictive maintenance — a $60M backlog becomes $85-90M within five years without active drawdown strategy.
Reactive emergency repairs cost 3-5x the equivalent planned intervention — the core financial multiplier that accelerates backlog growth year over year.
Capital decisions made on data that is on average 26 months stale. Actual scope at project start routinely exceeds planned scope by 20% or more.
Projects scoped on stale condition estimates systematically generate 22% average cost overruns — eroding board confidence and consuming contingency reserves.
The Six Mechanisms That Drive Backlog Growth
Manual inspection cycles produce condition scores every 3-5 years. Assets deteriorate continuously between assessments, so the score driving capital priority may be 18-36 months out of date. Capital dollars go to the wrong assets in the wrong order — not by negligence, but because the underlying data is structurally stale.
Without predictive alerts, understaffed teams choose emergency response over preventive work every time — rationally in the moment, destructively over time. Emergency events consume 60-75% of available maintenance budget and leave preventive programs perpetually underfunded.
Capital requests backed by 2-3 year old condition assessments face board skepticism that adds 6-18 months to approval cycles. During that window, deferred assets continue deteriorating — often converting manageable replacements into emergency interventions by the time capital is approved.
University portfolios span dozens of buildings managed through disconnected spreadsheets, legacy CMMS records, and departmental logs that never produce a unified institutional view. Without portfolio-wide FCI visibility, prioritization is driven by whoever advocates loudest rather than quantified cost-of-deferral risk.
Manual systems cannot model what it costs to defer a specific project for one, three, or five years. Without that quantification, every capital decision is made without knowing the true financial consequence of delay — which systematically favors near-term budget relief over long-term cost optimization.
Deferred HVAC, water, and electrical maintenance now creates compounding compliance exposure under OSHA 2026, EPA water quality mandates, and NFPA standards. Each finding adds remediation cost and legal exposure on top of the deferred maintenance liability itself — and credit agencies are watching the documentation quality.
How AI Maintenance Planning Closes the Gap
AI-powered maintenance platforms address the backlog through five specific mechanisms that manual systems cannot replicate. Each targets a root cause and produces documented financial outcomes within 18 months. See how each mechanism maps to your institution's specific backlog composition in a demo.
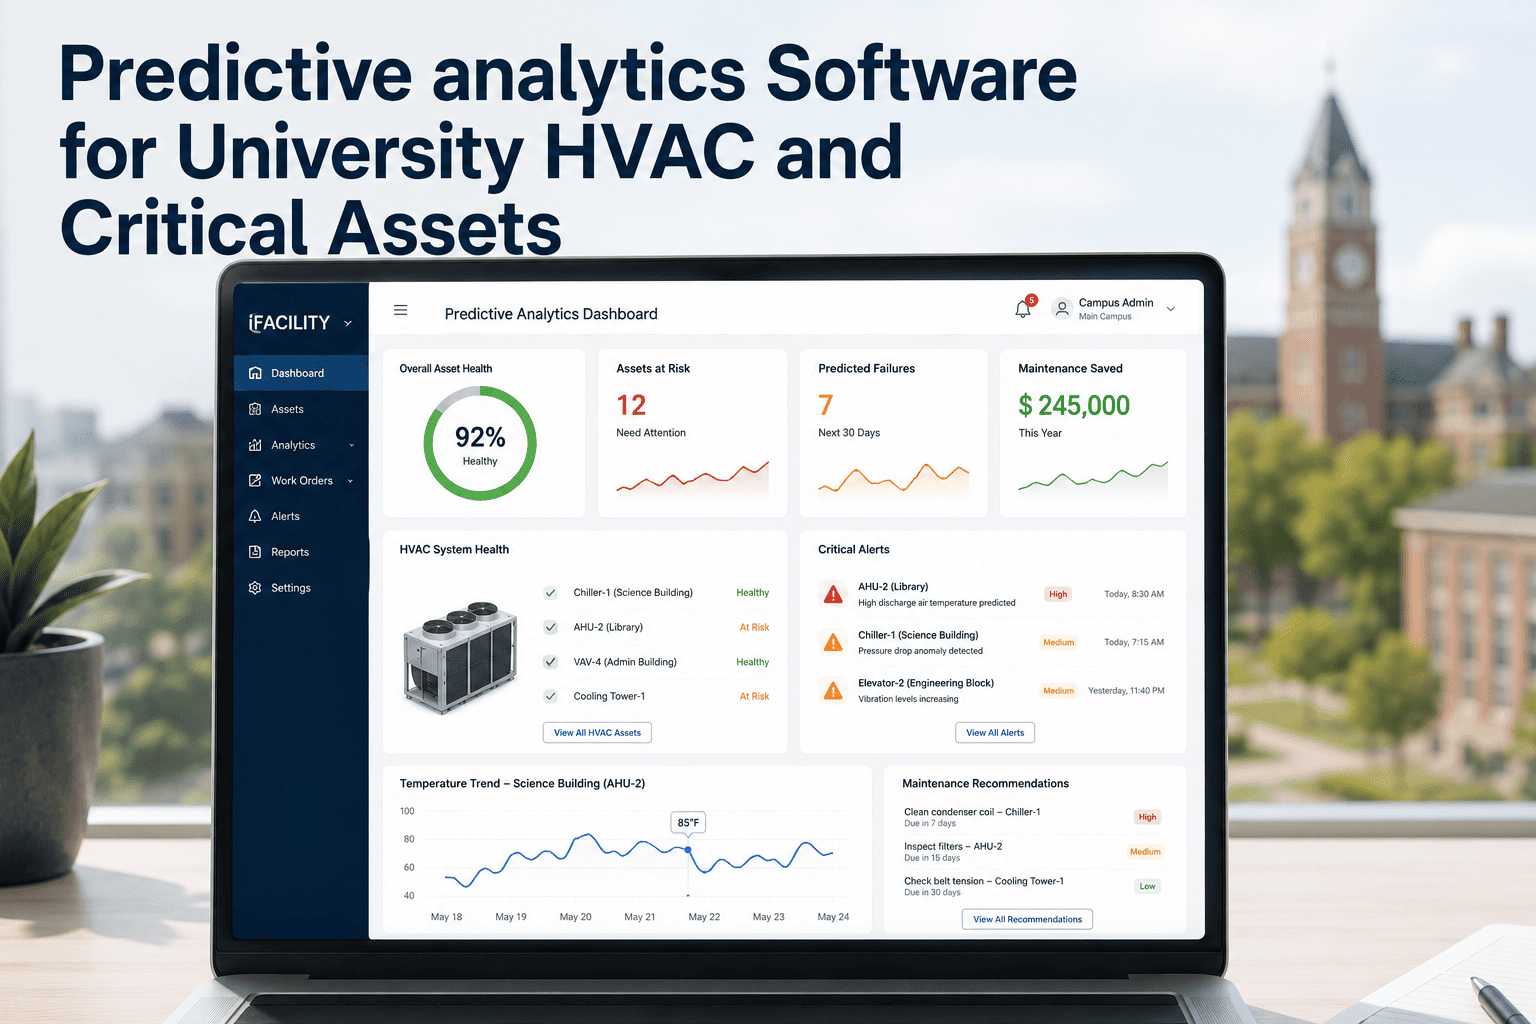
Condition data age drops from 26 months to under 30 days. Capital prioritization driven by current condition, not inspection cycle timing.
Failure probability calculated per asset with intervention timing recommended weeks before failure converts to emergency cost.
Five-year deferral cost projections per building generated from live condition data. Capital discussions shift from opinion to evidence at every board session.
FCI calculated per building from continuous sensor data. Board-ready and credit-agency-ready exports available on demand. Capital variance drops from 22% to 6%.
OSHA, EPA, NFPA, and ADA records generated from live data. Audit packages on demand. Zero deficiencies documented in all deployed institutions.
Documented Outcomes
From university and K-12 deployments on existing operational budgets. No additional headcount in any documented case.
Frequently Asked Questions
AI-powered maintenance planning for US and UK universities. Core integration live in 60-90 days. No capital expenditure or system replacement required.