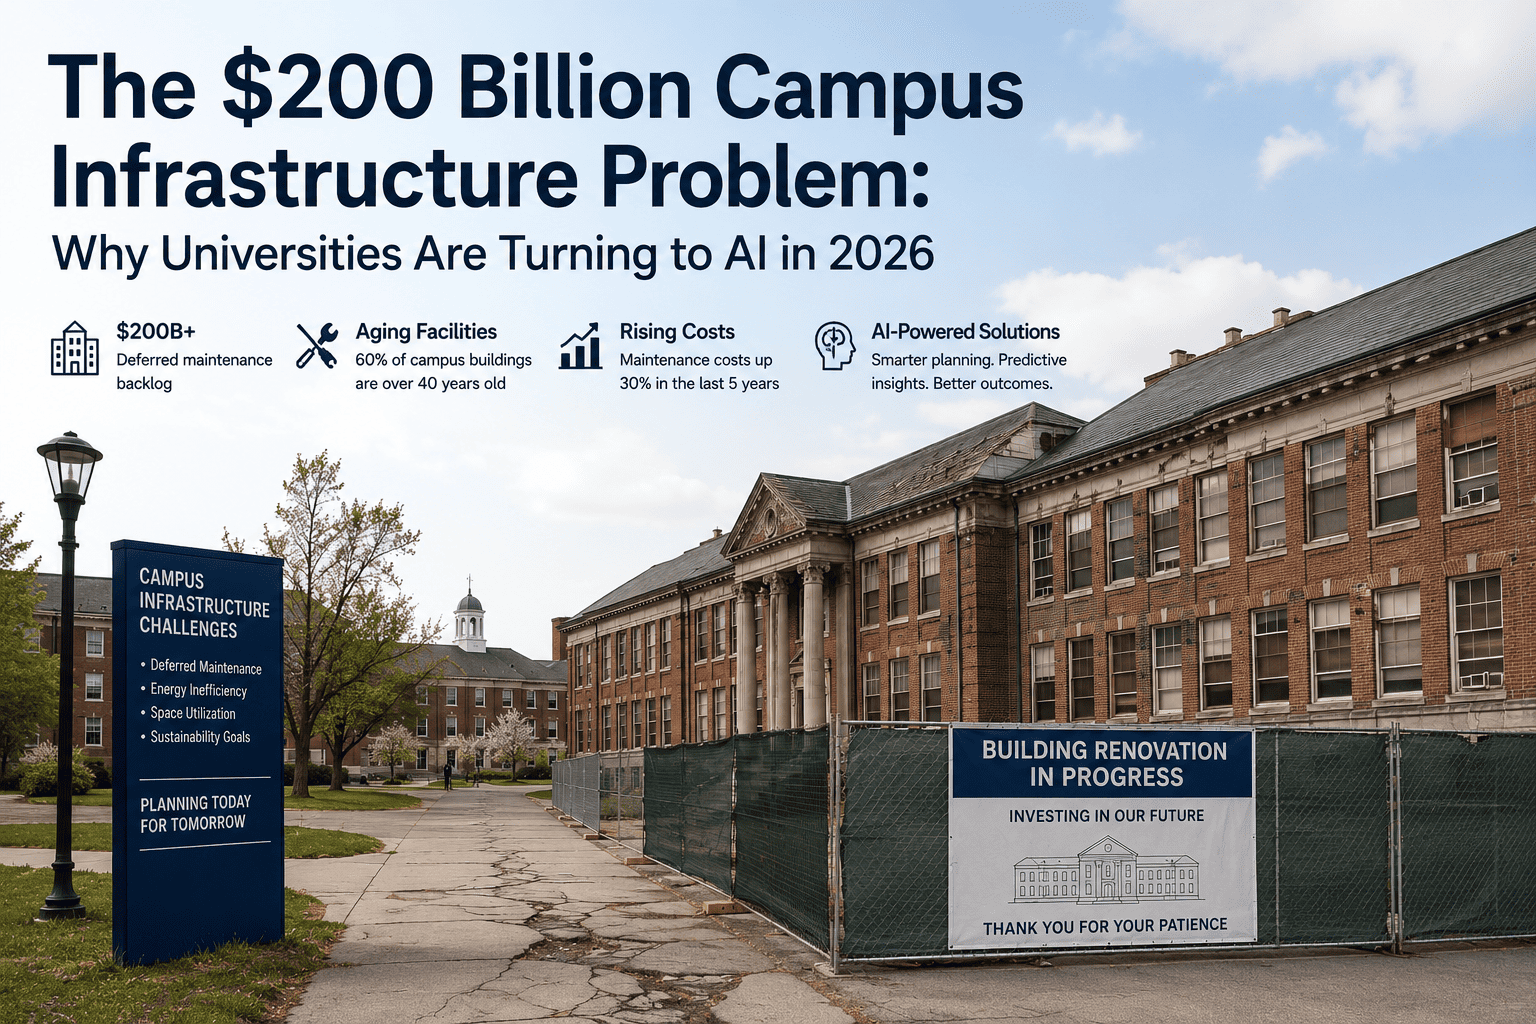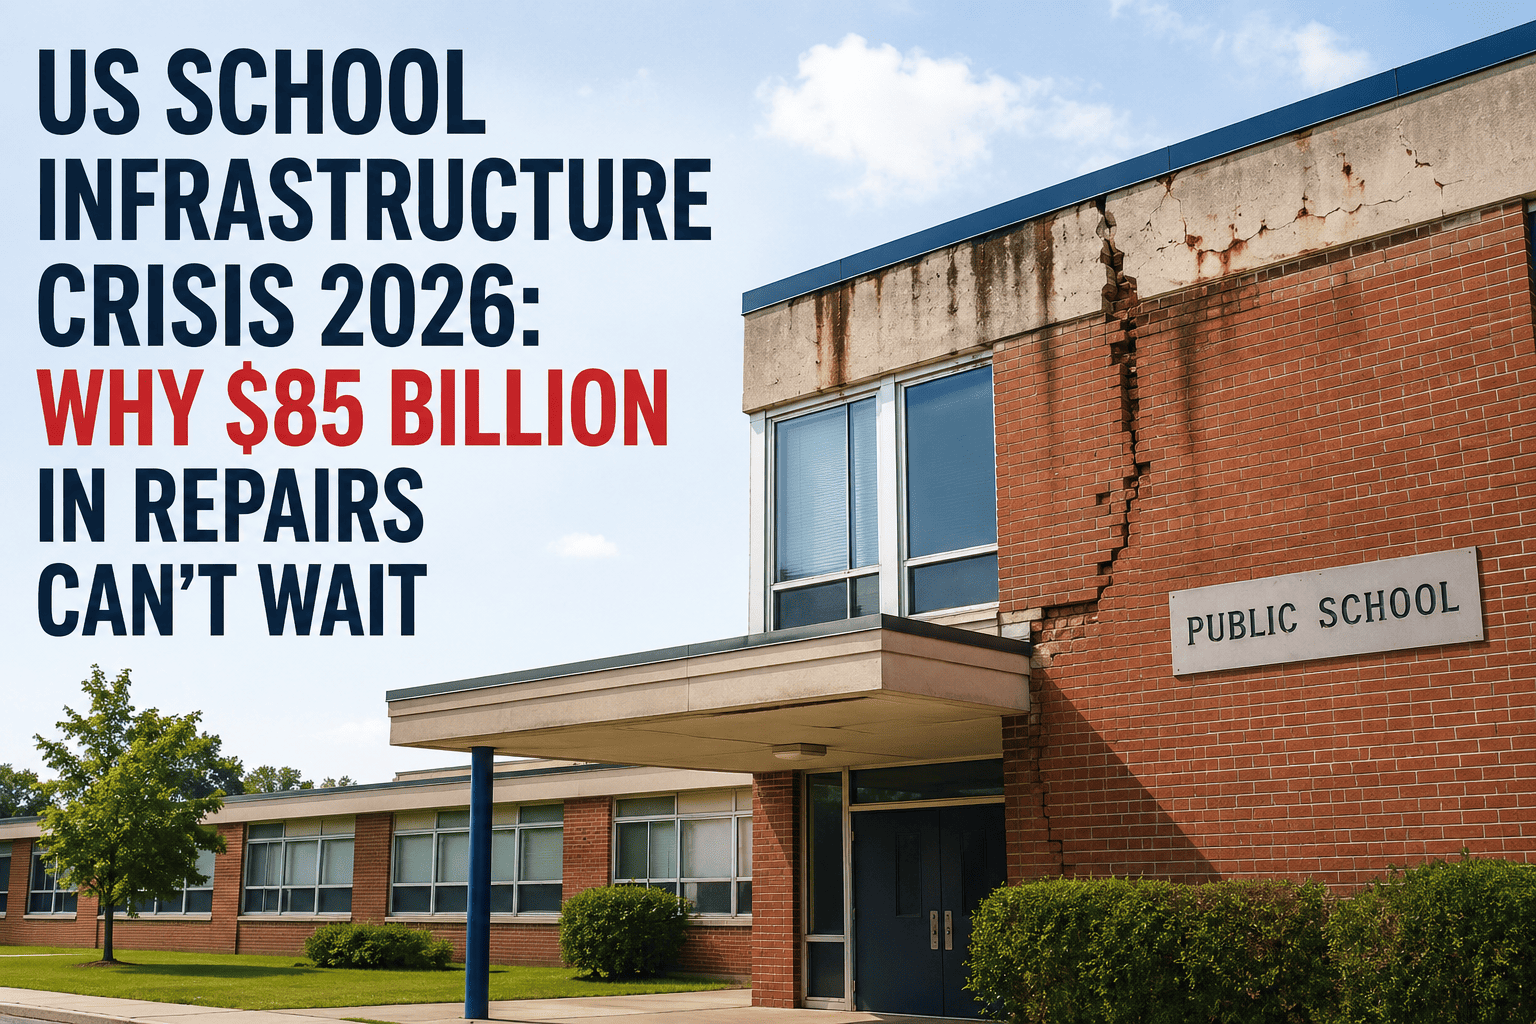
America's public schools are sitting on more than $85 billion in deferred maintenance, and the backlog is growing. Aging HVAC systems, failing roofing, deteriorating electrical panels, and crumbling plumbing across hundreds of thousands of school buildings represent a liability that reactive management cannot contain. Every year that passes without a predictive maintenance strategy, the backlog compounds at 4-6% and emergency repair costs consume budget that should be funding instructional programs. The institutions that are reversing this trajectory are not doing it with larger budgets. They are doing it with better data. See how predictive analytics reduces your district's deferred maintenance exposure in a live demo.
The Scale of the Crisis: What $85 Billion Actually Means
The $85 billion figure cited in 2026 federal education infrastructure assessments covers only formally documented deferred maintenance. The actual liability is materially higher because most districts still rely on inspection cycles and manual condition assessments that systematically undercount deteriorating assets between evaluations. A roof assessed as fair condition in 2022 may have crossed into poor condition by 2025 with no formal update to the capital liability register.
Three structural forces have converged to make the crisis more acute than at any previous point. The post-WWII school construction boom produced a massive cohort of buildings now reaching simultaneous end-of-useful-life across HVAC, roofing, electrical, and plumbing. Federal and state capital funding has not kept pace with replacement cost inflation. And the 2026 compliance environment — with expanded OSHA, EPA, and accreditation requirements tied to documented condition data — has transformed deferred maintenance from a capital planning embarrassment into a regulatory and financial risk. Assess your district's deferred maintenance exposure and get a reduction roadmap in a demo.
Why Backlogs Keep Growing: The Six Root Causes
Manual inspection cycles produce condition scores every 3-5 years on average. Assets deteriorate continuously between cycles, meaning the score driving capital priority decisions may be 18-36 months out of date. Capital dollars are allocated to the wrong assets in the wrong order — not because of incompetence, but because the data driving those decisions is stale by design.
Emergency repairs cost 3-5x more than planned preventive interventions for the same failure mode. Schools without predictive systems spend a disproportionate share of their maintenance budgets on emergency response, leaving insufficient funds for preventive work and accelerating the backlog compounding rate year over year in every district.
Facilities teams presenting capital requests without live IoT-backed condition data face board skepticism that delays approvals and defers critical projects. When condition scores come from inspections that are years old, boards routinely request additional data before approving — adding 6-18 months to the capital cycle while deterioration continues.
School district facilities portfolios span dozens of buildings and hundreds of asset classes managed through separate spreadsheets, legacy CMMS records, and departmental logs that never produce a unified view. Without portfolio-wide FCI visibility, capital prioritization is driven by whoever advocates loudest rather than which assets represent the highest cost-of-deferral risk.
Manual systems cannot model the cost of deferring a specific project for one, three, or five years with confidence. Without quantified cost-of-deferral projections per asset, every capital decision is made without knowing the true financial consequence of delay — systematically biasing decisions toward near-term budget relief rather than long-term cost optimization.
Deferred maintenance on HVAC, water, and electrical systems now creates compounding compliance exposure under OSHA 2026 Heat Illness Prevention requirements, EPA water quality mandates, and NFPA fire system standards. Each compliance finding adds remediation cost and legal exposure on top of the deferred maintenance liability itself.
How Predictive Analytics Addresses the Backlog Directly
Predictive analytics platforms address deferred maintenance backlogs through six mechanisms that manual systems structurally cannot replicate. Each targets one of the root causes above and produces documented financial outcomes within the first 18 months. See how each mechanism applies to your district's specific backlog composition in a demo.
Asset condition scores updated continuously from sensor data rather than periodic inspections. Condition data age drops from 26 months to under 30 days. Capital prioritization driven by current condition, not inspection cycle timing.
AI model predicts failure probability per asset with campus-specific inputs. Intervention timing recommendations generated before failure converts to emergency cost. Model accuracy improves monthly as district-specific data accumulates.
Five-year cost-of-deferral projections per building generated automatically from live condition data. Deferral cost quantification converts capital discussions from opinion-based to evidence-based at every board session.
OSHA, EPA, NFPA, and ADA documentation generated from live IoT and maintenance data. Audit packages assembled on demand. Zero deficiencies achieved across all compliance frameworks in documented deployments.
Facility Condition Index calculated per building from continuous sensor data across the full district portfolio. Credit-agency-ready and accreditor-ready FCI documentation exported with one click. Capital project cost variance drops from 22% to 6%.
Predictive maintenance work orders created automatically from AI condition forecasts. Work orders routed to the right technician by asset type and skill requirement. Summer break windows scheduled automatically from occupancy data.
Documented Outcomes From District Deployments
Results from K-12 and university deployments measured against pre-deployment baselines on existing operational budgets. No additional headcount added. See how these outcomes translate to your district's portfolio and existing infrastructure.
| Metric | Before Deployment | After 18 Months | Change |
|---|---|---|---|
| Maintenance Cost per Sq Ft | $4.85 reactive avg | $3.40-$3.99 | -18% to -30% |
| Emergency Work Orders | 60-75% of budget | 60-75% fewer | -60% to -75% |
| Reactive Maintenance Share | 31% of total spend | 9% of total spend | -71% |
| Asset Condition Data Age | 18-26 months average | Under 30 days | -98% |
| Capital Project Cost Variance | 22% average overage | 6% average | -73% |
| Compliance Reporting Hours | 140 hrs per cycle | 18 hrs per cycle | -87% |
| Audit Deficiencies | Multiple per cycle | Zero documented | -100% |
| Documentation Maturity Score | 41 out of 100 | 79 out of 100 | +38 pts |
Deployment Timeline: From Crisis to Documented Reduction
All existing BAS, smart meters, and sensors connected via open API. Asset registry built from IoT inventory and CMMS data. AI baseline condition scores produced for all connected assets by month three. All staff onboarded in under 12 hours.
AI deterioration model active across all IoT-connected asset classes. Automated work order generation and dispatch operational district-wide. Emergency work orders declining as planned maintenance replaces reactive dispatch.
FCI dashboard live with per-building condition scores from continuous IoT data. Compliance documentation automated for OSHA, EPA, NFPA, and ADA. First board-ready capital presentation produced from live IoT-informed FCI data.
18-30% maintenance cost reduction fully documented and audited. 60-75% fewer emergency work orders. Zero audit deficiencies across all compliance categories. AI model continues improving as campus-specific data accumulates.