Preventive vs Predictive analytics in Schools: What Actually Saves More Money?
By Julian Alvarez on May 28, 2026
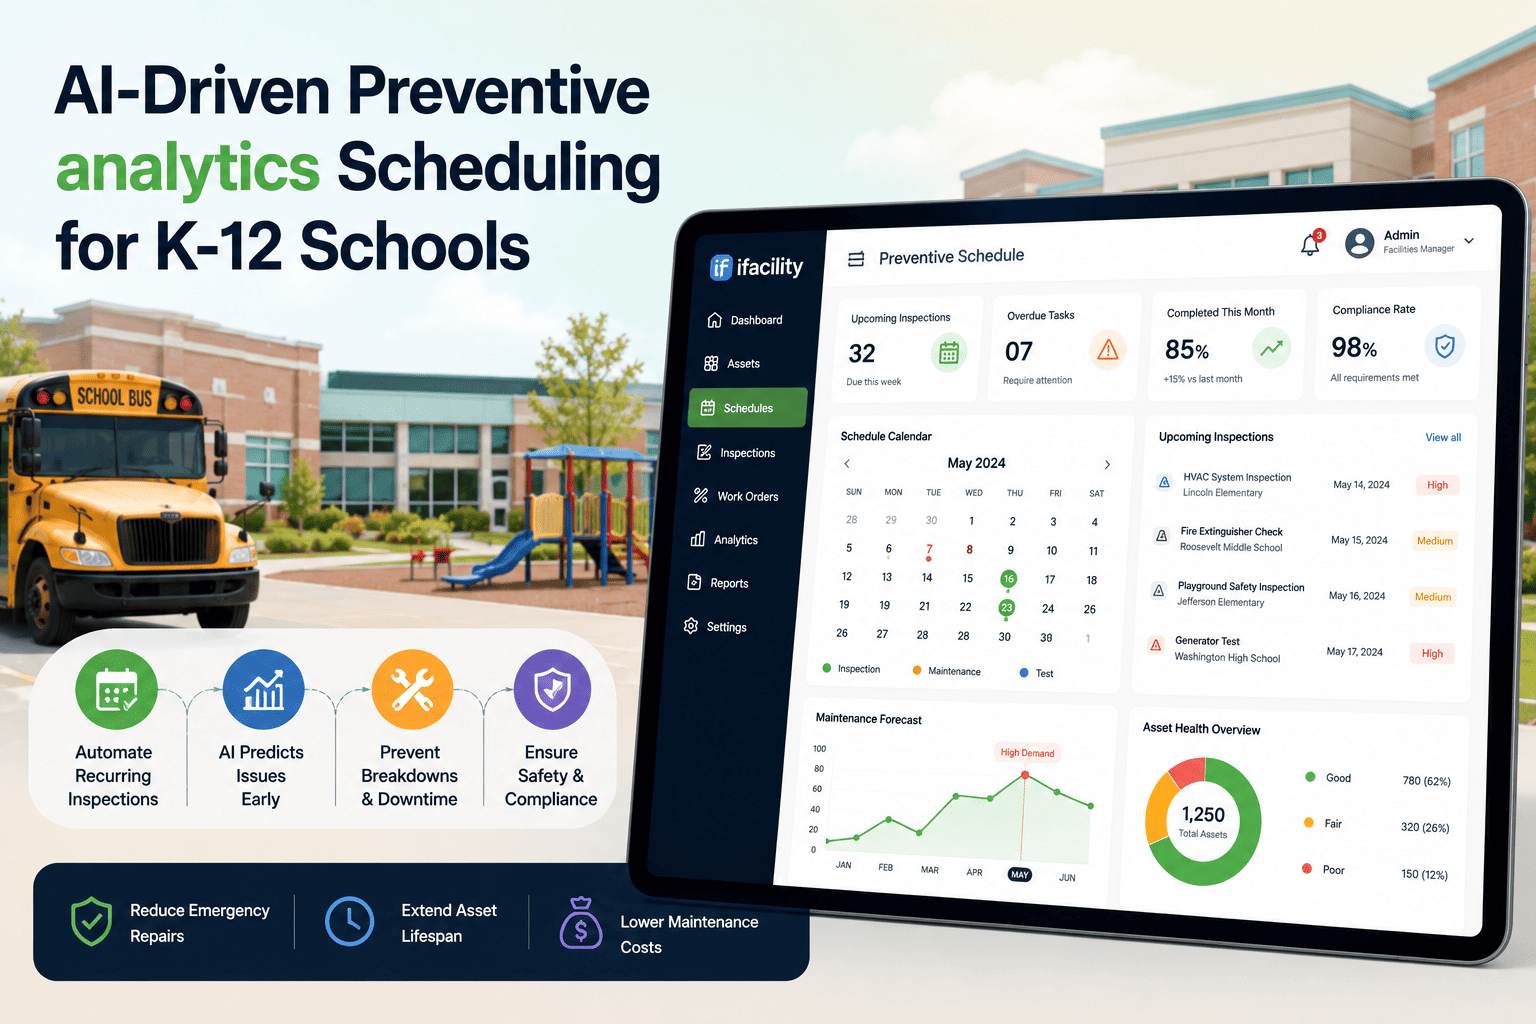
Schools spend 6 to 10 months per year reacting to facility failures — heating systems fail mid-winter, roof leaks destroy classrooms weeks into repair, security cameras offline during incidents, networks collapse during testing week. Preventive maintenance calendars catch nothing until breakdown is imminent. Predictive analytics, powered by AI, identifies equipment degradation 30 to 90 days in advance — allowing scheduling during summer, semester breaks, or planned maintenance windows. For a K-12 district managing 30 schools and 2,000+ assets, the difference between reactive and predictive is the gap between crisis management and operational certainty. iFactory's AI platform connects facility sensors, system logs, and maintenance history to forecast failures before they disrupt learning — with audit-ready compliance records and capital planning that tracks actual vs budgeted spend.
Education Technology · 2026
Preventive vs. Predictive Analytics in K-12 Schools: Cost Comparison & Operational Impact
AI-driven failure prediction · 30 to 90 day advance alerts · Summer maintenance scheduling · Unplanned downtime elimination · Compliance documentation & capital budget forecasting.
Why Schools Are Losing $100K to $1M Per Year on Reactive Maintenance
Every facility manager in a K-12 district or university follows a preventive maintenance calendar: HVAC filter changes every 3 months, roof inspections annually, boiler tune-ups in fall. The calendar exists but the equipment breaks anyway — because calendars cannot predict material fatigue, component wear rates specific to each building's usage pattern, or the weather conditions that accelerate degradation. When a classroom heating system fails mid-January, the district pays emergency repair premium pricing, loses instructional time, and diverts maintenance staff from planned work. Predictive analytics eliminates this cycle by monitoring equipment continuously and forecasting failures with 30 to 90 days lead time — allowing maintenance to be scheduled during summer, winter break, or planned maintenance windows when no students are present.
K-12 School District — Asset Ecosystem Map
Buildings
30 Schools
Elementary · middle · high schools · administration
IoT sensors
Climate
HVAC Systems
Boilers · chillers · compressors · ductwork
Predictive PdM
Infrastructure
Building Envelope
Roofs · HVAC units · windows · foundation
Condition tracking
IT / Security
Networks & Systems
Wi-Fi · servers · CCTV · access control
Uptime monitoring
Services
Utilities & Support
Electrical · plumbing · water · safety
Failure alerts
Three Operational Problems Predictive Analytics Solves
01
HVAC System Failures During Peak Learning Seasons
Heating fails in January, air conditioning in August — exactly when students are in session and no flexibility exists to shut buildings for maintenance. Preventive calendars miss degradation; predictive models forecast compressor wear 60 days in advance. iFactory monitors motor current, refrigerant pressure, and thermal data to schedule replacement during summer break — eliminating classroom closures and emergency contractor premiums.
HVAC PdM60d forecastSummer scheduling
02
Network & IT Infrastructure Outages During Critical Instruction & Testing
Wi-Fi fails during state testing week. Servers crash during college application filing deadline. Camera systems offline when security is needed. Preventive IT maintenance operates on fixed cycles; predictive models analyse hardware thermal patterns, disk performance trends, and network congestion to alert IT teams 30 to 45 days before failure. Maintenance can be scheduled for non-instructional time — protecting learning continuity and test integrity.
Network uptimeServer healthZero-outage testing
03
Roof Leaks, Water Damage & Building Envelope Failures
Roof leaks destroy library sections, computer labs, and classrooms — forcing abandonment for weeks while repairs and remediation occur. Annual roof inspections miss early deterioration. Predictive monitoring uses thermal imaging, moisture sensors, and weather pattern correlation to detect membrane degradation 6 to 12 months in advance. Districts schedule roof work during summer when no instruction is affected — avoiding the catastrophic cost and disruption of mid-year emergency repairs.
Roof monitoringMoisture detectionCost avoidance
What Tier-1 School Districts and Universities Are Publicly Deploying
Leading K-12 districts and universities across the USA, India, and UK have adopted AI-powered facility management to forecast equipment failures, eliminate unplanned maintenance during instruction, and improve budget predictability. Public case studies document deployment across districts managing 20 to 80 schools, with implementations covering HVAC, roofing, IT infrastructure, electrical systems, and plumbing. iFactory is the AI layer — turning sensor data and maintenance history into actionable failure forecasts and compliance records. Contact iFactory's education team for applicable district references.
School System
Monitoring & Data
iFactory Output
Why It Matters
HVAC Systems
Temp sensors · motor current · pressure gauges
60d failure forecast · work orders
Prevents heating loss mid-winter and AC loss mid-summer during instruction
IT Infrastructure
Server health · network traffic · disk usage
30-45d uptime alerts · upgrade planning
Protects network during testing and college application filing periods
Roofing & Envelope
Thermal imaging · moisture sensors · weather data
6-12mo membrane degradation warning
Allows summer scheduling vs catastrophic mid-year emergency repairs
Electrical Systems
Load monitoring · temperature sensors · fault logs
Panel degradation alerts · upgrade forecasting
Prevents power loss affecting entire buildings during instruction time
Plumbing & Water Systems
Flow sensors · pressure gauges · temperature logs
Pipe failure prediction · shutdown scheduling
Avoids water main breaks that contaminate schools or force closure
Preventive vs Predictive: The Cost Comparison
Operating Cost Category
Preventive Maintenance (Current)
Predictive Analytics (iFactory)
Emergency Repairs
$80K to $120K annually per district
$12K to $18K — only critical failures
Contractor Premiums (after-hours, rush)
25 to 40% markup on emergency work
5 to 8% — scheduled during off-season
Instructional Time Lost to Closures
6 to 12 days annually across all buildings
0 to 1 day — work scheduled for breaks
Capital Budget Accuracy
Unpredictable surges; 30 to 50% variance vs budget
AI models analyse compressor vibration, refrigerant pressure, and motor current to forecast bearing wear and seal degradation 60 to 90 days in advance. Replacement is scheduled during summer months when schools are closed, protecting heating and cooling availability during instructional time.
IT InfrastructureServer & Network Uptime ProtectionPer device
Monitors server CPU/memory utilization, disk health trends, Wi-Fi signal patterns, and network congestion. Flags hardware degradation 30 to 45 days before failure — allowing upgrades or replacements to be scheduled during summer IT freeze or scheduled maintenance windows. Contact iFactory about your IT asset inventory.
RoofingRoof Membrane & Water Infiltration Early DetectionSeasonal
Thermal imaging combined with moisture sensor data and weather pattern analysis detects membrane degradation and micro-failures 6 to 12 months in advance. Roof work is scheduled during summer when buildings are unoccupied, avoiding emergency repairs that destroy classrooms and cost 3 to 4 times more than planned work.
Average annual emergency repair cost elimination per district
Across 30 schools; proportional for larger/smaller districts
8 to 12 d
Instructional time protected annually
Maintenance moved to summer/winter break
18-24 mo
Payback period for full deployment across 30 schools
Including sensors, platform, and implementation
FAQ — Preventive vs Predictive in Education
iFactory installs temperature, moisture, vibration, power, and pressure sensors on critical systems: HVAC, electrical panels, roofing, plumbing, and IT infrastructure. Typical cost is 80 to 120 thousand dollars including sensors, gateways, cloud platform, and 12 weeks of implementation support. Contact support for a custom quote based on your building inventory.
iFactory's models achieve 85 to 92 percent accuracy on equipment failure prediction once baseline data is collected (4 to 8 weeks). Early warnings increase in precision as the AI learns your district's specific building conditions, operating patterns, and seasonal variations.
Yes. iFactory sits on top of your existing CMMS (Computerized Maintenance Management System) or work order system — whether you use Maximo, Dude Solutions, or in-house tools. Predictive alerts feed directly into your workflow, and technicians see forecasts alongside scheduled preventive tasks.
The model adjusts continuously. If a boiler that was predicted to fail in 75 days performs normally, the forecast rolls forward and recalibrates based on new data. Over time, district-specific patterns emerge and forecasts become increasingly accurate for your unique building aging profile.
Hardware installation and configuration takes 8 to 12 weeks depending on network readiness and sensor accessibility. Baseline learning (4 to 8 weeks of data collection) overlaps with deployment, so you can begin seeing alerts by week 10. Book a demo for a project timeline specific to your district.
Yes. iFactory collects only facility, equipment, and infrastructure data — no student or educational records. The platform is FERPA-agnostic and SOC 2 compliant. All data is hosted on secure cloud or on-premise servers with full encryption. Contact support for security documentation and audit readiness records.
Start Predictive Maintenance for Your School District
iFactory forecasts equipment failures 30 to 90 days in advance, allowing scheduling during summer and breaks instead of mid-instruction emergencies. 18 to 24 month ROI payback, 40 percent reduction in unplanned maintenance, and full budget predictability for capital planning.