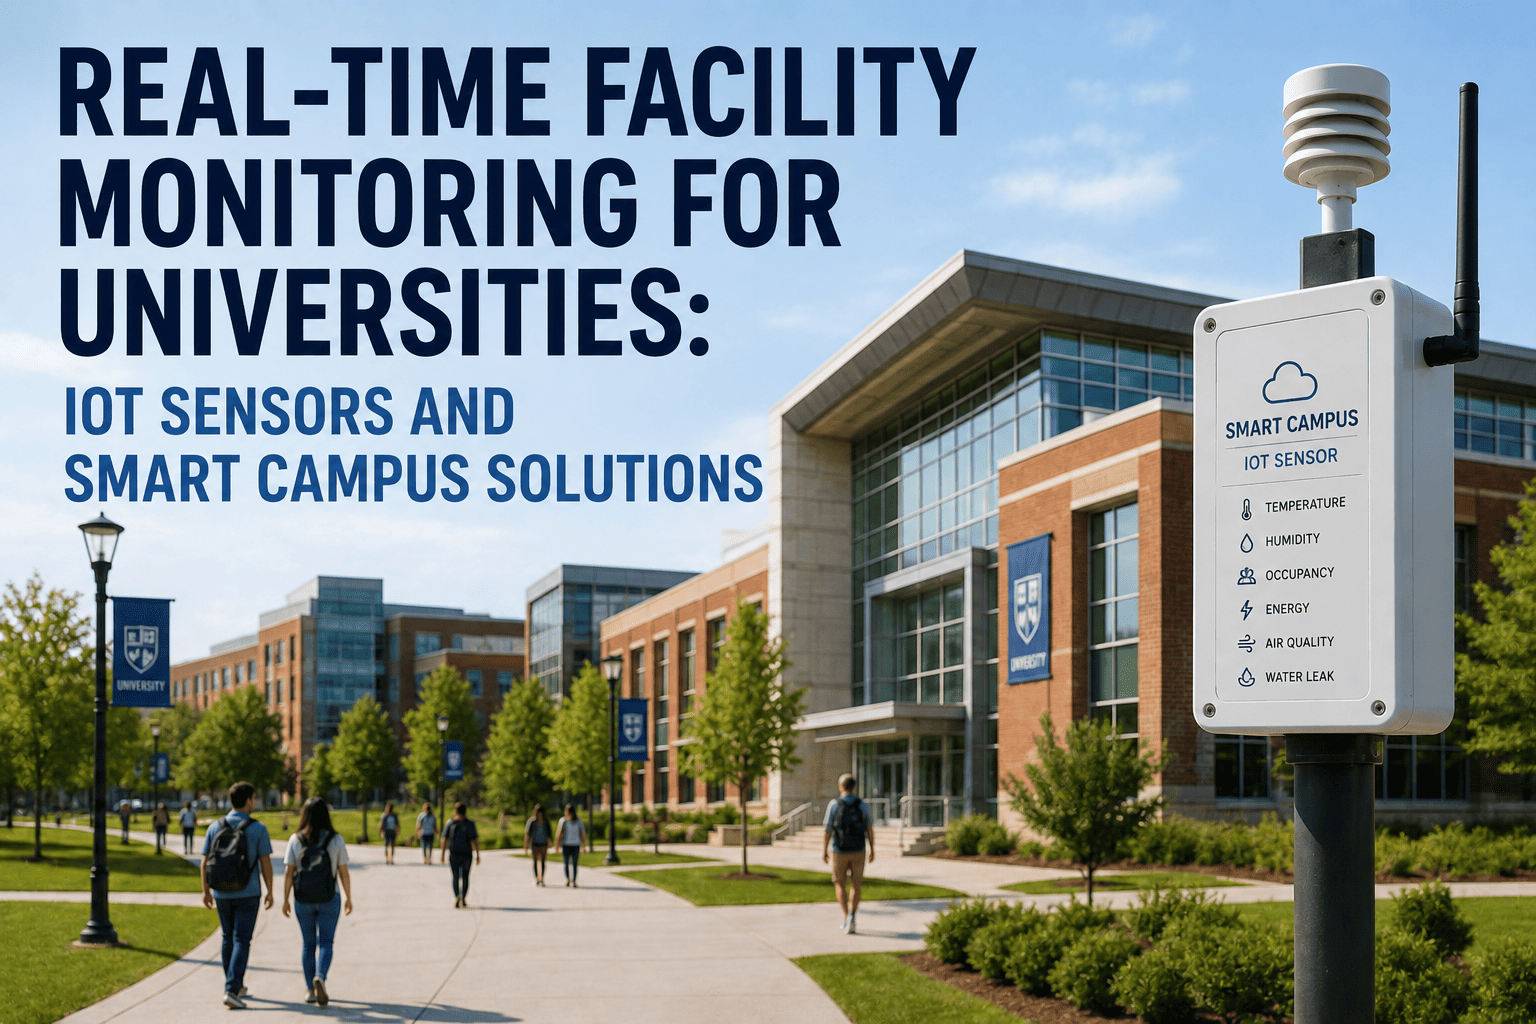
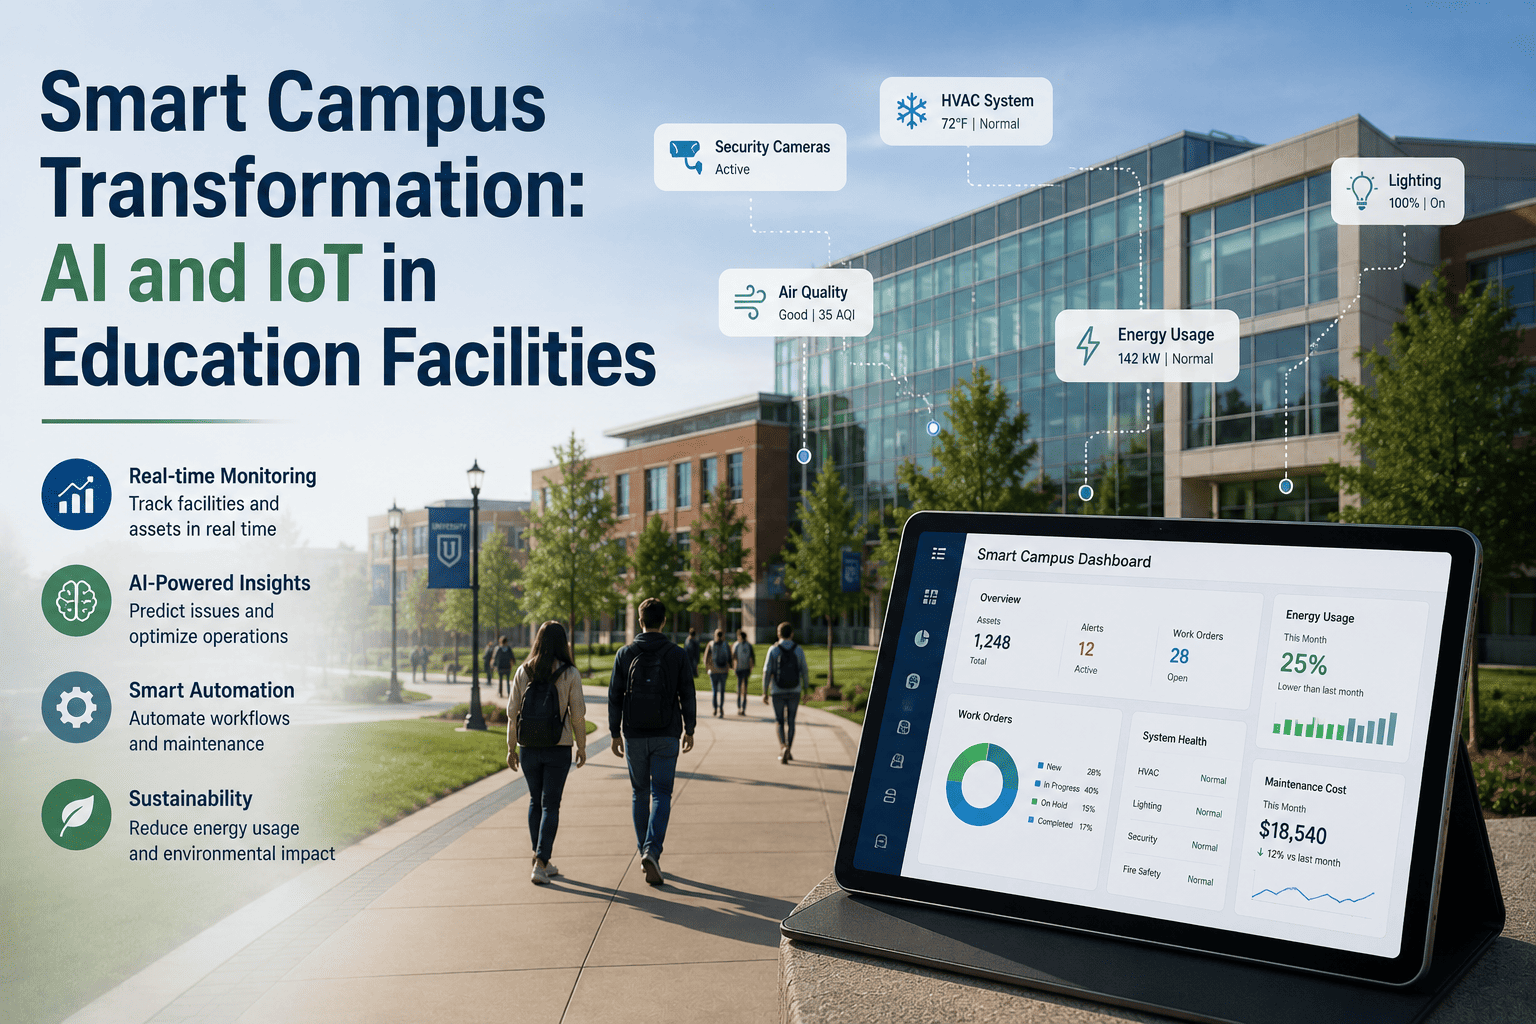
An Ohio university and its Michigan peer institution operate comparable square footage, similar building age, and equivalent staffing. The Ohio campus spent $4.7 million on facilities operations last year. The Michigan campus spent $1.9 million. The difference was not funding levels or building age — the Michigan campus deployed IoT-connected building systems, AI-driven maintenance scheduling, and real-time energy optimization three years earlier. The $2.8 million annual gap is the structural cost difference between a smart campus and a traditional one, and it compounds every year the transition is delayed. This comparison maps every cost category where smart campus infrastructure outperforms traditional operations — with the numbers a CFO needs to make the case. Book a demo to model the cost gap for your specific institution.
- Paper work orders & manual PM
- Calendar-based schedules
- Reactive emergency spend
- Aggregate utility billing
- AI-driven predictive maintenance
- IoT-connected building systems
- Real-time energy optimization
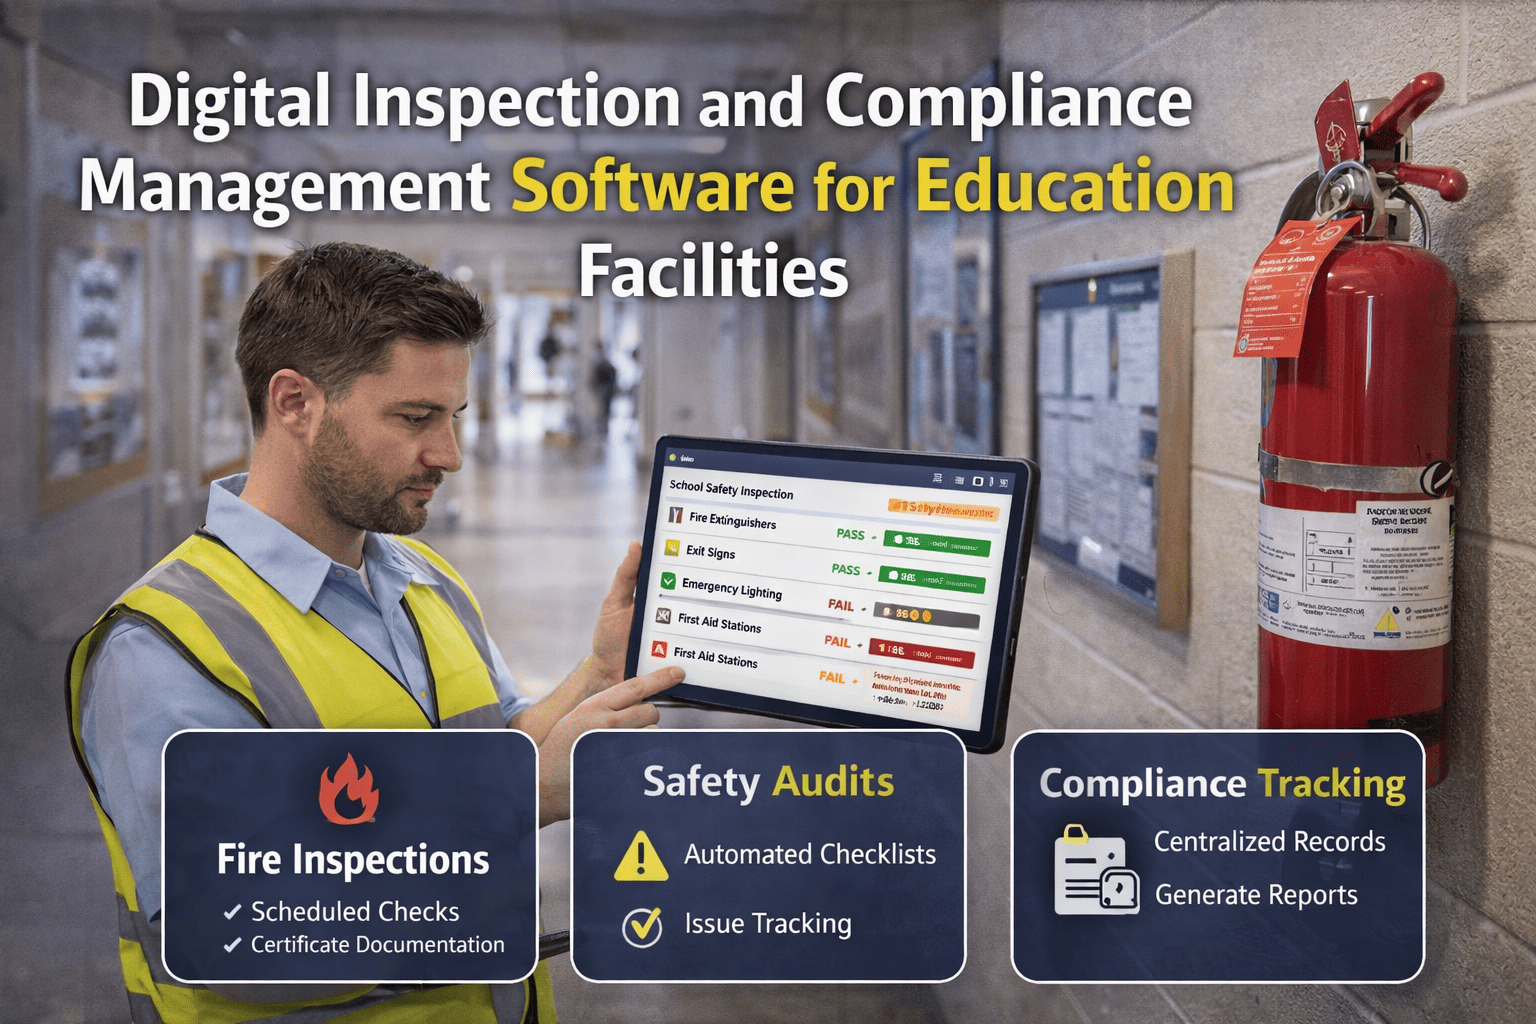
- Automated compliance tracking
Line-Item Cost Comparison: Where the Gap Is Built
Six cost categories account for the full operational gap between a traditional campus and a smart campus. Each line is measurable, documentable, and presentable to a board. iFactory scopes this comparison for your institution's actual cost baseline.
| Cost Category | Traditional Campus | Smart Campus | Annual Saving |
|---|---|---|---|
| Energy & utilities
Per 3M sq ft campus
|
$8–12M/yr
Fixed schedules, degraded HVAC, no anomaly detection
|
$6.5–9M/yr
AI optimization, anomaly alerts, occupancy-based control
|
$1.5–3M
15–25% reduction
|
| Emergency repairs
Reactive vs planned
|
$2–5M/yr
40–60% reactive spend at 3–4× planned cost
|
$0.6–2M/yr
Predictive scheduling converts emergency to planned work
|
$0.5–3M
40–70% fewer emergency WOs
|
| Compliance & audit prep
Fire, OSHA, ADA, accreditation
|
3–4 wks staff time per audit
Manual binder assembly, missed inspections, reinspection fees
|
Under 2 hrs per audit
Auto-scheduled inspections, digital records, instant audit pack
|
Weeks → Hours
+ fines & liability avoided
|
| Asset lifecycle costs
Replacement & capital
|
$5–20M capital deferred
No FCI data — reactive replacement at peak failure cost
|
Planned replacement schedule
FCI scoring + cost-of-deferral drives capital timing
|
3–5× cost avoided
Emergency vs planned rate
|
| Workforce productivity
Per technician per day
|
45–60% productive time
Paper work orders, manual routing, no mobile access
|
75–85% productive time
Mobile dispatch, digital checklists, AI-prioritized queue
|
+25–35%
More work, same headcount
|
| Deferred maintenance growth
Annual backlog accumulation
|
+6–8% per year
$11.4M added annually — no lifecycle tracking
|
Stable or declining
Preventive programme + capital plan arrests accumulation
|
Arrests $11.4M/yr
Compounding liability stopped
|
The Gap in Three Numbers
Figures based on comparable 3M sq ft campus with similar building age and staffing. Sources: Gordian, APPA, published CMMS deployment studies. Actual results vary by institution.
Why the CFO Should Own This Decision
ROI Timeline: When the Smart Campus Investment Pays Back
FAQ: Smart Campus vs Traditional Campus Cost Comparison
Get the Cost Comparison for Your Institution
iFactory scopes the operational cost gap estimate for your campus before deployment — energy baseline, emergency repair rate, compliance cost, and asset lifecycle exposure. One platform. Documented ROI within 6–12 months for most institutions.