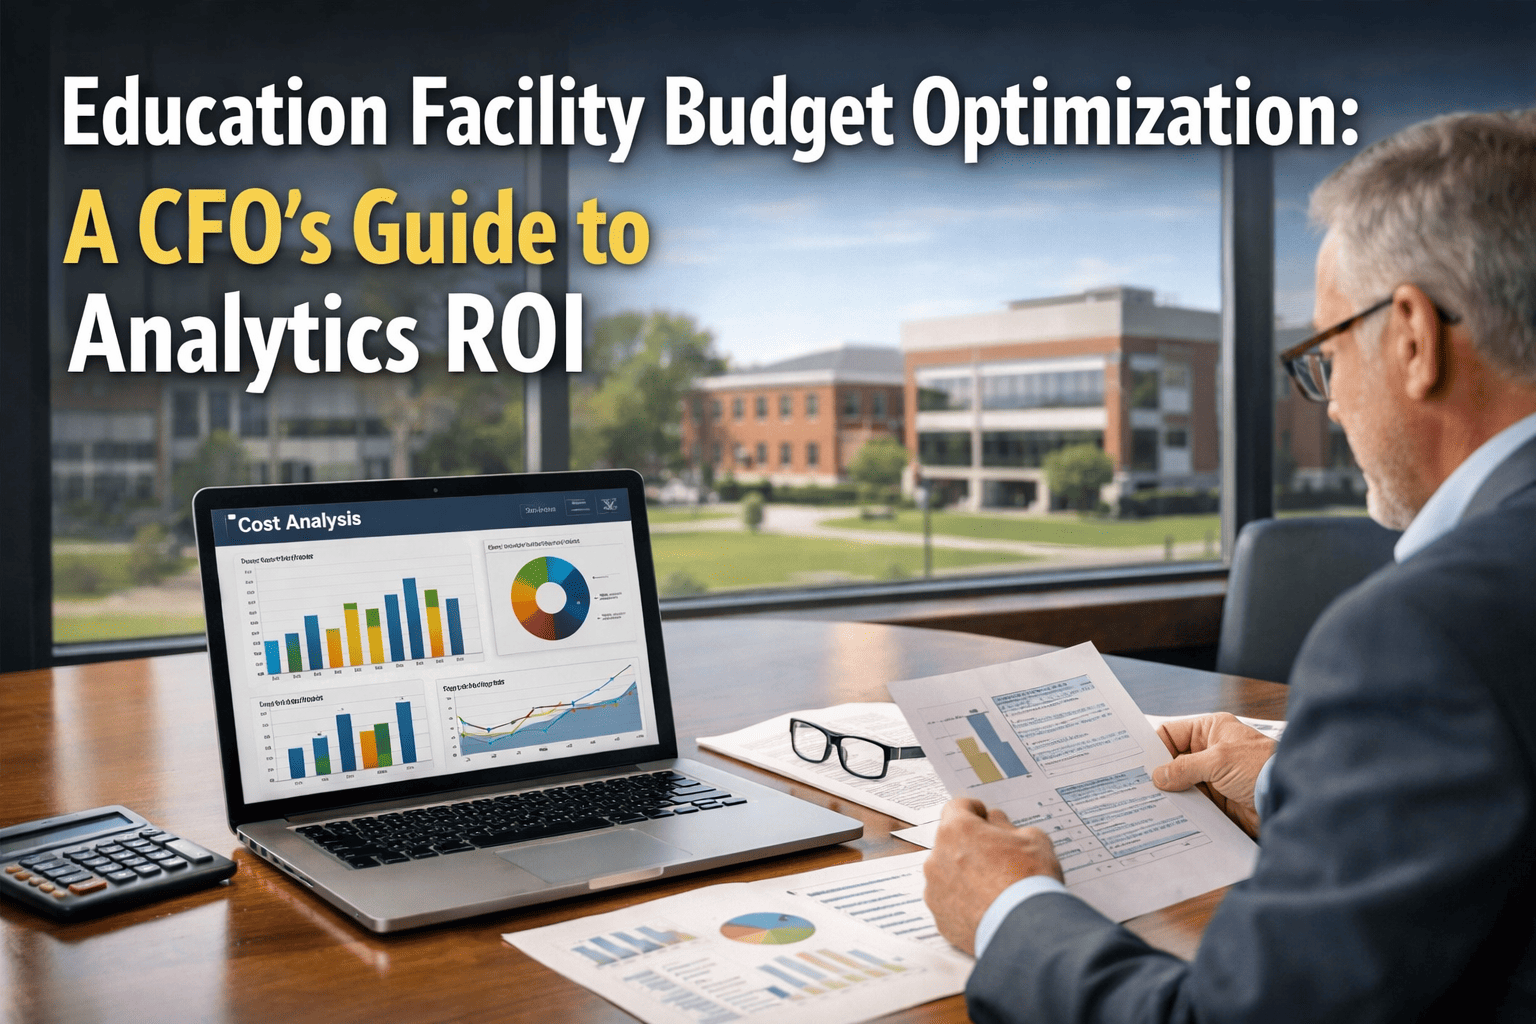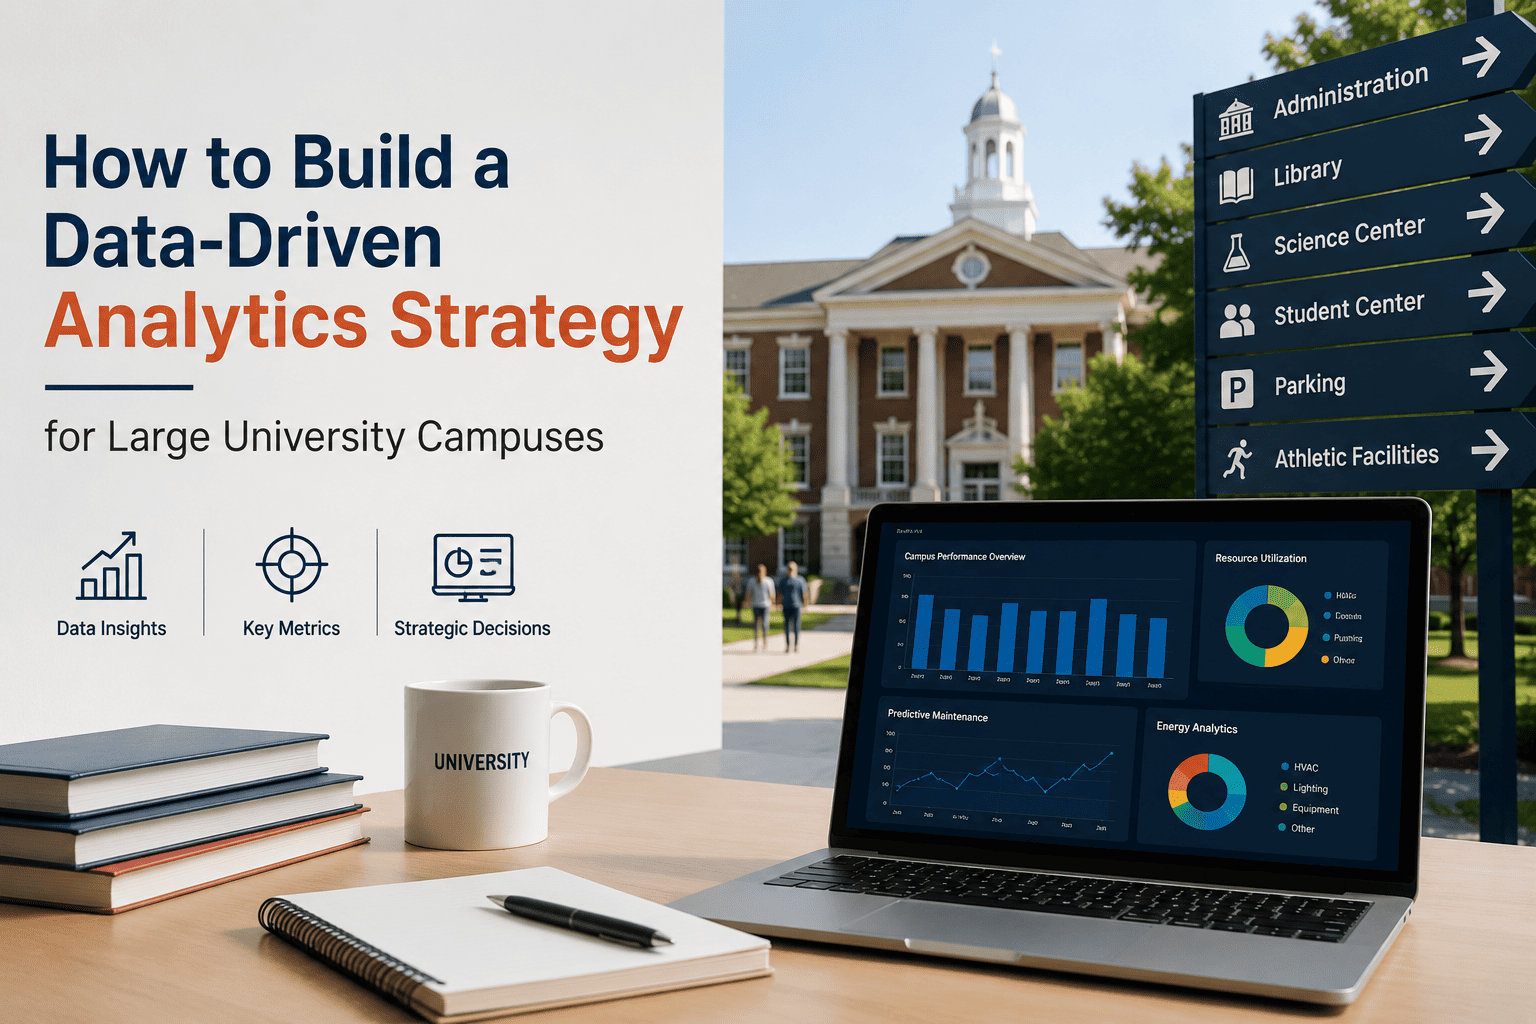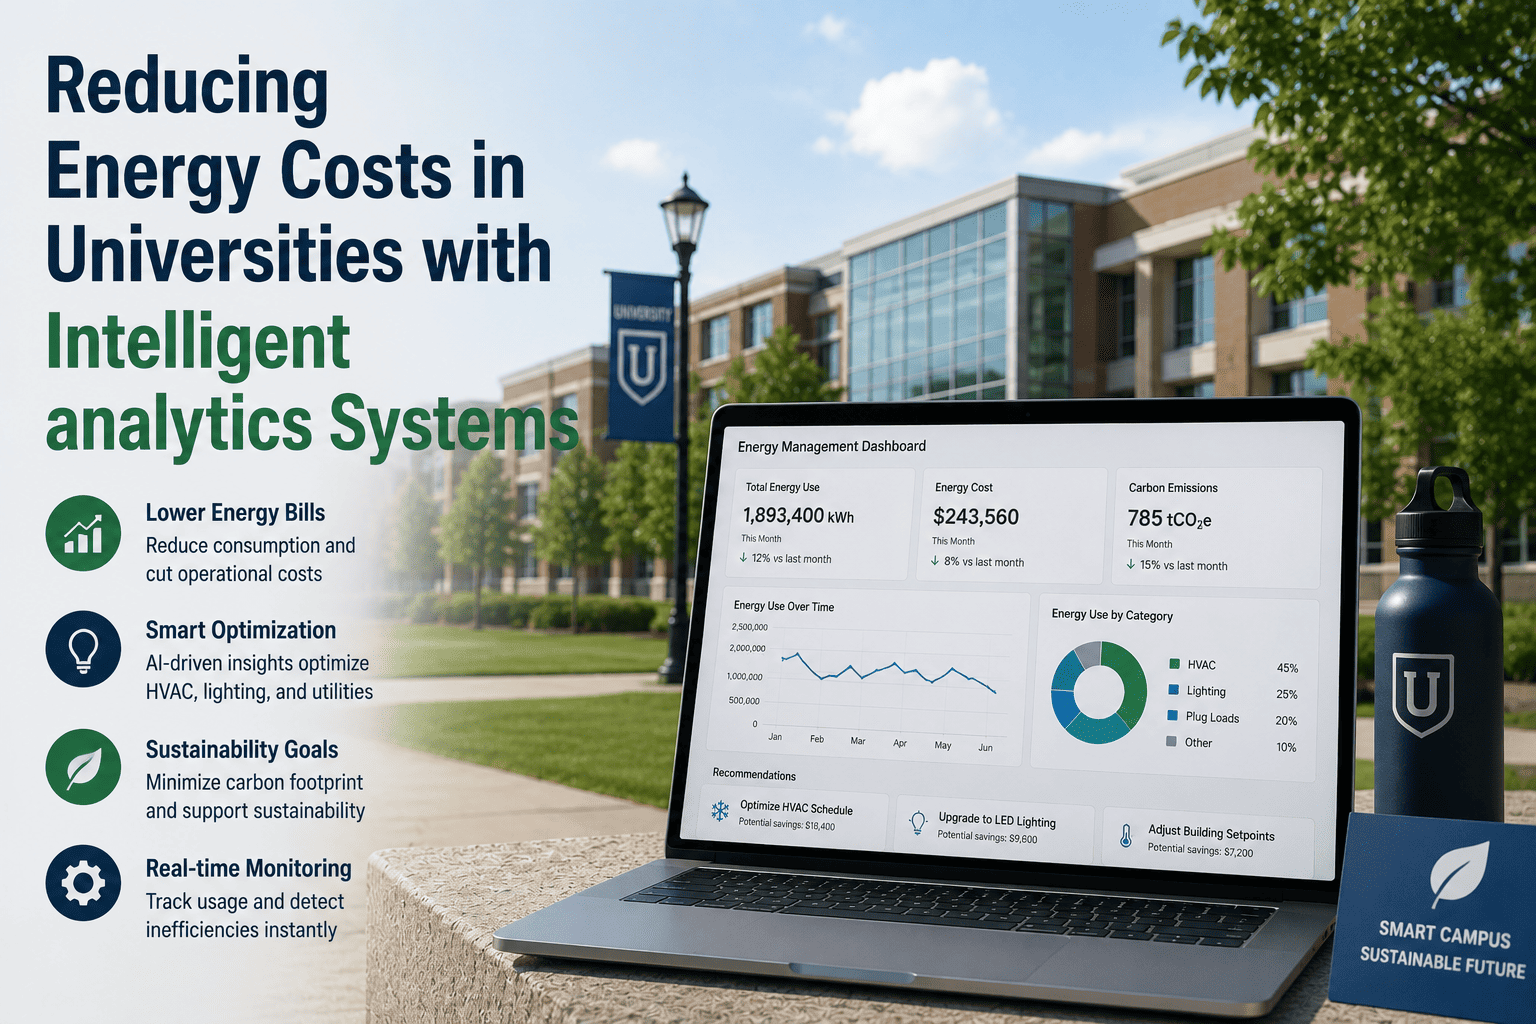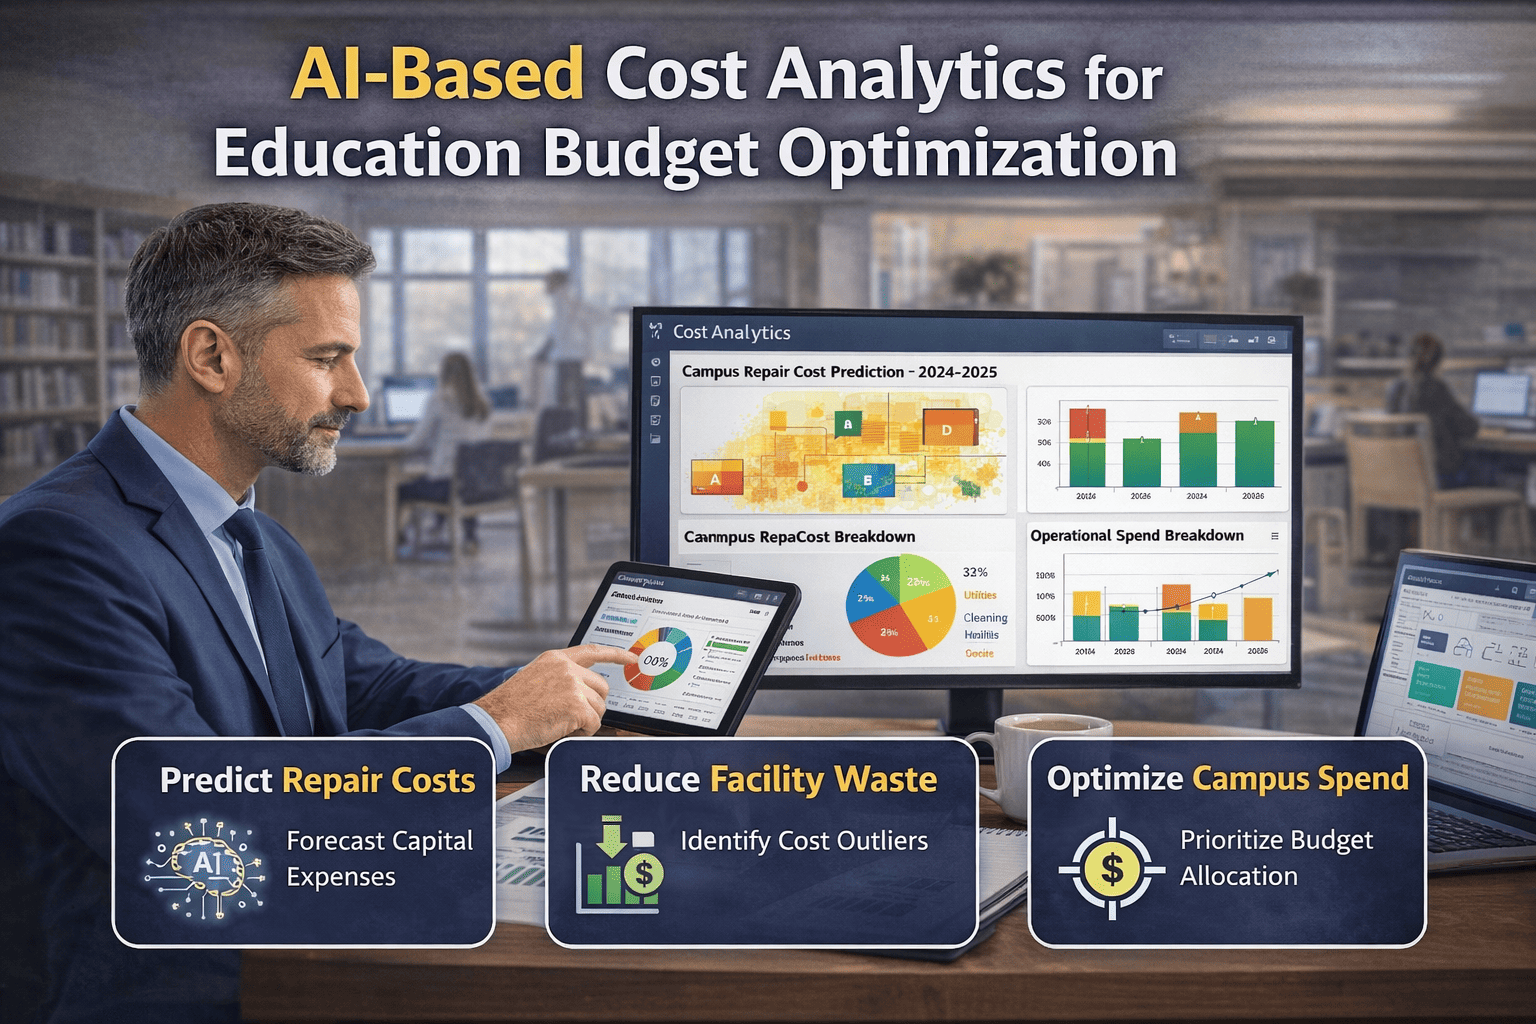
School district facility budgets are under constant pressure. Unexpected chiller replacements, emergency boiler repairs, and unbudgeted roof leaks consume funds that should go to classrooms, technology, and staff. Traditional budget cycles rely on historical spend plus inflation — a method that assumes next year will look like last year. But equipment deterioration does not follow a linear path, and capital surprises cannot be predicted with spreadsheets. AI-powered cost analytics changes this by continuously analyzing equipment condition data, work order history, and failure patterns to forecast repair expenses, flag assets approaching end of life, and recommend optimal intervention timing. For education finance leaders, this means fewer budget surprises, better capital planning, and defensible data when presenting to school boards or university finance committees. See how AI cost analytics transforms facility budgeting — Book a Demo.
Stop guessing next year's repair spend. Use AI to forecast equipment failures, optimize capital replacement timing, and present data-backed budget requests to school boards and finance committees.
The Cost of Unplanned Repairs: Why Education Budgets Need AI
Unplanned repairs cost school districts and universities 30‑50% more than planned replacements — emergency contractor rates, expedited parts shipping, overtime labour, and disruption to instruction. Yet most education facilities budget for repairs using simple inflation factors applied to prior year spend. This method fails when equipment deterioration accelerates, when multiple high‑cost assets age out simultaneously, or when hidden failure modes go undetected. The result: budget variances that force mid‑year cuts elsewhere or emergency fund transfers that consume reserves.
AI cost analytics addresses this by modelling the relationship between equipment condition data — run hours, vibration, temperature cycles, work order history — and the probability and cost of failure over time. Instead of guessing "chiller replacement in 5 years," AI predicts "chiller CH‑3 has 85% probability of major failure within 8‑14 months, estimated repair cost $42,000‑$58,000, replacement cost $210,000." Finance leaders get a data‑driven range, not a single point estimate. The budget becomes a forecast, not a gamble.
What is AI Cost Analytics for Education Facilities?
AI cost analytics is not a budget spreadsheet with a dashboard. It is a machine learning system that ingests equipment data from your CMMS, BMS, and IoT sensors, then trains failure prediction models specific to your district's asset portfolio. The system learns which combinations of operating conditions, maintenance history, and environmental factors precede equipment failures. Once trained, it produces forward‑looking cost forecasts: probability of failure by asset, expected cost ranges, and optimal intervention timing (repair now vs. defer vs. replace).
Forecast Models: From Probability to Cost Ranges
AI cost analytics produces three types of forecasts, each useful for different budget and planning horizons. The models continuously retrain as new data arrives, improving accuracy over time.
For each asset, AI calculates percentage chance of failure within 1, 3, 6, 12, and 18 months. A chiller with 85% probability in 8 months triggers capital planning.
Low, expected, and high cost ranges based on similar past failures. A $210K chiller replacement shows $190K‑$240K range.
AI recommends lowest total lifecycle cost timing for repair vs. replace, balancing lower immediate cost against higher failure risk.
ROI Comparison: Before vs After AI Cost Analytics
| Metric | Before AI (Reactive) | After AI (Predictive) |
|---|---|---|
| Emergency repair spend (annual) | $180K – $250K | $110K – $150K |
| Budget variance (forecast vs actual) | 25‑40% | Under 10% |
| Capital surprises (unbudgeted >$20K) | 3‑5 per year | 0‑1 per year |
| Average emergency response cost | $8,200 | $4,100 (planned) |
| Equipment lifecycle (chillers) | 12‑14 years | 16‑18 years (proactive PM) |
| Staff time on budget reforecasting | 40 hours/month | 8 hours/month |
Capital Planning and Multi‑Year Budget Optimization
For education finance leaders, the most valuable output of AI cost analytics is a defensible, multi‑year capital plan. Instead of relying on intuition or manufacturer-rated life, AI uses your district's actual failure history to predict when assets will need replacement. The result is a rolling 5‑year forecast of expected repair and replacement costs by building and system.
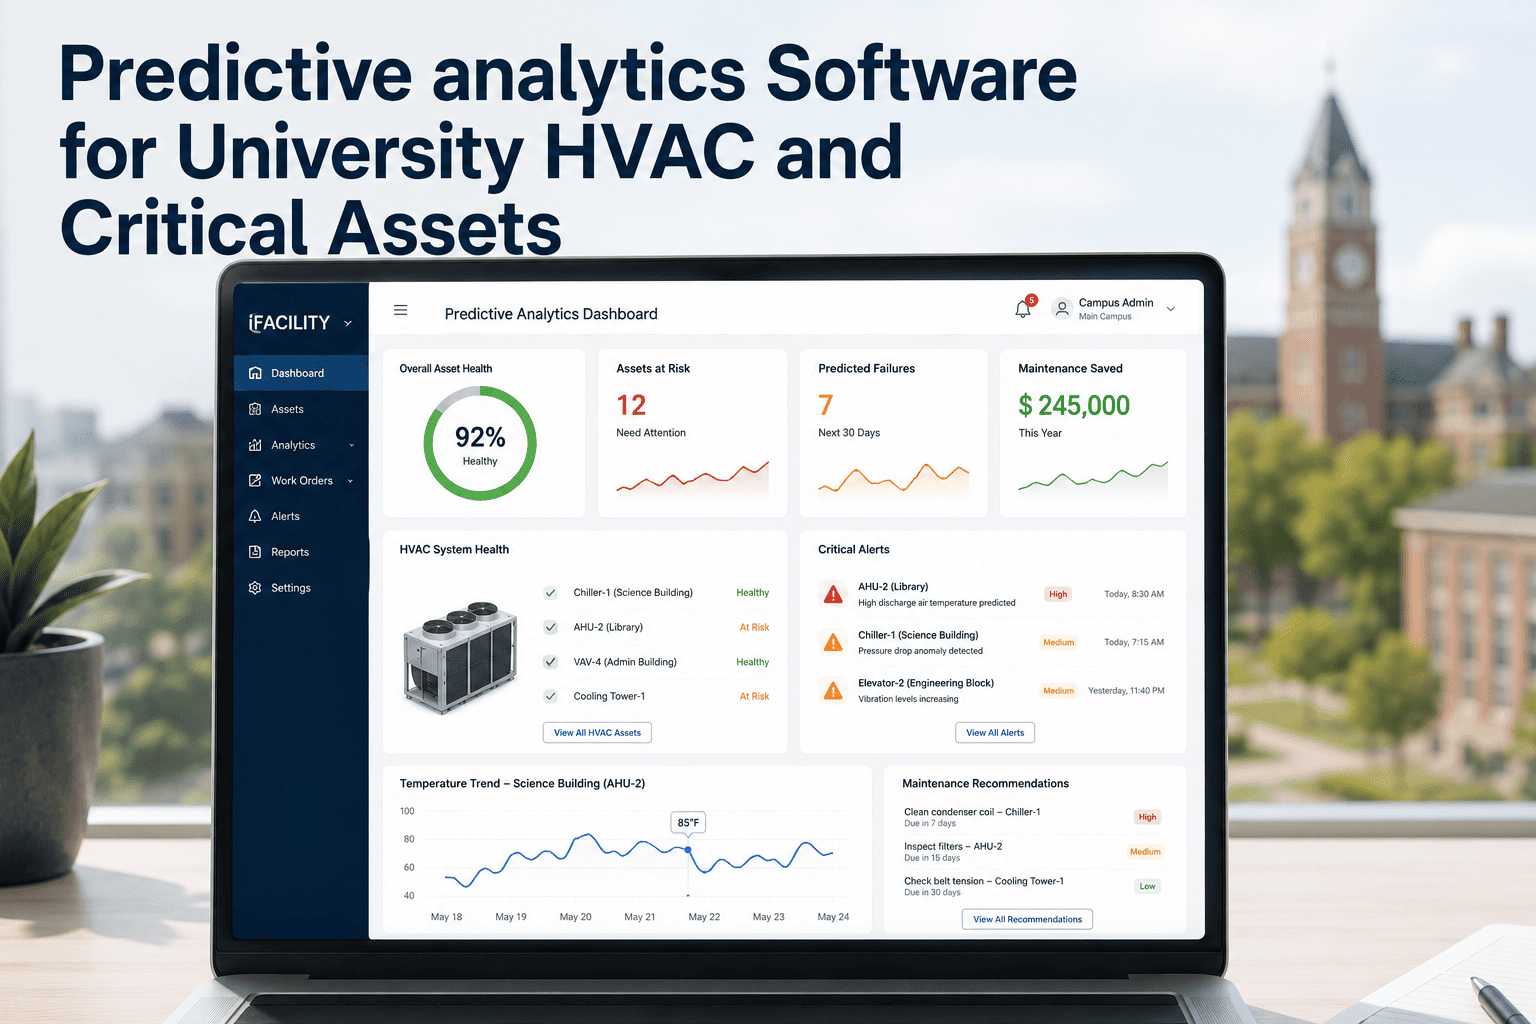
AI assigns each asset a health score from 0‑100 based on failure probability — replace below 20, monitor 20‑60, healthy above 60.
Expected repair and replacement costs by year with probability ranges — "2027 expected chiller spend: $180K‑$230K."
Test budget decisions: "If we defer chiller replacement by 2 years, additional repair cost is $47K with 62% failure probability."
Export capital plans with data sources and confidence intervals — no more "we think the roof needs replacement."
Case Example: 12‑School District Saves $187,000 in First Year
A suburban school district with 12 schools, 800,000 square feet, and an annual facilities budget of $2.8M implemented iFactory AI cost analytics. The district had experienced three unbudgeted emergency repairs in the prior year — a failed chiller ($48,000), a boiler tube leak ($22,000), and a rooftop compressor failure ($15,000).
After 6 months of AI training, the platform predicted a gymnasium air handler with 78% failure probability in 4‑6 months — inspection found a failing bearing, replaced for $4,500 instead of $18,000 emergency repair. It also flagged a chiller with 92% failure probability in 8‑10 months — district scheduled replacement during summer break, budgeting $210K versus a $280K emergency quote. Total documented savings: $187,000 in the first year. See a personalized case study — Book a Demo.
How iFactory Delivers AI Cost Analytics for Education
iFactory's AI cost analytics module integrates with your existing CMMS and BMS — no system replacement required. The AI models train on your data only. Outputs include asset health scores, failure probability timelines, cost ranges, and multi‑year capital forecasts.
Frequently Asked Questions
Join districts using AI cost analytics to reduce emergency spend by 30‑40% and present data‑backed capital plans. Implementation in 60‑90 days.