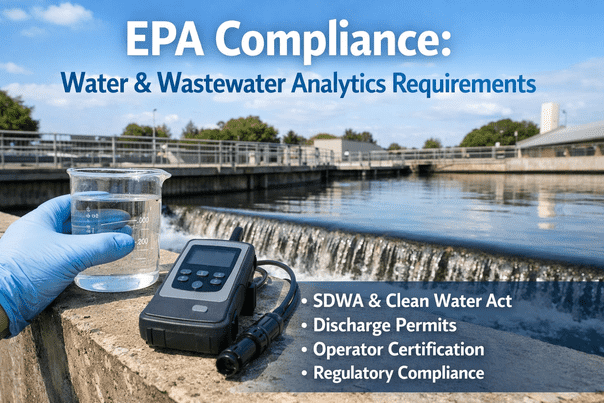
A wastewater treatment plant that receives an EPA consent order for permit exceedances does not fail because of a single equipment failure. Each of those conditions was detectable weeks before the exceedance event from dissolved oxygen sensors, influent flow data, and UV intensity readings already connected to the plant's SCADA. The problem is that SCADA threshold alarms only fire when a parameter is already out of range, and by then the treatment process is already compromised. iFactory's AI platform connects to your existing WWTP SCADA, reads the same sensor data your operators already collect, and issues graduated process alerts when any parameter begins trending toward compliance risk, hours to days before any threshold is breached. Book a free WWTP operations assessment for your facility.
Blog
Wastewater Treatment Plant Analytics Best Practices
9 min read
Quick Answer
iFactory monitors wastewater treatment plants across five equipment and process categories: preliminary treatment (screens, grit), primary clarification, secondary biological treatment (aeration, activated sludge), tertiary treatment and disinfection (UV, chlorination, filtration), and solids handling and biosolids. All monitoring connects to existing SCADA via OPC-UA or Modbus with no control system modification. Effluent permit exceedances are predicted 6 to 48 hours in advance, enabling process corrections before any compliance threshold is reached.
Five-Category WWTP Monitoring: Equipment, Process, and Compliance
Wastewater treatment involves more asset classes than drinking water treatment, with higher variability in influent load and composition. iFactory monitors all five treatment categories simultaneously, connecting process parameter alerts directly to maintenance work orders for the mechanical equipment that drives each biological and physical treatment stage. Book a demo to see all five categories configured for your treatment technology and permit requirements.
01
Preliminary Treatment: Screens and Grit Removal
Equipment failure here affects every downstream process stage
Bar Screens and Fine Screens
Screen differential pressure monitoring detects blinding before bypass. Screen drive motor current trending detects jam loading before drive trip. Screenings accumulation rate tracking triggers cleaning cycle.
Grit Chambers and Classifiers
Grit pump flow and pressure trending detects wear before failure. Classifier motor current monitoring. Grit volume tracking alerts when accumulation rate changes indicating increased inorganic load.
Influent Pumping Station
Pump vibration and bearing temperature predictive monitoring. Pump efficiency trending detects impeller wear. Wet well level and pump cycle analysis identifies infiltration and inflow events.
02
Primary Clarification
Sludge blanket control directly affects secondary treatment loading
Primary Clarifier Mechanism
Collector drive torque and current monitoring detects sludge overloading before drive trip. Mechanism speed and position monitoring. Drive bearing temperature trending for predictive maintenance.
Primary Sludge Pumps
Flow rate and pressure trending per pump. Pump wear detection from efficiency decline. Sludge blanket depth correlation to pump cycle frequency for optimal desludging scheduling.
Primary Effluent Quality
TSS carryover trending to secondary treatment. BOD loading rate calculation from primary effluent quality and flow for secondary aeration adjustment. Clarifier surface scum detector integration.
03
Secondary Biological Treatment
Aeration and activated sludge control is the core of effluent quality
Aeration System
DO (dissolved oxygen) per zone versus setpoint trending detects aeration capacity decline before effluent quality impact. Blower/diffuser efficiency monitoring. Air flow rate per zone versus MLSS loading correlation. Blower motor vibration and bearing temperature prediction.
Activated Sludge Control
MLSS concentration trending per basin. SVI (Sludge Volume Index) trending detects bulking before clarifier carryover. F/M ratio calculation from influent load and MLSS for optimal WAS rate. RAS pump performance monitoring.
Secondary Clarifiers
Sludge blanket depth per clarifier with overflow risk alert. Secondary effluent TSS trending before permit limit approach. Clarifier mechanism drive torque monitoring. RAS and WAS pump efficiency tracking.
04
Tertiary Treatment and Disinfection
Final barrier before effluent discharge to receiving water body
UV Disinfection System
Per-lamp UV intensity degradation trending triggers cleaning or replacement before dose credit falls below permit minimum. Transmittance monitoring for effluent quality impact on UV dose. Sleeve fouling detection from intensity versus age model.
Chlorination and Dechlorination
Residual chlorine versus flow trending for chemical feed optimization. Feed pump performance monitoring. Contact tank CT calculation for permit compliance verification. Sodium bisulfite dose ratio tracking for dechlorination permit compliance.
Tertiary Filtration (where applicable)
Filter effluent turbidity per cell. Backwash cycle timing optimization from headloss trending. Filter media performance trending for backwash frequency and TSS removal efficiency tracking.
05
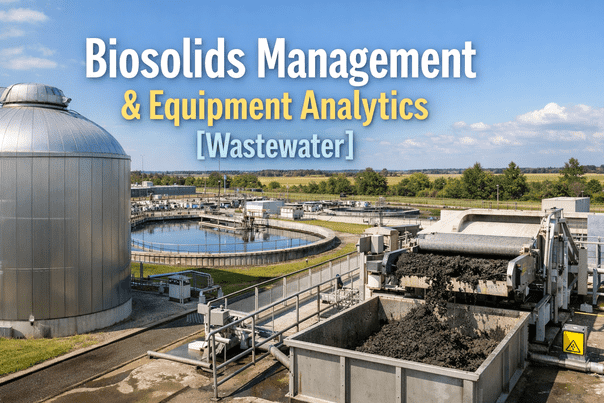
Solids Handling and Biosolids
Solids processing reliability directly impacts plant capacity and Class A/B compliance
Anaerobic Digesters
Digester temperature trending for thermophilic or mesophilic stability. Gas production rate and quality (methane percentage) monitoring. Volatile solids reduction efficiency tracking. Mixing equipment motor current and vibration prediction.
Dewatering Equipment
Centrifuge or belt press vibration and bearing temperature predictive monitoring. Cake solids content trending for polymer dose optimization. Polymer feed pump performance tracking. Throughput rate versus design capacity monitoring.
Biosolids Class Compliance
Class A pathogen reduction monitoring from time-temperature data for thermal drying or alkaline stabilization. Class B fecal coliform sampling correlation with process parameters. 503 permit parameter trending and automated evidence compilation.
iFactory Monitors All Five WWTP Categories from Your Existing SCADA. Permit Risk Detected Hours Before Any Threshold Is Reached.
Most wastewater treatment plants have the instrumentation needed for all five monitoring categories already connected to SCADA. iFactory reads your existing data and begins building the process baselines needed for predictive compliance monitoring within the first week of deployment.
Client Results: Wastewater Plants Using iFactory
Zero
EPA Consent Orders in 24 Months Post-Deployment
Average consent orders or enforcement actions received by iFactory WWTP customers in the 24 months following deployment, down from an average of 1.8 per plant per year before iFactory.
18%
Aeration Energy Cost Reduction
Average aeration blower energy cost reduction through DO control optimization and load-based aeration adjustment, the single largest energy cost item at most biological treatment plants.
22%
Polymer Dose Cost Reduction
Average reduction in polymer consumption at dewatering through cake solids optimization and polymer feed dose correlation to sludge characteristics from upstream process monitoring.
3 days
Advance Notice of Biological Upsets
Average advance notice before biological treatment upsets (bulking, toxics washout, nitrification failure) detectable from MLSS, SVI, and DO trending, enabling corrective action before effluent quality impact.
"Our 85 MLD secondary treatment plant received a consent order after two consecutive months of TSS exceedances. The investigation traced the exceedances to activated sludge bulking that our operators had not detected until the secondary clarifiers were already overflowing. When we deployed iFactory, we connected to our existing SCADA sensors and within 48 hours had baseline SVI, MLSS, and DO profiles for all three biological basins. Four months after go-live, iFactory detected a rising SVI trend in Basin 2 while SVI was still at 140 mL/g, well within normal range. The alert triggered a coring investigation that found a developing filamentous bacteria population. We adjusted the RAS rate and F/M ratio. The bulking never developed. We avoided what would have been our third consent order event."
Director of Operations
Regional Water Reclamation District, Dubai Industrial City, UAE
Biological Upsets, Blower Failures, and UV Dose Deficits All Have Detectable Precursors. iFactory Finds Them First.
Every WWTP permit exceedance that results in an EPA enforcement action begins with a detectable process deviation days before effluent quality is affected. iFactory monitors every parameter your process instruments already measure and alerts your team when any deviation begins trending toward compliance risk.
iFactory vs Competing WWTP Operations Platforms
WWTP operations platforms range from standalone CMMS to full process analytics systems. The key differentiator is whether the platform integrates process biology monitoring (DO, MLSS, SVI) with mechanical equipment predictive maintenance in a single system. Book a demo to see iFactory compared to your current CMMS and process monitoring approach.
| Capability |
iFactory |
Siemens Insights Hub |
SafetyCulture |
Fracttal |
Fiix (Rockwell) |
MaintainX |
Limble CMMS |
WorkClout |
| Biological Process Monitoring |
| DO, MLSS, SVI biological process trending |
Full biological process AI |
Via MindSphere config |
Checklist only |
CMMS only |
CMMS only |
CMMS only |
CMMS only |
Checklist only |
| Bulking and foaming early prediction (3+ days advance) |
SVI trend + DO correlation |
Configurable |
No |
No |
No |
No |
No |
No |
| Mechanical Equipment and Compliance |
| Blower and pump predictive failure detection |
48 to 96 hours advance |
Via MindSphere AI |
No |
No |
No |
No |
No |
No |
| Automated EPA monthly discharge report data |
Auto-compiled, 4 hours |
Custom reports |
Audit reports |
No |
No |
No |
No |
Audit reports |
| On-premise deployment (no cloud data egress) |
Full on-premise |
Cloud or hybrid |
Cloud SaaS |
Cloud SaaS |
Cloud SaaS |
Cloud SaaS |
Cloud SaaS |
Cloud SaaS |
Based on publicly available product documentation as of Q1 2025. Verify capabilities with each vendor before procurement decisions.
Regional Compliance: WWTP Discharge Permit Requirements
Wastewater treatment plant discharge permits are issued under national and regional regulatory frameworks that mandate continuous monitoring, automated reporting, and increasingly stringent nutrient limits. iFactory's on-premise architecture ensures all effluent quality and process data remains within your facility and meets local data sovereignty requirements.
| Region |
Key WWTP Regulations |
iFactory Compliance Coverage |
| USA |
Clean Water Act (CWA) NPDES permit program, EPA 40 CFR Part 503 (biosolids), Secondary Treatment Regulations (40 CFR Part 133), EPA MSGP for stormwater, Nutrient limits (TN, TP, ammonia) under state-specific NPDES permits, eReporting Rule (electronic DMR submission via NetDMR/myDEQ) |
NPDES permit parameter continuous monitoring with pre-alert thresholds. Part 503 Class A/B compliance tracking. Automated DMR data compilation for NetDMR/myDEQ submission. Nutrient limit trending and alert. All data on-premise within US jurisdiction. |
| UAE |
UAE Federal Law No. 24 for water and environment, Ministry of Climate Change and Environment (MOCCAE) wastewater discharge standards, Dubai Municipality Technical Guidelines for Treated Effluent, Abu Dhabi Environment Agency (EAD) Tier-based discharge standards, UAE.S GSO 2483 treated wastewater quality |
UAE/MOCCAE discharge standard continuous monitoring. Dubai Municipality treated effluent quality tracking. EAD Tier compliance parameter trending. Arabic platform outputs. All data on-premise within UAE. Monthly compliance report in Arabic and English. |
| UK |
Environment Act 2021, Environmental Permitting Regulations 2016, Environment Agency (EA) Water Framework Directive discharge consents, Urban Wastewater Treatment Directive (UWWTD) requirements, EA Operator Monitoring Assessment (OMA) standards for discharge monitoring |
EA discharge consent parameter continuous monitoring. UWWTD compliance evidence generation. OMA monitoring standard compliance. Environment Act 2021 storm overflow monitoring. All data on-premise within UK jurisdiction. |
| Canada |
Wastewater Systems Effluent Regulations (WSER) under Fisheries Act, Provincial Environmental Compliance Approvals (Ontario ECA, BC Environmental Management Act, Alberta EPEA), Nutrient management regulations for biosolids, eReporting requirements under provincial EA legislation |
WSER effluent quality parameter tracking. Provincial ECA compliance monitoring with automated reporting data. Biosolids 503 equivalent nutrient management records. Bilingual EN/FR provincial report support. All data on-premise within Canada. |
| Germany / EU |
EU Urban Wastewater Treatment Directive (UWWTD) revised 2022, German Wastewater Ordinance (AbwV), Water Resources Act (WHG), Sewage Sludge Ordinance (AbfKlarV), EU Industrial Emissions Directive (IED) for large WWTPs, GDPR for operational data processing |
EU UWWTD revised compliance monitoring. AbwV discharge standard parameter tracking. AbfKlarV biosolids compliance evidence. EU IED monitoring for large facilities. GDPR-compliant on-premise data processing. EU data residency guaranteed. |
| Australia |
Environment Protection (Water) Policy under State Environment Protection Policies, Works Approval and EPA licenses for WWTP operation, National Water Quality Management Strategy (NWQMS), Australian Biosolids Guidelines (AGBs), ANZECC/ARMCANZ water quality guidelines |
EPA license parameter continuous monitoring. State SEPP compliance evidence generation. AGB biosolids quality tracking. ANZECC receiving water quality impact monitoring. All data on-premise within Australia. |
Frequently Asked Questions
How does iFactory detect early signs of activated sludge bulking before effluent quality is affected?
iFactory tracks Sludge Volume Index (SVI) trending, return activated sludge (RAS) performance, and dissolved oxygen per zone simultaneously. Bulking is detected by a combination of rising SVI (above 150 mL/g and trending upward), declining DO in specific zones suggesting filamentous organism growth, and increased RAS pumping frequency required to maintain MLSS concentration. This combination typically produces an alert 2 to 4 days before effluent TSS begins rising.
Book a demo to see bulking detection for your biological treatment configuration.
Can iFactory help with aeration energy optimization without compromising nitrification compliance?
Yes. iFactory models the relationship between influent loading, MLSS concentration, and oxygen demand to set a dynamic DO setpoint that maintains nitrification performance while minimizing blower energy. The model includes a safety margin above the minimum DO for nitrifier growth, which is adjustable per permit requirement and season. Average aeration energy savings are 15 to 22 percent without any reduction in effluent ammonia compliance performance.
Book a demo to review aeration optimization for your nitrification permit limits.
How does iFactory handle industrial discharge events that shock the biological process?
iFactory detects industrial discharge events from sudden changes in influent flow, pH, conductivity, or BOD proxy (UV254) and immediately alerts operators with an estimated impact on biological loading and treatment capacity. The platform can be configured to trigger pre-emptive actions such as increasing WAS rate, adjusting polymer dose, or diverting flow to equalization if available, before the shock load reaches the biological basins.
Book a demo to see industrial discharge shock detection for your pretreatment program.
How does iFactory generate the monthly Discharge Monitoring Report (DMR) data automatically?
iFactory stores all continuous effluent quality monitoring data with timestamps in an immutable on-premise database. At month end, the DMR data set is generated by querying this database for all permit parameters, calculating the required statistical summaries (daily maximum, monthly average, violation count), and exporting in the format required for NetDMR or your state equivalent. This replaces manual SCADA log review and takes approximately 2 hours versus the typical 1 to 2 days of manual preparation.
Book a demo to see DMR data generation for your specific permit and reporting system.
Can iFactory monitor biogas production from anaerobic digesters?
Yes. iFactory integrates with digester gas flow meters, methane analyzers, and temperature sensors to monitor biogas production rate, methane content, and volatile solids reduction efficiency. Declining gas production at constant feed is an early indicator of digester instability (pH drift, toxin accumulation) that iFactory detects 5 to 10 days before volatile acids accumulation causes a digester upset. Gas utilization in combined heat and power (CHP) units is also monitored for engine performance and biogas quality compliance.
Book a demo to see digester and biogas monitoring for your solids handling system.
Does iFactory work with older WWTPs that have legacy SCADA systems or limited instrumentation?
Yes. iFactory connects to legacy SCADA systems that support Modbus or DNP3, which includes virtually all WWTP control systems manufactured after 1995. For plants with limited instrumentation coverage, iFactory deploys wireless DO sensors, vibration sensors on key rotating equipment, and pH/ORP probes without requiring cabling infrastructure, connecting via industrial wireless protocols to the iFactory edge server.
Book a demo to review legacy SCADA connectivity and sensor options for your plant.
Continue Reading
Eliminate EPA Consent Orders, Reduce Aeration Energy by 18%, and Detect Biological Upsets 3 Days Before Effluent Quality Is Affected.
iFactory connects to your existing WWTP SCADA and monitors all five treatment categories simultaneously. All data on-premise, satisfying NPDES, CWA, and regional data sovereignty requirements. No SCADA modification. Deployment complete in 4 weeks.
Zero EPA Enforcement Actions
18% Aeration Energy Savings
3-Day Bulking Early Warning
On-Premise Zero Cloud
NPDES DMR Auto-Compiled
4-Week Deployment