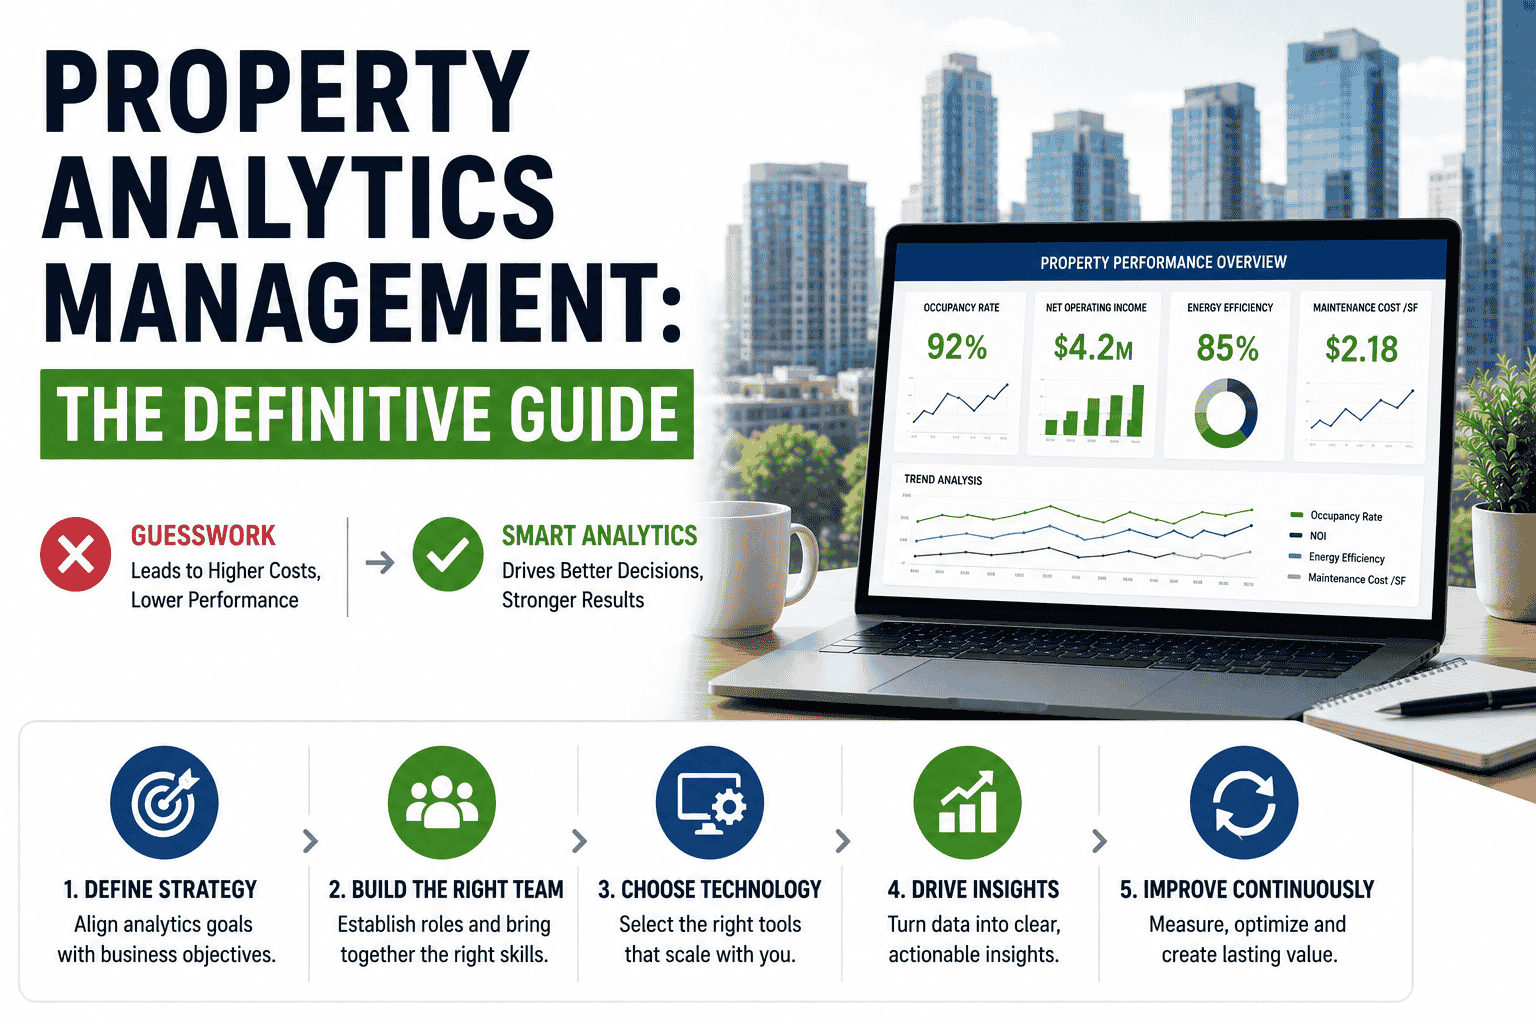
Property maintenance management has crossed from operational chore to strategic discipline — and the gap between portfolios that treat it as such and those still running on spreadsheets shows up directly in NOI, tenant retention, and asset valuation. iFactory Property Analytics Management brings strategy, team coordination, technology, and continuous improvement into one platform built for commercial real estate operators. Book a demo to see the definitive framework in action across your portfolio.
Property Maintenance Management,
From Strategy to Software
Everything property managers need to design a maintenance operation that protects asset value, retains tenants, and scales without proportional headcount growth.
The Four Pillars of Modern Property Maintenance Management
High-performing maintenance operations rest on four interconnected pillars. Strength in one without the others creates lopsided programs — a great team without technology drowns in coordination work; great technology without strategy automates the wrong things. This is the foundation every portfolio needs.
Strategy & Planning
Maintenance priorities tied to NOI goals. Annual maintenance calendars. Risk-weighted asset prioritization. Capital planning integrated with operational data.
Team Structure
Clear roles, career paths, and skill development. Right ratio of techs to units. Defined escalation paths. Vendor relationships managed as extension of internal team.
Technology Stack
CMMS platform with mobile-first workflows. IoT integrations. Tenant portal. AI-driven anomaly detection. Real-time dashboards across the portfolio.
Continuous Improvement
KPI dashboards reviewed weekly. Post-incident analysis. Quarterly process reviews. Benchmarking against industry standards and your own historical performance.
Where Does Your Portfolio Sit on the Maintenance Maturity Curve?
Most operators are somewhere between Stage 2 and Stage 3. The leap to Stage 4 — predictive, intelligent maintenance — is where competitive separation happens in 2026. Honest self-assessment is the starting point for any improvement plan.
Fix When Broken
No PM program. Requests live in phone calls and email. Vendor selection is informal. Reporting compiled by hand at month-end.
Digital Intake
Basic CMMS in place. Some PM scheduled. Work orders centrally tracked. Manual dispatch still dominant. KPIs reviewed monthly.
Workflow Automation
PM compliance >90%. Auto-routing on most requests. Vendor scorecards. Real-time KPI dashboards. Mobile-first technician workflows.
Intelligent Operations
IoT sensor integration. AI anomaly detection. Predictive failure modeling. Portfolio-wide benchmarking. Operations as competitive moat.
The Three Maintenance Team Models
How you structure your team determines how well the operation scales. Each model has a clear sweet spot — and a clear failure mode. Choosing the right one for your portfolio size and asset mix is one of the highest-leverage decisions in maintenance management.
Portfolio Model
One manager handles everything for a set of properties end-to-end.
Best For
- Smaller portfolios (under 200 units)
- Geographically clustered properties
- Strong local tenant relationships
- Single asset class
Risks
- Knowledge concentrated in one person
- Doesn't scale past 8 properties
- Burnout from doing every role
Departmental Model
Specialists handle one function (maintenance, leasing, accounting) across all properties.
Best For
- Mid to large portfolios (500+ units)
- Multiple asset classes
- Strong central operations team
- Vendor consolidation priority
Risks
- Tenants pinball between departments
- Local context can be lost
- Cross-department coordination overhead
Hybrid Model
Portfolio managers own tenant relationship; centralized specialists handle maintenance, accounting, and reporting.
Best For
- Most portfolios above 200 units
- Mixed asset classes & geographies
- Operators planning to scale further
- Balance of scale + local context
Requires
- Clear authority boundaries
- Tech platform that supports both layers
- Disciplined SLAs between functions
Map Your Portfolio Against the Four Pillars in 30 Minutes
Our team walks through each pillar — strategy, team, tech, improvement — against your current operation and identifies the two or three changes that will move you up the maturity curve fastest.
Eight Criteria for Choosing a Maintenance Management Platform
Software selection is where many maintenance programs stall. The wrong platform creates more friction than it removes. These eight criteria separate platforms that genuinely fit property operations from generic tools that almost-fit.
Property-Native, Not Adapted
Built around lease cycles, tenant portals, and CRE workflows — not retrofitted from manufacturing CMMS.
Mobile-First Field Interface
Technicians complete work orders, upload photos, and log time from the job site — not from a desktop later.
Portfolio Hierarchy Support
Portfolio → Region → Property → Unit → Asset. Same hierarchy works for multifamily and Class-A office without dual systems.
Vendor Management Built-In
COI tracking, scorecards, invoice matching, and routing — without bolt-on integrations or third-party tools.
IoT Sensor Integration
Native support for MQTT, REST, and major sensor protocols so smart restroom, HVAC, and leak data flows into work orders.
Real-Time KPI Dashboards
Live MTTR, FTFR, PM compliance, and SLA scores — not monthly PDF reports that arrive after the fact.
PMS & Accounting Integration
Two-way sync with major property management and accounting platforms so data lives in one place across systems.
Self-Service Configuration
Property managers update SLAs, priority tiers, and vendor rules without engineering involvement or service tickets.
The Quarterly Optimization Cycle
Maintenance excellence isn't a destination — it's a habit of structured review. The portfolios pulling ahead in 2026 run a disciplined quarterly cycle that turns operational data into compounding improvements.
Measure
Pull MTTR, FTFR, PM compliance, SLA breach rate, CSAT, and cost-per-unit from the platform. Compare to prior quarter and industry benchmarks.
Diagnose
Identify the two metrics moving in the wrong direction. Drill into root causes — was it a vendor change, staffing gap, or process failure?
Intervene
Pick one focused intervention per identified issue. Update rules in the platform, retrain a team segment, or renegotiate a vendor SLA. Avoid changing six things at once.
Validate
Measure the same metrics 90 days later. Did the intervention work? Keep what moved the needle. Discard what didn't. Document both for institutional memory.
Frequently Asked Questions
What's the most important pillar to start with if we can't tackle all four at once?
Start with Technology — specifically a property-native CMMS. It's the only pillar that immediately reveals what's broken in the other three. Without centralized data, strategy decisions are guesses, team performance is invisible, and improvement cycles have no baseline to measure against. Most portfolios see meaningful operational lift within 90 days of platform adoption.
How long does it take to move from Stage 2 to Stage 3 on the maturity curve?
Most portfolios complete the Stage 2 to Stage 3 transition in 6–9 months. The technology change happens in weeks; the workflow adoption and team habit change takes longer. The jump from Stage 3 to Stage 4 typically requires another 12–18 months as IoT sensor deployments and AI models accumulate enough operational data to make predictions reliable.
Do small portfolios actually need a formal maintenance management framework?
Yes — and they benefit disproportionately. Smaller operators rarely have specialized roles, so framework discipline compensates for missing organizational structure. A 50-unit operator using the four-pillar framework will outperform a 200-unit operator running on spreadsheets. The framework matters more for small portfolios, not less.
How do we measure if maintenance management is actually improving over time?
Track six metrics: MTTR (downward trend), FTFR (upward), PM compliance (above 95%), SLA breach rate (downward), tenant CSAT on completed orders (above 4.5), and cost per unit (stable or downward). Year-over-year comparison on these six gives you a defensible answer to "is maintenance getting better?"
What's the biggest mistake operators make when modernizing their maintenance program?
Trying to change all four pillars simultaneously. New software, new team structure, new strategy, and new KPI cadence in the same quarter overwhelms everyone and creates change fatigue. Sequence the changes — technology first, then team workflows, then strategy refinement, then continuous improvement habits. Each phase typically takes one quarter.
Build a Maintenance Operation That Actually Compounds Value
Replace fragmented tools and reactive habits with a unified framework — and watch every quarter's improvements stack into a lasting operational advantage your competitors can't match.