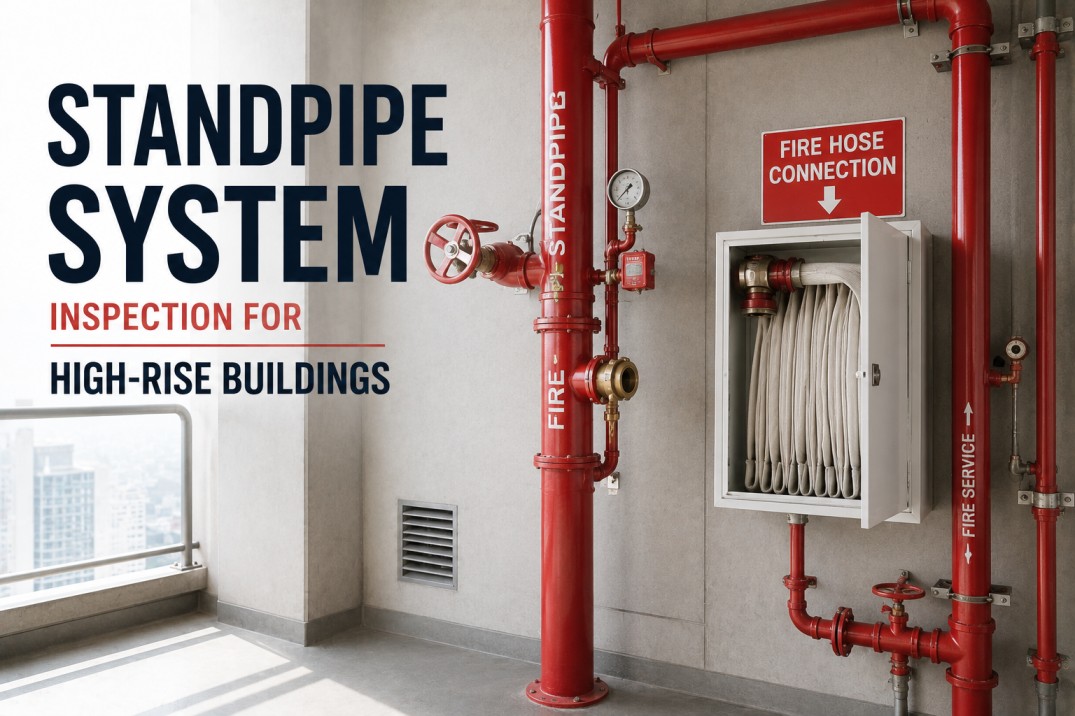
Twelve months ago, the operations team at a 45-story commercial tower in Chicago was spending 38 hours per week manually checking standpipe pressure gauges across 22 zones. They still had two near-miss dry-system events during fire pump tests. Today, the same team gets a live pressure dashboard on a single screen, zero manual rounds, and they caught a 12 psi drift in Zone 7 before the fire marshal's annual inspection. That shift — from reactive fire-safety management to predictive standpipe analytics — is what this page is about.
Zero dry-system events. Zero manual pressure rounds. One unified standpipe dashboard.
iFactory ingests live pressure, flow, and valve-position data from every standpipe riser in your building — no cloud dependency, no data leaving your network — and delivers a working pilot in 6–12 weeks.
What one high-rise achieved in 10 weeks with iFactory standpipe analytics
These are real results from a 38-story Class A office tower that deployed iFactory across 18 standpipe zones. No cloud. No data egress. Just a turnkEY pilot that paid for itself before the first quarterly review.
What iFactory standpipe analytics actually does
This is not a cloud dashboard that polls once an hour. iFactory lives on your plant network, ingests live sensor data at sub-second intervals, and surfaces what matters — before it becomes a code violation or a fire-safety incident.
Live pressure & flow monitoring
Ingest data from every pressure transducer, flow switch, and valve position sensor on your standpipe risers. iFactory displays real-time psi, gpm, and open/closed status per zone on a single pane of glass.
Predictive drift detection
iFactory models normal pressure decay for each riser based on building height, ambient temperature, and pump cycling. When a zone deviates beyond 5% of its baseline, the system alerts your team — not the fire marshal.
Code-compliance audit trail
Every pressure reading, every valve position change, every test event is timestamped and stored on-premise. NFPA 25, local fire code, and insurance audit reports generate in one click — no spreadsheets.
Dry-system early warning
When a zone's static pressure drops below the NFPA 25 minimum (typically 100 psi for a high-rise standpipe), iFactory alerts your team within 30 seconds. No more discovering a dry system during pump testing.
Valve tamper alerts
If a gate valve on a standpipe riser is partially closed — whether by a contractor, a tenant improvement crew, or vibration — iFactory flags the change in flow characteristics and pinpoints the exact valve.
Multi-building aggregation
Manage standpipe analytics across an entire portfolio — 10 buildings, 50 buildings — from a single on-premise appliance. No cloud dependency, no per-building data egress, no separate logins.
The three problems that make standpipe analytics non-negotiable
Every high-rise building operator knows these pains. They just haven't had a turnkey, on-premise solution that actually works — until now.
Manual pressure checks consume 30–50 hours per week
A single 40-story tower typically requires 2–3 facility staff to walk every standpipe zone daily. At $35/hour fully loaded, that's $55,000–$90,000 per year in labor — for a task that catches problems only after they've already started.
Dry-system events trigger fines, insurance hikes, and tenant lawsuits
When a standpipe zone drops below 100 psi during a fire pump test, the building fails NFPA 25 inspection. Typical consequence: a $5,000–$25,000 fine, a 15–30% premium increase on fire-safety insurance, and potential tenant liability if the system fails during an actual fire.
Cloud-based solutions introduce latency, data egress risk, and IT pushback
Most standpipe monitoring platforms send pressure data to a third-party cloud. For high-rise buildings, that means a 5–15 second polling delay, potential data sovereignty issues, and a hard no from IT security teams who don't want plant-network data leaving the building.
Three dry-system events prevented in one pilot. 1,400 hours of labor returned. No cloud, no data egress, no IT pushback. Book a 30-min walkthrough and we'll show you the live dashboard.
From sensor to dashboard in four steps — no cloud, no data leaving your network
iFactory deploys as an NVIDIA appliance on your plant network. You hand over data-source access; we deliver a working standpipe analytics pilot in 6–12 weeks.
Connect your sensors
We integrate with existing pressure transducers, flow switches, and valve position sensors — or we specify and install new ones for zones that lack instrumentation.
Deploy the on-premise appliance
An NVIDIA-powered iFactory appliance sits on your plant network. Zero cloud dependency. Zero data egress. Your IT team approves it in one meeting.
Configure zone models & alerts
iFactory learns normal pressure, flow, and valve behavior per zone. We set custom thresholds for drift detection, dry-system warnings, and tamper alerts — tailored to your building's height, pump configuration, and local fire code.
Go live in 6–12 weeks
You get a live standpipe analytics dashboard, automated reports, and push alerts. Your team stops doing manual pressure rounds. Your fire marshal gets a perfect audit trail.
Four promises — delivered in one quarter
iFactory is not a software license you need to configure, maintain, and troubleshoot. It's a managed service: end-to-end, turnkey, and operational in 6–12 weeks.
End-to-end deployment — we do the heavy lifting
iFactory handles sensor integration, appliance installation, model configuration, and dashboard setup. Your facility team doesn't write a single line of code or configure a single alert rule.
Turnkey pilot — 6–12 weeks from handoff to live dashboard
You give us data-source access. We deliver a working standpipe analytics pilot in one quarter. No prolonged implementation cycles, no multi-year roadmaps.
On-premise only — zero cloud dependency
iFactory runs on an NVIDIA appliance inside your plant network. No data leaves your building. No cloud subscription. No third-party data processing.
Pilot-to-ROI in one quarter — we guarantee it
If the pilot doesn't eliminate at least 80% of manual pressure checks and catch at least one dry-system event within 12 weeks, we'll extend the pilot at no cost until it does.
Questions building operators actually ask about standpipe analytics
Stop walking standpipe zones. Start preventing dry-system events.
iFactory delivers a live standpipe analytics dashboard in 6–12 weeks — on-premise, no cloud, no data egress. Book a 30-minute walkthrough and we'll show you the live dashboard from a Class A high-rise pilot.