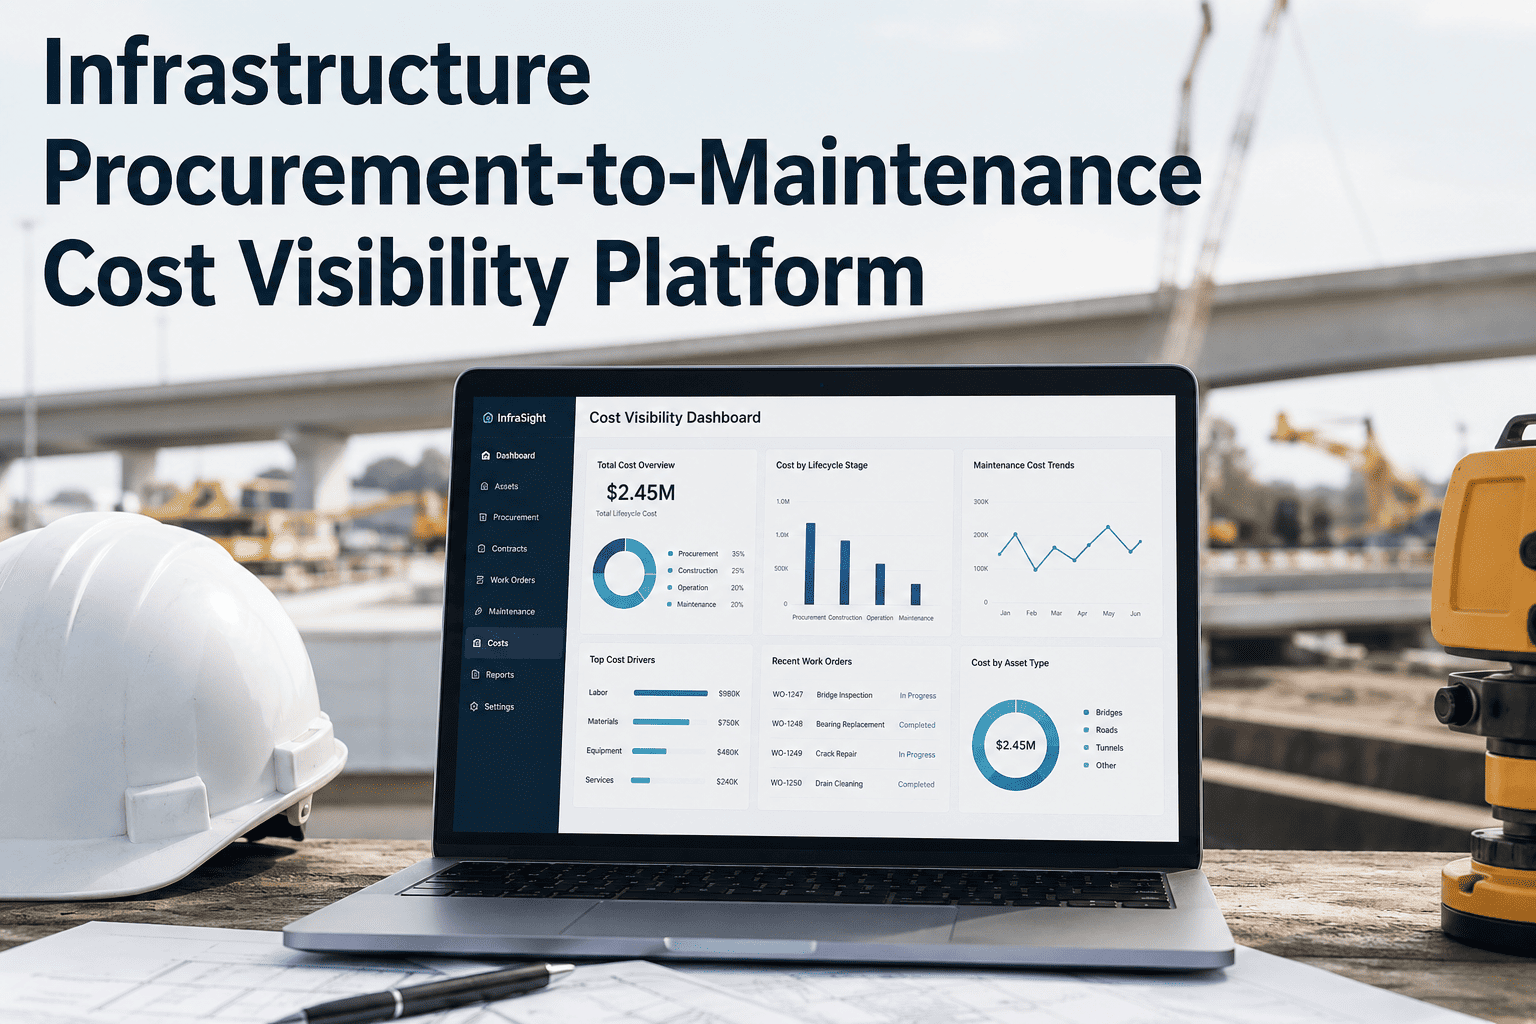
An infrastructure agency can usually tell you what it paid a supplier last quarter, and it can usually tell you what a maintenance crew billed for a repair last month. What almost no agency can tell you, without days of manual reconciliation, is the true lifetime cost of a single pump station, bridge joint, or lift station — from the purchase order that bought it, through every contractor invoice and work order it has generated since. Procurement systems, materials databases, contractor billing, maintenance logs, and the asset register all exist, but they exist separately, and closing that gap starts with connecting them into one view.
Lifecycle Cost Visibility · Procurement to Maintenance
Infrastructure Procurement-to-Maintenance Cost Visibility Platform
iFactory links procurement records, materials spend, contractor invoices, maintenance work orders, and asset records into a single per-asset cost trail, so every infrastructure decision is made against real lifecycle numbers instead of scattered line items. Whether you manage bridges, pump stations, roads, or building systems, the same disconnected-systems problem shows up, and the same connected model resolves it.
1
Cost record per asset, not five
Full Trail
Procurement through maintenance history
Audit-Ready
Spend traceable to source documents
Where The Trail Breaks
Five Systems, Five Owners, One Asset That Nobody Sees Whole
Each of the five systems below is doing its own job correctly. The problem only shows up when someone tries to see all five at once, for one asset, and realizes there's no single place that view already exists.
1
Procurement
Purchase orders and vendor contracts for equipment and components live in an ERP or procurement module, tagged by PO number, not by the asset the item eventually becomes part of. By the time the equipment is installed months later, the link between the order and the asset it equipped often exists only in someone's memory.
2
Materials & Inventory
Spare parts, pipe sections, and consumables are drawn from stores against a job number, but the link back to which specific asset consumed them is often written on a paper ticket that never makes it into a searchable system, leaving materials cost effectively invisible per asset.
3
Contractor Invoices
Third-party repair and installation invoices arrive as PDFs or line items in an accounts payable system, described in the contractor's own terms rather than the agency's asset codes, which means finance staff must interpret and re-tag every invoice manually before it can be tied to a specific asset.
4
Maintenance Work Orders
A CMMS logs labor hours and parts against a work order, and while it usually references an asset ID, it rarely carries forward the original procurement or contractor cost behind that work, so the work order shows this repair's cost but nothing about everything spent before it.
5
Asset Register
The register holds the asset's identity, install date, and specification, but rarely holds a running total of everything spent on it since the day it was commissioned, leaving the one record that should anchor lifecycle cost as the one most often missing it.
What The Disconnect Costs
Four Ways Fragmented Cost Data Quietly Drains Budgets
None of these four problems come from any one system doing its job poorly. They come from the space between systems, where cost information has nowhere consistent to land.
Replacement Decisions Made Blind
Without a full lifecycle cost figure, a repeatedly repaired asset can look cheaper to keep than it actually is, because the comparison only accounts for the last invoice, not the accumulated history of every repair, part, and contractor call-out that came before it.
Duplicate Spend Goes Undetected
When procurement, stores, and contractor billing don't share a common asset reference, the same component can be reordered or re-invoiced without anyone noticing the overlap, and small repeated overpayments accumulate quietly across dozens of assets before anyone catches the pattern.
Budget Forecasts Rely on Guesswork
Next year's capital and maintenance budget is often built on remembered averages rather than an actual per-asset-class cost curve, because pulling that curve manually takes too long to repeat often, so the same rough estimate gets carried forward year after year.
Audits Take Weeks Instead of Hours
Regulatory or grant-funded infrastructure spend reviews require tracing dollars from purchase order to completed work, and reconstructing that trail from five separate systems is slow and error-prone, often pulling staff away from their normal duties for days at a time.
Who Actually Uses This
Finance, Asset Managers, and Operations Are Asking the Same Question From Different Angles
The question — what does this asset actually cost us — comes up in a board meeting, a maintenance planning session, and a procurement review, usually with nobody realizing the other two teams asked it too.
Finance and Budgeting Teams
Finance teams need defensible numbers behind every capital request, and a per-asset lifecycle register turns a budget justification from an estimate into a documented cost history that a board or funding agency can review directly, line by line, without follow-up questions delaying approval, and without finance staff scrambling to assemble a one-off report the week before a meeting.
Asset and Reliability Managers
Asset managers responsible for replacement planning need to compare the running cost of keeping an aging component against the capital cost of replacing it, and that comparison only holds up when every maintenance dollar spent on the asset is actually counted, not just the most recent repair, which is exactly the number a fragmented set of systems struggles to produce quickly.
Procurement and Contracts Staff
Procurement teams gain visibility into which vendors and components are associated with the lowest total cost of ownership over time, informing future specifications and contract terms instead of repeating the same purchasing decisions based on unit price alone, which often turns out to be the more expensive choice once maintenance history is factored in.
Operations and Maintenance Leadership
Maintenance leaders can see which assets are consuming a disproportionate share of the crew's time and materials budget relative to their size or criticality, and use that pattern to prioritize where root cause investigation or condition monitoring would pay off fastest, rather than spreading attention evenly across the whole asset fleet.
Getting There
How a Cost Visibility Rollout Typically Proceeds
1
Inventory Source Systems and Owners
2
Reconcile Asset Identifiers Across Systems
3
Connect Procurement and Materials Data
4
Bring In Contractor and Maintenance Records
5
Validate Totals Against Known Spend
See Your Own Cost Trail
Trace One Asset's Full Spend History Live, In One Session
Bring a single asset — a pump, a bridge deck, a lift station — and we'll walk through what a connected procurement-to-maintenance cost trail actually looks like against your own records, using the exact procurement and maintenance data you already have on file.
The Connected Model
One Asset Cost Register, Fed From Every Source System
Instead of asking every team to change how they work, the platform reads from the systems already in daily use and reconciles what each one contributes into a single record per asset.
Procurement Records
Purchase orders and contract values are matched to the asset they equipped, capturing acquisition cost at the source instead of reconstructing it later from memory or archives, so the starting point of the lifecycle register is accurate from day one.
Materials Consumption
Parts and consumables drawn from inventory are tied to the job and asset that consumed them, so material cost per asset accumulates automatically rather than through manual ticket entry, and stores staff don't have to change how they issue parts day to day.
Contractor Billing
Third-party invoices are mapped to the asset and work order they relate to, closing the gap between what a contractor billed and what an agency's own systems recorded as spend, even when the invoice format and terminology differ from one vendor to the next.
Maintenance History
Work order labor, parts, and downtime roll into the same per-asset ledger as procurement and contractor costs, instead of sitting in a CMMS with no view of what came before it, giving maintenance leadership the full context behind every new work order they open.
Asset Records
The asset register becomes the anchor point every other cost stream attaches to, giving each asset a running lifecycle total that updates as new spend arrives from any connected source, without anyone having to re-key or reconcile the figure by hand.
Reporting Layer
Dashboards and exports pull directly from the unified register, so a budget review or audit request is answered from one query instead of five separate data pulls stitched together by hand, and the same report can be regenerated on demand as new spend comes in.
What Gets Tracked
The Cost Categories a Complete Lifecycle Register Needs to Capture
Acquisition Cost
The original purchase price recorded on the procurement order, including freight, taxes, and any vendor commissioning charges billed alongside the equipment itself, all captured at the moment the order is placed rather than reconstructed years later.
Installation and Commissioning
Labor and contractor charges tied to getting the asset into service, which are frequently invoiced separately from the equipment purchase and easy to lose track of afterward once the project team moves on to the next job.
Materials and Spare Parts
Every part drawn from inventory against the asset over its service life, valued at the price paid rather than an average unit cost that can understate true consumption across a long-lived asset.
Contractor and In-House Labor
Hours billed by third-party contractors together with internal crew time logged against work orders, combined into a single labor figure per asset rather than tracked in two separate ledgers that rarely get compared side by side.
Downtime and Lost Service
Where downtime has a quantifiable operational or service-level cost, that figure is attached to the same asset record so the full impact of a failure is visible, not only the repair invoice that followed it.
Disposal and Decommissioning
Removal, disposal, and any remediation costs incurred when an asset finally reaches end of life, closing out the lifecycle register with a complete, final total instead of leaving the last chapter of the asset's cost story unrecorded.
Before and After
Spreadsheet Reconciliation vs. a Connected Cost Register
The comparison below reflects what changes for the people who actually have to answer a cost question, not just what changes on a technical diagram.
| What You Need | Spreadsheet Reconciliation | Connected Platform |
|---|---|---|
| Per-asset lifetime cost | Rebuilt manually from five systems each time it's requested | Maintained continuously as spend is recorded |
| Contractor invoice matching | Cross-checked line by line against work orders | Matched automatically to the asset and job referenced |
| Budget forecasting | Based on remembered averages and last year's totals | Based on actual cost curves by asset class and age |
| Audit response time | Days to weeks to trace a single spend chain | Minutes, pulling directly from the unified register |
| Duplicate spend detection | Relies on someone noticing by chance | Flagged automatically against the shared asset reference |
A Composite Scenario
A Water Agency's Pump Station Fleet, Before and After
Before
A regional water agency tracked forty pump stations across a procurement system, a separate materials store, contractor invoices in accounts payable, and a CMMS for work orders. When a board member asked which stations cost the most to keep running, the finance team spent nearly three weeks manually matching purchase orders, invoices, and work orders station by station, pulling staff off other budget work to finish the exercise in time for the meeting.
After
With every source system feeding a shared per-asset register, the same question was answered from a live report the same afternoon. Three stations stood out as consistently expensive to maintain relative to their replacement cost, and that finding — not a hunch — became the basis for the agency's next capital replacement request, backed by a documented cost trail the board could review line by line.
Before You Start
Getting Ready to Connect Procurement and Maintenance Data
List the systems currently holding procurement, materials, contractor, and maintenance data, and who owns each one, including any spreadsheets that have become unofficial systems of record
Confirm whether asset IDs are consistent across systems, or whether a mapping exercise is needed first to give every asset one identifier every source system can reference
Pick one asset class as a pilot, ideally one that already draws frequent cost questions from leadership or board members
Identify the reports finance and operations currently rebuild by hand each quarter, as the first ones worth automating
Common Questions
Procurement-to-Maintenance Cost Visibility — FAQ
Do we need to replace our existing procurement or CMMS systems?
No. The platform is built to sit alongside your existing procurement system, materials store, contractor billing process, and CMMS rather than replace any of them. It pulls the relevant cost fields from each and links them through a shared asset reference, so the source systems keep doing what they already do well and staff keep working in the tools they already know. Our team can review your current systems to map exactly what needs to connect.
How is spend actually linked back to the correct asset?
Each cost record — a purchase order, a materials draw, a contractor invoice, a work order — is matched against an asset reference, either one that already exists in your systems or one established during onboarding. Where records don't already carry a clean asset ID, a mapping pass resolves the gap before ongoing data starts flowing automatically, so historical spend and new spend end up on the same asset timeline.
Can this handle contractor invoices that arrive as PDFs?
Yes. Contractor billing frequently arrives outside a structured system, and the platform is designed to capture those line items and tie them to the asset and job they relate to, rather than leaving them as unlinked accounts payable entries sitting apart from the maintenance record. This closes one of the most common gaps in a full lifecycle cost picture, and it's usually the gap agencies notice first once it's fixed.
What does a rollout typically start with?
Most agencies start with a single asset class — pump stations, bridge structures, or a lift station fleet — connect the relevant systems for that class, and validate the resulting lifecycle costs against known spend before expanding further to the rest of the asset portfolio. Book a demo to scope a pilot against your own asset inventory.
Does this help with grant or regulatory spend audits?
Yes. Because every cost record stays traceable back to its source document, a request to demonstrate how funds were spent on a specific asset or program can be answered directly from the register instead of being reconstructed from paper files or archived spreadsheets under a tight audit deadline. That traceability tends to matter most exactly when there's least time to build it from scratch.
Stop Rebuilding Cost Trails By Hand
See What Your Infrastructure Assets Actually Cost, End to End
iFactory connects procurement, materials, contractor billing, maintenance work, and asset records into one lifecycle cost register, so every infrastructure spend decision is backed by real numbers instead of a rebuilt spreadsheet.