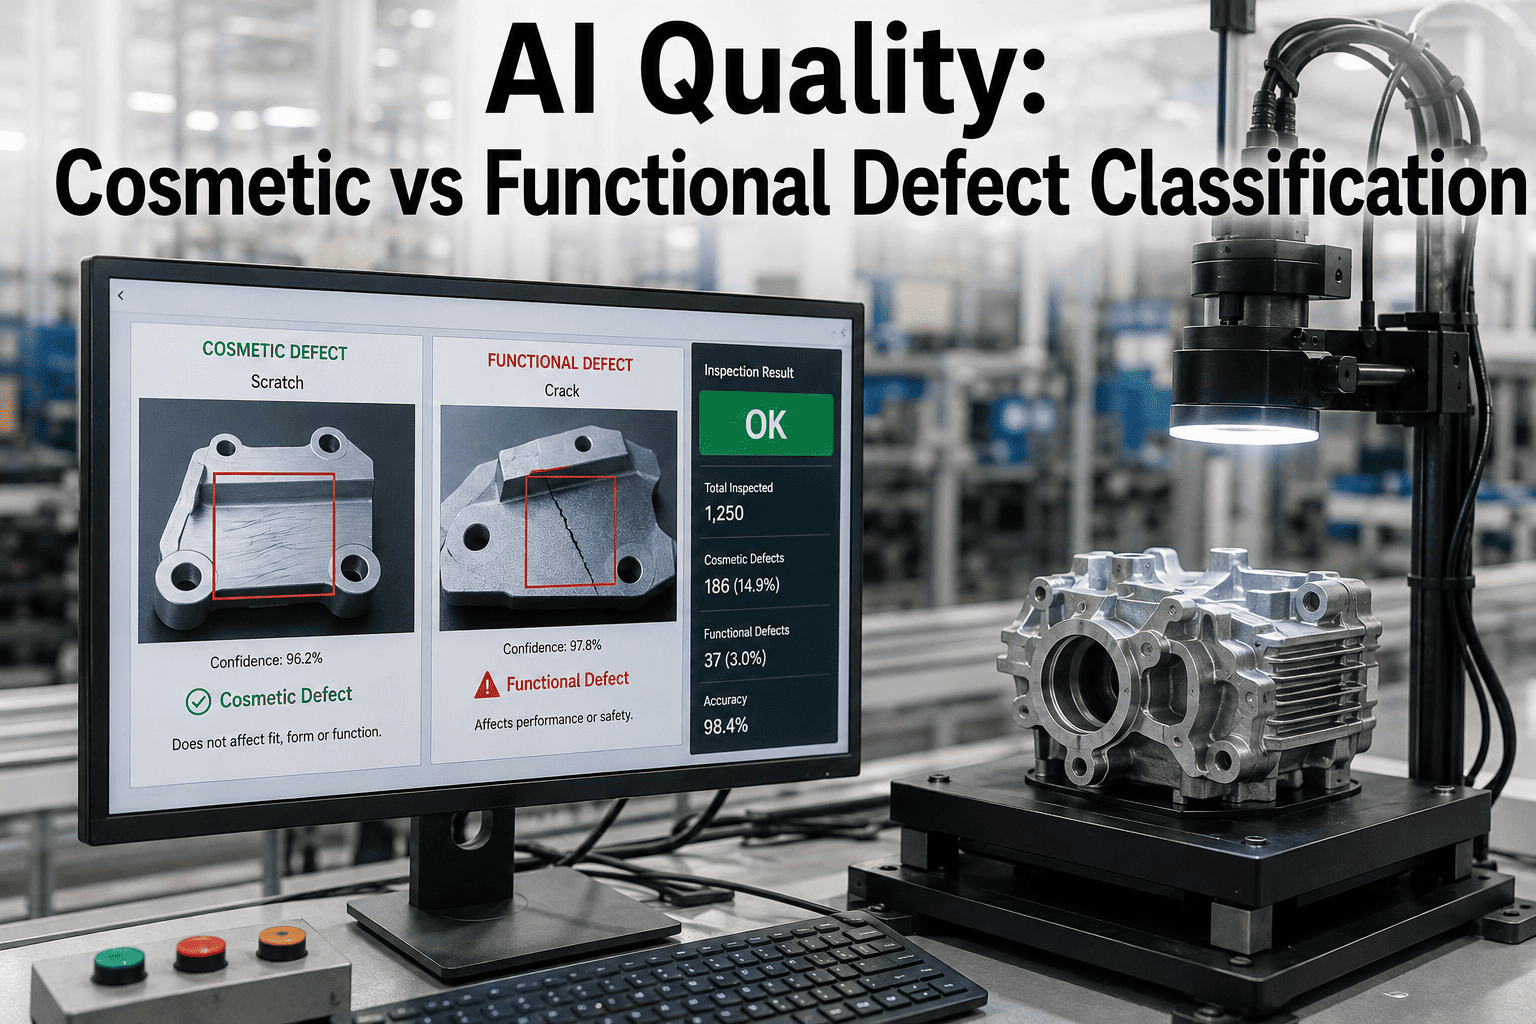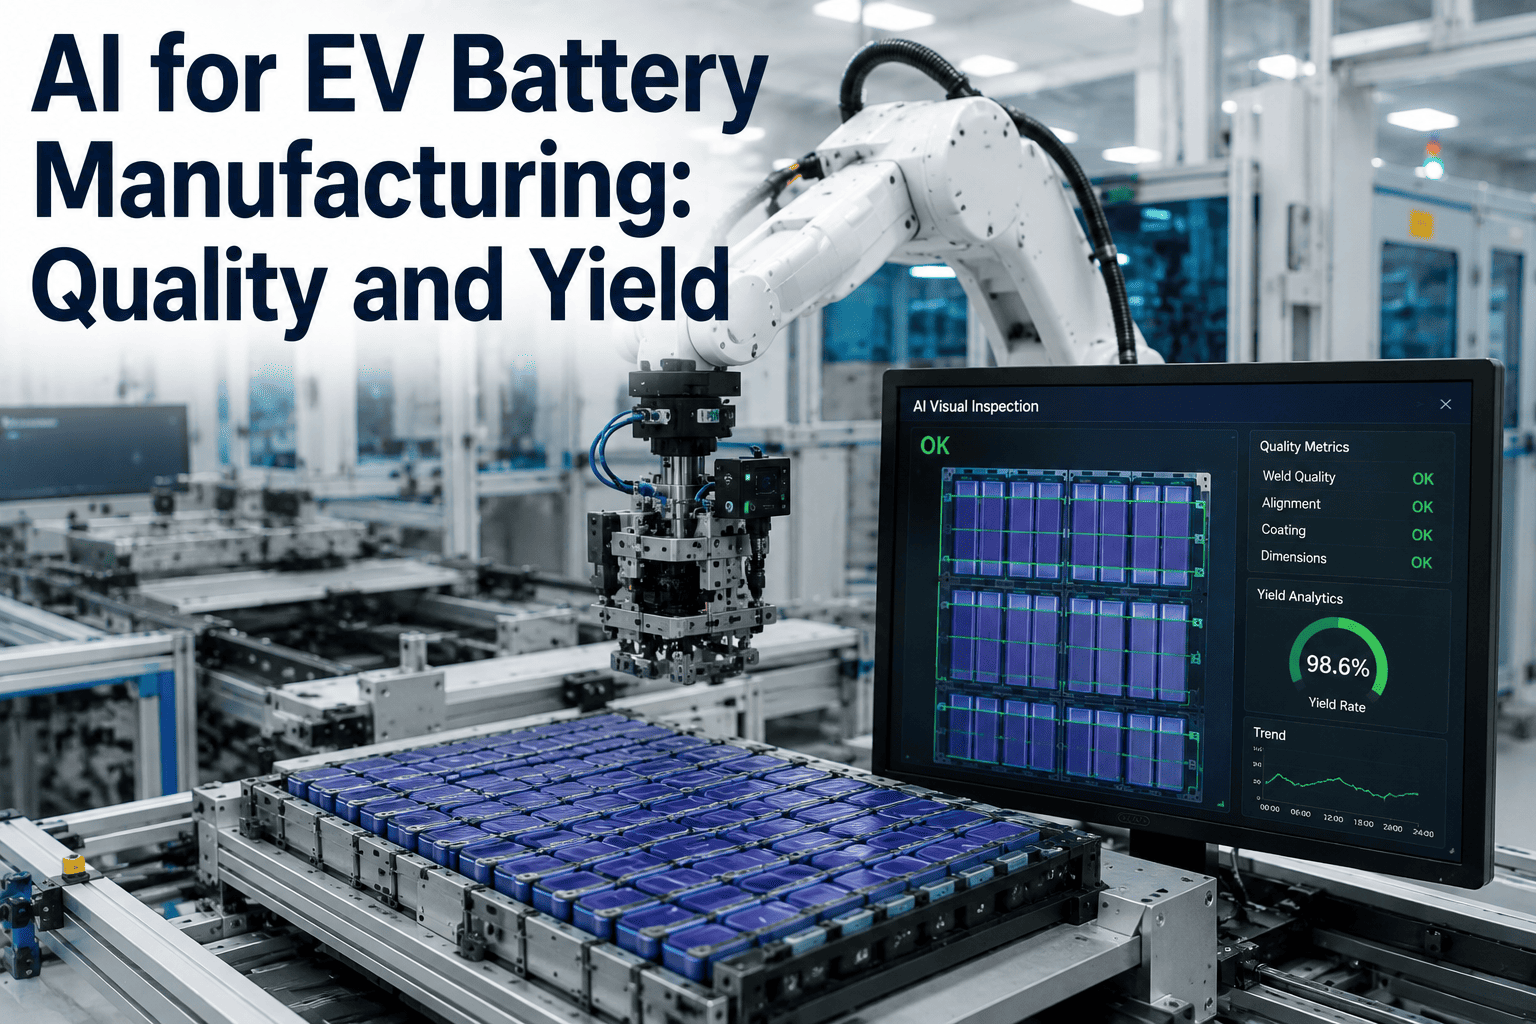
Most plants track defects using a code sheet built years ago, and it usually has fifteen to twenty-five separate codes on it. A manufacturing engineer staring at that list every Monday can tell you the codes are all technically different, but they cannot always tell you which three or four actually drive most of the scrap cost. AI clustering solves that by grouping defect codes based on how they actually behave together in the data, not by what a technician decided to label them five years ago. The result is usually a handful of real defect families instead of a wall of codes nobody prioritizes the same way twice, and it changes how a defect review meeting actually runs.
Turn Twenty Defect Codes Into Three Real Problems
iFactory's clustering model groups your existing defect codes by shared root cause signature, so your team fixes the process issue instead of chasing individual code counts.
Why a Long Defect Code List Hides the Real Story
Manual defect taxonomies grow one code at a time, usually added by whoever was on the floor the day a new-looking defect showed up. Over a few years that produces a list where three or four codes are really the same underlying process issue wearing different names, splitting the count and hiding the true Pareto priority.
How Clustering Actually Groups Your Codes
The model does not start from your code labels. It starts from the process parameters, timing, and location data tied to each defect event, and groups events that share a statistical signature, whether or not a technician originally logged them under the same code.
Anatomy of a Real Defect Cluster
Here is what one cluster typically looks like once the model groups a set of previously separate codes. Individually each code sits low on the Pareto list; grouped together, the family often jumps to the top.
See Your Own Defect Codes Clustered
Bring a recent defect log to the call and our team will show which of your existing codes are likely hiding the same root cause.
Manual Taxonomy vs AI-Driven Clustering
The difference is not just speed, it is whether the grouping reflects what a technician assumed at the time, or what the process data actually shows.
What Changes on the Floor Once Codes Are Clustered
Once a manufacturing engineer can see the real defect families instead of the raw code list, the weekly defect review meeting changes shape entirely.
Getting From Code List to Defect Families
Most engineering teams can validate their first clustered defect families against a full quarter of historical data before touching anything on the live line.
Frequently Asked Questions
Do we need to redesign our defect code system first?
No, the clustering model works with your existing defect codes as they are today. It does not require you to rename or restructure your taxonomy before starting, since the grouping happens underneath the codes based on process data rather than replacing the codes themselves. Once clusters are validated, most teams choose to relabel or consolidate codes gradually, but that is a decision your engineering team makes after seeing the results, not a prerequisite. The support team can walk through how your current code sheet maps into the model.
How much historical data do we need to get useful clusters?
A full quarter of defect logs with associated process parameters is usually enough to produce a first meaningful clustering pass, though more history generally sharpens the boundaries between families. Plants with seasonal or lot-driven variation benefit from a longer window so the model sees enough variation to separate a true defect family from a one-off event. If your historical logging is thinner in places, the team can assess what is workable on a short call.
Will clustering ever combine two genuinely different defects into one family?
It can happen at first pass, which is exactly why engineering review is built into the process rather than skipped. The model proposes statistically similar groupings, but your team confirms whether the physical explanation makes sense before any cluster becomes an official defect family. Over time, as more defect events log in, the model refines its own boundaries, and engineers can manually split a cluster if new evidence shows it was actually two distinct causes.
Does this replace our existing Pareto chart process?
It sharpens it rather than replacing it. Your Pareto chart still ranks defect impact the same way it always has, but the categories feeding it become the clustered defect families instead of raw individual codes, which usually reshuffles the ranking meaningfully. Teams typically find that a code sitting in eighth or ninth place on the old chart jumps to the top three once it is properly grouped with the codes that share its root cause.
Can this connect to our existing vision inspection system?
Yes, if your plant already runs vision-based inspection, that defect event data feeds directly into the same clustering pipeline alongside manually logged defects. This is particularly useful because vision systems tend to log location and timing data more consistently than manual entry, which improves the quality of the clusters the model produces. The demo call can include a look at how your current inspection data would map in.
Stop Chasing Twenty Codes and Start Fixing Three Problems
iFactory's clustering model reveals the real defect families hiding in your existing code sheet, built for manufacturing engineers who need the true Pareto priority, not a longer list.