Manufacturing quality control in 2026 is no longer a sampling exercise — it is a 100% inspection problem. AI vision systems have moved from pilot-phase curiosity to production-floor necessity, replacing manual visual inspection that misses 20–30% of defects at line speed with deep learning models that detect surface flaws, dimensional non-conformances, and assembly errors at accuracy rates exceeding 99%. This guide gives U.S. manufacturing operations leaders the full implementation picture: how AI vision systems work at the component level, where they deliver the strongest ROI across your production environment, what a phased deployment actually looks like and how to evaluate vendor options without getting lost in a feature checklist. If you are evaluating AI vision for one line or plant-wide rollout, book a platform capability session to see how detection models trained on your specific defect library compare against your current quality escape rate.
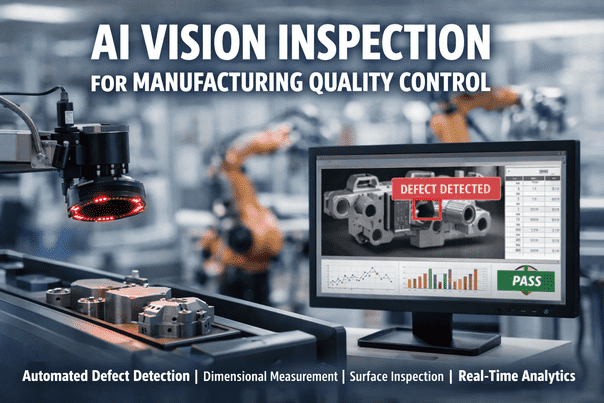
AI Vision Systems for Manufacturing Quality: Complete Implementation Guide
How deep learning vision platforms replace manual inspection with 99%+ defect detection accuracy — defect types covered, ROI framework, deployment phasing, and vendor evaluation criteria for U.S. production environments.
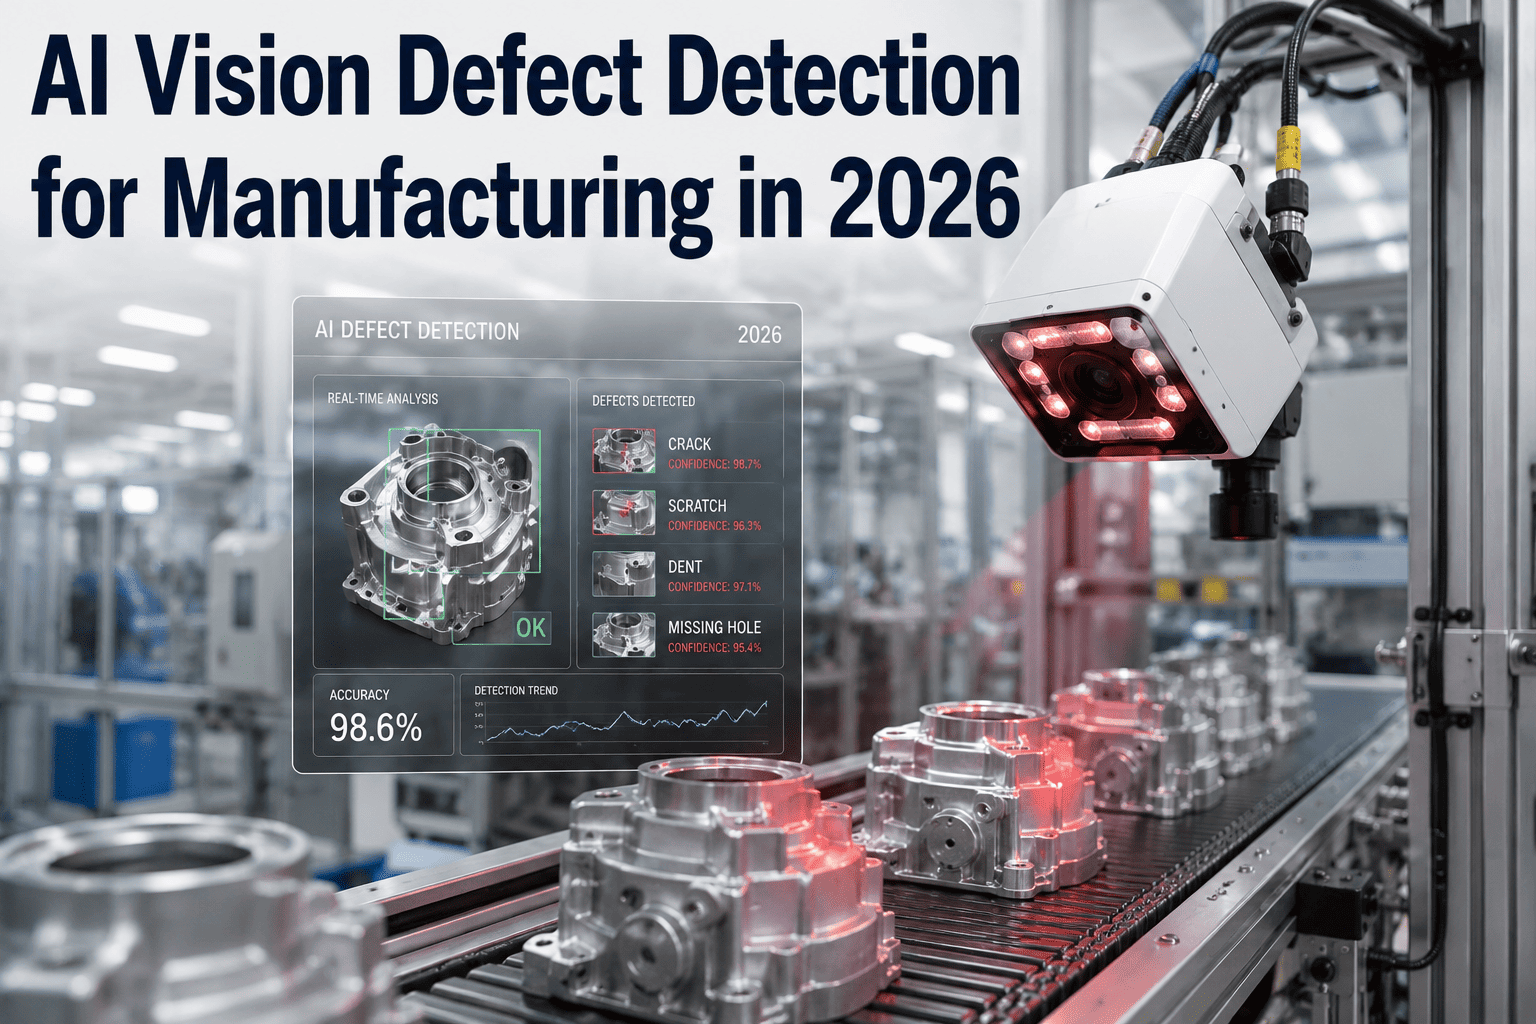
How AI Vision Systems Work: The Technology Stack Behind 99% Detection Accuracy
AI vision systems for manufacturing quality are not conventional rule-based machine vision — they are deep learning inference engines trained on production-specific defect libraries. The distinction matters for implementation: rule-based vision systems require engineers to program every defect signature manually and break when product variants change. Deep learning models learn defect patterns from labeled training images and generalize across product variants, lighting changes, and material batch variation without reprogramming.
The technology stack that produces 99%+ detection accuracy in production environments operates across four integrated layers. Understanding each layer is what separates successful deployments from the AI vision pilots that never scale beyond a single line.
Image Acquisition Hardware
High-resolution industrial cameras (4–25MP), structured light projectors, telecentric lenses, and synchronized strobe lighting capture every unit at line speed without motion blur. Camera placement, field of view, and illumination angle are engineered per product geometry — not generic.
Edge Inference Engine
Deep learning models run on-premise on NVIDIA GPU inference hardware, completing the detection loop in under 50ms — fast enough for high-speed filling, packaging, and assembly lines where cloud round-trips (500–2000ms) arrive after the defective unit has already cleared the reject station.
Defect Classification Models
Convolutional neural networks (CNNs) and transformer-based vision models trained on plant-specific defect image libraries classify defect type, severity, and location with confidence scores. Models retrain continuously as new defect patterns emerge from production data.
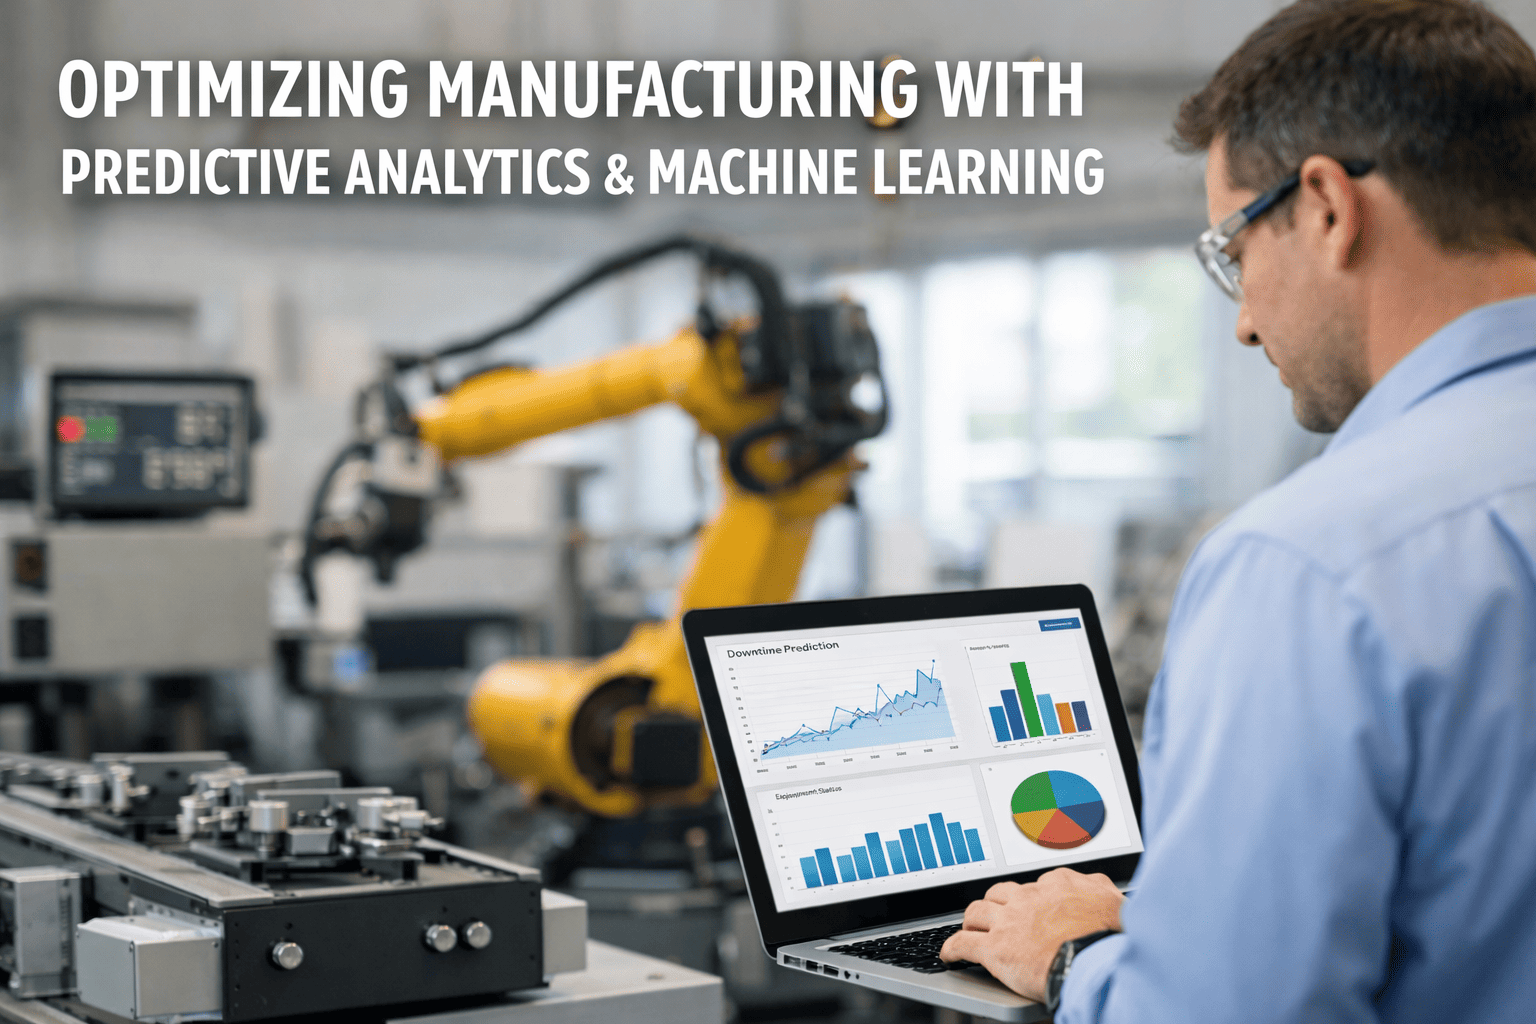
Process Parameter Correlation
Detected defects are correlated back to upstream process parameters — machine settings, material batch IDs, environmental conditions, operator shift — identifying root cause rather than producing inspection-based containment. This is the layer that converts AI vision from a detection tool into a quality improvement engine.
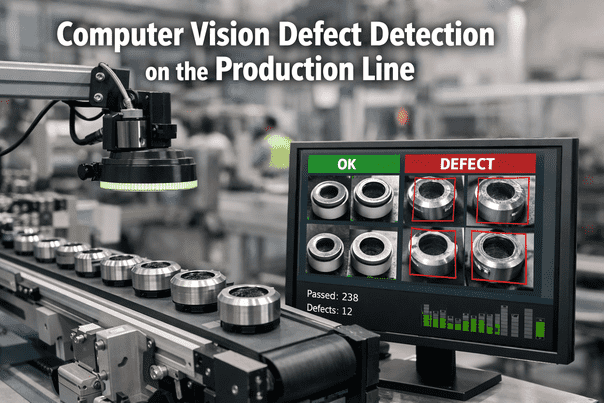
Defect Types AI Vision Systems Detect — and Where Human Inspection Fails
The performance gap between AI vision and human visual inspection is not marginal — it is structural. Human inspectors at production rates miss 20–30% of defects due to fatigue, attention drift, lighting inconsistency, and the physical limits of human visual acuity at line speed. AI vision systems operating at the same line speed with calibrated illumination miss less than 1% of defects within trained categories. The table below maps defect types to detection performance across both paradigms.
| Defect Category | Specific Examples | Human Inspection | AI Vision Detection | Key Benefit |
|---|---|---|---|---|
| Surface Defects | Scratches, pits, burrs, oxidation, contamination | 70–80% detection rate | 99.1% detection rate | Sub-micron scratch detection at line speed |
| Dimensional Non-conformance | Out-of-tolerance length, diameter, hole position | Sampling only | 100% coverage ±5µm | Full dimensional verification, zero sampling risk |
| Assembly Errors | Missing fasteners, wrong component, misalignment | Inconsistent — shift-dependent | 99.4% detection rate | Eliminates assembly escape to downstream or field |
| Label / Print Quality | Barcode readability, text legibility, color match | Spot-check only | 100% OCR + color delta | Regulatory compliance — pharma, food, CPG |
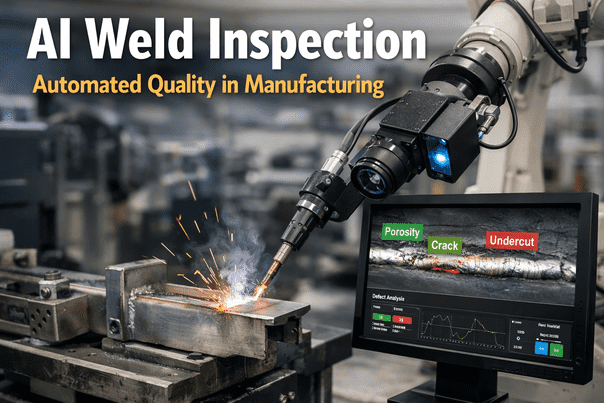
| Weld / Joint Integrity | Porosity, undercut, incomplete fusion, spatter | Manual visual — high miss rate | 98.8% with 3D structured light | Real-time rejection, no downstream rework |
| Color / Cosmetic | Shade variation, gloss inconsistency, finish defects | Subjective — inspector-dependent | Objective delta-E measurement | Eliminates subjectivity from cosmetic standards |
The miss-rate gap compounds through the supply chain. A 25% human inspection miss rate on a line producing 10,000 units per shift means 2,500 potentially defective units entering downstream assembly, customer delivery, or patient use — depending on your industry. Book a detection accuracy assessment to see how your current escape rate maps to an AI vision ROI calculation for your specific product types and defect categories.
ROI Framework: How to Build the Business Case for AI Vision Investment
The business case for AI vision does not rest on a single benefit. It accumulates across five value streams that, when calculated against your plant's specific cost structure, consistently clear capital authorization hurdles within the first 12 months of deployment. Most AI vision ROI analyses undercount because they model scrap reduction alone and miss the downstream value from warranty recovery, yield improvement, and avoided customer audit costs.
Scrap and Rework Elimination
Formula: (Annual scrap + rework cost) × 0.28 to 0.35
AI vision detects defects at the point of creation — before value-added operations are applied to a non-conforming unit. A plant carrying $650K in annual scrap and rework cost recovers $182K–$228K annually from earlier detection alone, before counting downstream rework that never gets initiated.
Inspection Labor Redeployment
Formula: (FTEs on manual inspection × fully-loaded rate) × 0.65
AI vision handles 100% inspection continuously. Manual inspectors shift to exception review and process improvement — typically 1–3% of units flagged for human confirmation. A 6-person inspection team running 3 shifts recovers significant labor hours without headcount reduction, redirecting capability to higher-value quality engineering work.
Warranty and Field Escape Cost
Formula: (Annual warranty cost) × 0.20 to 0.35
Field escapes — defective units that pass inspection and reach the customer — carry warranty, recall, and reputation costs that are 8–40x the cost of in-plant detection. AI vision's 99%+ detection rate reduces field escape volume by 80–90% on defect categories within trained scope, producing warranty recovery that often exceeds scrap savings alone.
Throughput and OEE Gain
Formula: (Defect-driven line stops per month × hourly output value) × 0.70
Defect-driven line stops — for manual re-inspection, sorting, and quarantine — disappear when AI vision rejects in real time at line speed. Plants report 8–15% OEE improvement from elimination of defect-driven downtime alone, separate from the quality containment benefit.
Customer Audit and Compliance Value
Qualitative: contract retention, audit pass rate, PPAP acceleration
OEM and Tier-1 customers increasingly require documented AI inspection capability as a contract qualification criterion — particularly in automotive, aerospace, and medical device supply chains. AI vision data packages accelerate PPAP submissions, satisfy customer audit requirements, and protect contract positions that manual inspection cannot support.
Process Improvement Acceleration
Formula: (Defect root cause cycle time reduction) × process engineering value
When AI vision is integrated with process parameter data, root cause analysis that took 3–5 days of manual data correlation completes in minutes. Faster CAPA closure means fewer repeat defect events — creating a compounding quality improvement cycle that accumulates value beyond the initial detection ROI.
See What AI Vision Returns on Your Specific Lines
iFactory's team will model your scrap rate, escape rate, inspection labor, and warranty exposure against AI vision detection performance — and return a plant-specific ROI projection before any purchase decision. Sessions available this week.
AI Vision Implementation Roadmap: A Phased Deployment That Maintains Production
The single most common AI vision implementation failure is attempting full plant-wide deployment in a single phase. Plants that succeed deploy in structured waves — starting with the highest-ROI line, proving the detection model, refining integration, then scaling. The phased approach generates visible ROI within 90 days, builds internal confidence, and funds subsequent phases from demonstrated savings. If your team is planning a deployment sequence, a scoping session with iFactory's implementation team can map this timeline to your specific line mix, product variety, and defect categories.
Line Selection, Baseline, and Camera Installation
- Identify highest-ROI line based on scrap rate, escape history, and inspection labor cost
- Document current defect library — types, frequency, severity, and representative image samples
- Camera hardware installation, lighting rig setup, and field-of-view calibration
- Edge inference server installation and network integration with line control systems
- Initial model training on plant-specific defect image library (minimum 500 images per defect class)
- Hardware commissioned and inference engine operational on target line
- Baseline defect detection rate established against current human inspection performance
- First model version running in shadow mode (detecting without rejecting) for validation
- Defect image library growing from production data for model refinement
Model Refinement, Live Rejection, and Process Integration
- Shadow-mode validation results reviewed — false positive and miss rate measured
- Model retraining on production images with operator-labeled edge cases
- Live rejection enabled with automated divert to reject lane
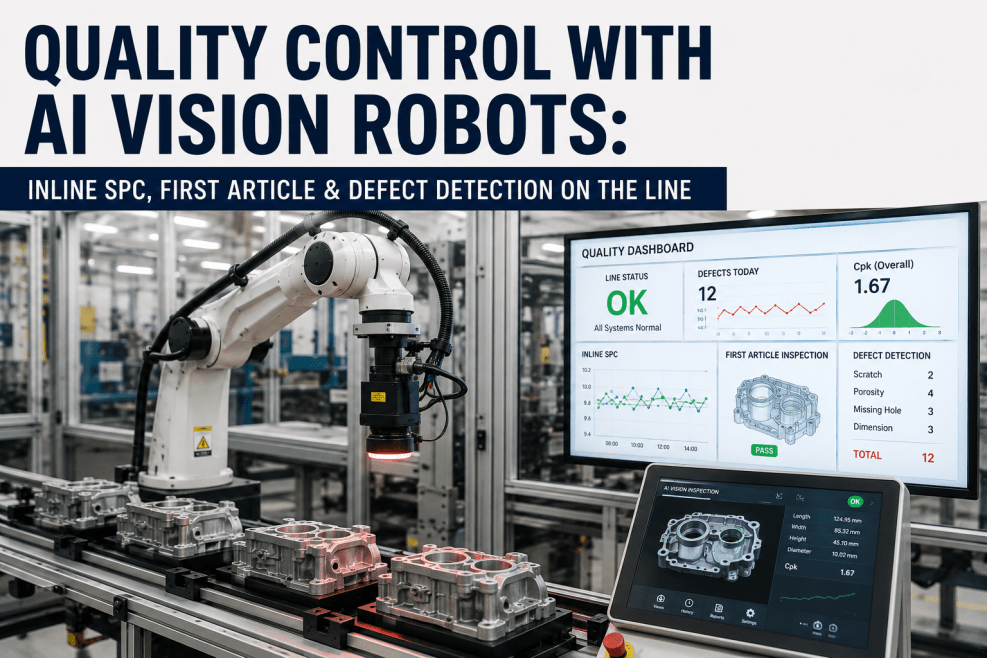
- SPC integration activated — defects correlated to process parameters and machine settings
- Quality dashboard deployment for QA team with real-time defect rate and Pareto
- Detection accuracy above 98% on trained defect categories
- First documented scrap reduction measurable vs. pre-deployment baseline
- Root cause correlation surfacing for top defect types — CAPA acceleration begins
- Inspection labor redeployment to exception review and process improvement roles
Line Expansion, Model Library Growth, and Full Integration
- AI vision deployment expanded to additional production lines — 2–4 week waves per line
- Cross-line defect benchmarking identifies which lines carry highest quality risk
- Predictive quality integration — defect probability scores fed to predictive maintenance engine
- Customer audit documentation package built from AI inspection data
- Model library growing continuously from production data — accuracy improves over time
- Full plant detection accuracy above 99% on all deployed lines
- Scrap rate reduction of 25–35% measurable plant-wide vs. pre-deployment baseline
- Field escape rate reduction of 80–90% on defect categories within AI vision scope
- AI vision data supporting PPAP submissions and customer audit requirements
AI Vision Vendor Evaluation: 7 Criteria That Separate Production-Ready Platforms from Pilots
AI vision vendor selection is where most implementation decisions go wrong. The vendor landscape includes industrial machine vision companies that have added AI marketing language to rule-based systems, pure-software AI platforms without industrial hardware integration, and production-grade AI vision platforms with documented deployment track records. The seven criteria below distinguish platforms that will perform in your production environment from those that will require 18 months of integration work before generating any ROI. For a structured comparison of how iFactory AI benchmarks against these criteria for your specific line environment, schedule a platform evaluation session — sessions include a live detection model demonstration on your defect type portfolio.
On-Premise vs Cloud Inference Architecture
For high-speed production lines, cloud inference latency (500–2000ms round-trip) is incompatible with real-time rejection. Require on-premise edge inference with documented latency below 50ms. Cloud-only vendors cannot meet this requirement regardless of marketing claims.
Training Data Requirements and Model Ramp Time
Ask every vendor: how many labeled defect images are required to reach 95%+ detection accuracy on a new defect class? Production-ready platforms require 300–600 images per class. Vendors requiring 5,000+ images are using architectures that cannot adapt to your defect library within a practical deployment window.
False Positive Rate and Reject Precision
A false positive rate above 0.5% on a high-volume line creates more operator intervention work than it eliminates — defeating the labor productivity benefit. Require documented false positive rates below 0.3% on reference production datasets. Ask for production data, not lab benchmarks.
Process Parameter Integration Depth
Defect detection alone is containment. Defect-to-process-parameter correlation is improvement. Require that the platform natively integrates with your SCADA, PLC, MES, and historian systems to correlate detected defects with upstream process conditions — not via manual data export.
Product Changeover Handling
High-mix production environments require AI vision models to switch products without recalibration delays. Ask how the platform handles SKU changeovers — production-ready systems store per-product model configurations and switch in under 30 seconds. Systems requiring manual recalibration create changeover bottlenecks that erase OEE gains.
Documented Production References — Not Lab Demos
Require vendor references from production environments comparable to yours in line speed, product complexity, and defect category. Lab demonstrations on static samples do not predict production performance. Ask for documented detection accuracy on live production data from references you can contact.
Regulatory Compliance Documentation Support
For automotive (IATF 16949), aerospace (AS9100), medical device (21 CFR Part 820), and pharmaceutical (21 CFR Part 211) environments, AI vision data must be audit-ready. Require that the platform produces structured inspection records, traceability links to batch and serial numbers, and exportable compliance documentation packages.
What Quality Engineering Leaders Say After AI Vision Deployment
The most reliable evidence on AI vision performance comes from quality engineers and operations leaders who have completed full production deployments — not from vendor benchmarks. The perspectives below reflect documented outcomes from U.S. manufacturing operations across discrete, process, and regulated industries.
We resisted AI vision for two years because we were convinced the false positive rate would create more sorting work than it eliminated. Our actual production false positive rate after model refinement was 0.22% — well below the 0.5% threshold we had set as acceptable. Our field escape rate for surface defects dropped 89% in the first 8 months. The quality team now spends 70% of their time on process improvement rather than inspection coordination. That shift alone changed the culture of the department.
The ROI calculation we built before deployment focused entirely on scrap reduction. We missed the warranty recovery entirely — which turned out to be larger than the scrap savings in year one. We had a chronic field escape problem on a surface finish defect that our manual inspectors were missing at approximately 22% rate. AI vision brought that miss rate to under 0.4%. The warranty claim volume for that defect category dropped 84% in 12 months. That outcome alone justified the platform investment three times over.
Our customer — a major OEM — required documented AI inspection capability as a condition of a new contract renewal. We had 90 days to demonstrate it. The deployment went live in 11 weeks. We used the AI vision data package from the first production run to satisfy the customer audit requirements. We retained the contract and have since expanded the AI vision system to all six of our production lines. The contract protection value alone justified the investment before we calculated the scrap savings.
Ready to See 99%+ Detection Accuracy on Your Production Lines?
iFactory's AI vision platform integrates deep learning inspection with predictive maintenance, OEE analytics, and process quality correlation in a single unified system — pre-configured, production-validated, and deployable in under 12 weeks.
Conclusion: AI Vision Is Now a Quality Baseline, Not a Competitive Advantage
The performance gap between AI vision and manual inspection is wide enough, and the deployment track record mature enough, that AI vision is no longer a differentiation strategy for U.S. manufacturers — it is a quality baseline requirement. OEM customers in automotive, aerospace, and medical device supply chains require it. Regulatory bodies in pharmaceutical and food manufacturing increasingly expect it. And the economic case, built correctly against your plant's specific scrap rate, escape rate, and inspection labor cost, consistently supports the investment within a 14-month payback window.
The implementation barrier that dominated conversations three years ago — model training data requirements, integration complexity, false positive management — are solvable problems with a structured phased approach and a platform partner with documented production references. The risk is no longer in moving toward AI vision. It is in remaining on sampling-based manual inspection while the quality gap between your operation and AI-enabled competitors widens every quarter.
If your quality team is ready to move from evaluation to deployment planning, the fastest next step is a platform capability session with iFactory's vision engineering team — where we run a live detection demonstration on your defect type portfolio and return a plant-specific ROI projection before any purchase decision is made.
Frequently Asked Questions — AI Vision Systems for Manufacturing Quality
Production-ready AI vision platforms require 300–600 labeled images per defect class to reach 95%+ detection accuracy — achievable from a 2–4 week image collection period on most production lines. More advanced architectures using transfer learning and synthetic data augmentation can reach viable accuracy with fewer images. Platforms requiring 5,000+ images per class are using architectures that will not adapt to your defect library within a practical deployment timeline. Ask every vendor for their training data requirement documentation and their ramp-time-to-accuracy track record from production deployments — not lab benchmarks.
Modern AI vision systems with on-premise edge inference complete the full detection cycle — image capture, preprocessing, model inference, and reject signal — in under 50ms. This supports line speeds up to 1,200+ units per minute for small discrete parts and 600+ units per minute for larger assemblies, depending on field of view and camera count. The constraint is not the AI model — it is the camera shutter speed and lighting synchronization, which must freeze motion at production speed without blur. High-speed strobe synchronization resolves this for virtually all production line speeds encountered in discrete and process manufacturing.
Production-grade AI vision platforms store per-product model configurations and switch automatically on changeover trigger — either from the MES work order system or a manual operator input. Changeover reconfiguration on mature platforms takes under 30 seconds, with no manual camera repositioning required for products within a similar size envelope. High-mix environments with significant product size variation (more than 3:1 in any dimension) typically require a second camera configuration — which production-ready platforms manage through a configuration library linked to each product recipe. The key evaluation question for high-mix operations is not whether the platform supports changeover — it is whether the changeover is automatic or requires manual engineering intervention each time.
AI vision systems are designed to operate in complement with human inspection during the transition period — typically 4–8 weeks on a new line. In shadow mode, the AI detects and logs without activating the reject mechanism; operators continue manual inspection while the AI's detections are validated against their calls. This parallel operation period builds confidence in the model, identifies edge cases for retraining, and allows a clean handover from manual to AI-primary inspection without production disruption. After go-live, human inspectors shift to exception review — confirming the 1–3% of units flagged by the AI as requiring human judgment. Full replacement of manual inspection for trained defect categories typically occurs by week 8–12 of deployment.
Production-grade AI vision platforms generate structured inspection records for every unit inspected — timestamped, linked to batch and serial number, with defect classification, confidence score, disposition (accept/reject), and the inspecting model version. This data is exportable in formats compatible with automotive PPAP packages (IATF 16949), aerospace first article inspection reports (AS9100), medical device device history records (21 CFR Part 820), and pharmaceutical batch records (21 CFR Part 211). Customer audit packages built from AI vision data demonstrate 100% inspection coverage, objective and reproducible defect standards, and complete traceability from unit to production conditions — criteria that manual inspection documentation cannot satisfy at comparable evidence quality.