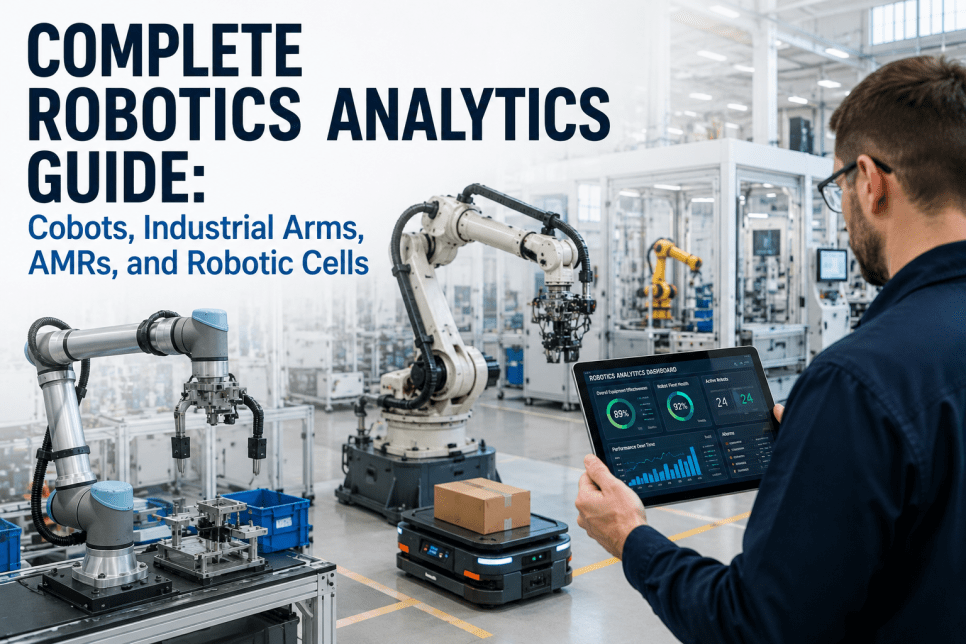
Robotics systems — cobots, industrial arms, AMRs, and robotic cells — are driving a fundamental transformation in U.S. manufacturing. Yet most plants still track robot performance through lagging indicators: cycle time reports, reactive maintenance tickets, and quarterly uptime summaries. By the time problems surface in those reports, the damage — downtime, scrap, safety incidentsand missed throughput — is already done. This guide walks through what a comprehensive robotics analytics framework actually looks like in practice: how leading manufacturers are monitoring cobot health, predicting arm failures weeks out, optimizing AMR fleet routing, and squeezing measurable ROI out of every robotic cell. If you're running automation and still relying on reactive maintenance or manual logs, this is where competitive advantage is being lost right now. Book a Demo to see how iFactory's Robotics Analytics platform deploys across your automation stack in under 5 weeks.
68%
of unplanned robot downtime is predictable with real-time analytics monitoring
$310K
Average annual cost savings per facility from predictive robotics maintenance
3.2x
ROI improvement when analytics covers the full robot fleet vs. spot monitoring
5 wks
Full robotics analytics deployment from audit to live fleet monitoring
Why Reactive Robot Monitoring Is Costing U.S. Plants Millions
The promise of robotics automation — consistent throughput, reduced labor costs, precision at scale — only materializes when robots are healthy and optimized. The hidden reality in most facilities is that monitoring gaps silently erode that value. Here's how the failure modes actually unfold across robot types:
Cobots: Missed Drift and Force Threshold Creep
Collaborative robots operating near human workers gradually drift in joint calibration and force sensing accuracy. Without continuous monitoring, these deviations compound invisibly until a safety stop, rejected product batch, or worker incident forces shutdown — typically costing $18,000–$45,000 per event in downtime and rework.
Industrial Arms: Gearbox and Servo Degradation
Six-axis arms operate under repetitive torque loads that wear gearboxes, servo drives, and wrist joints over thousands of cycles. Vibration signatures and current draw anomalies appear 3–6 weeks before mechanical failure — but only if someone is continuously watching the right parameters.
AMRs: Route Inefficiency and Battery Degradation
Autonomous mobile robots operating in dynamic warehouse or production environments accumulate route inefficiencies, collision near-misses, and battery capacity degradation that manual fleet reviews catch months too late. A 15% route efficiency loss across 20 AMRs can equal $90,000+ in annual throughput reduction.
Robotic Cells: Bottleneck Blindness and OEE Leakage
Integrated robotic cells involve multiple interacting systems — feeders, vision systems, grippers, conveyors — where performance leakage compounds at every handoff. Without cell-level OEE analytics, most plants are operating at 62–71% of theoretical throughput without knowing it.
The Four Pillars of a Complete Robotics Analytics Framework
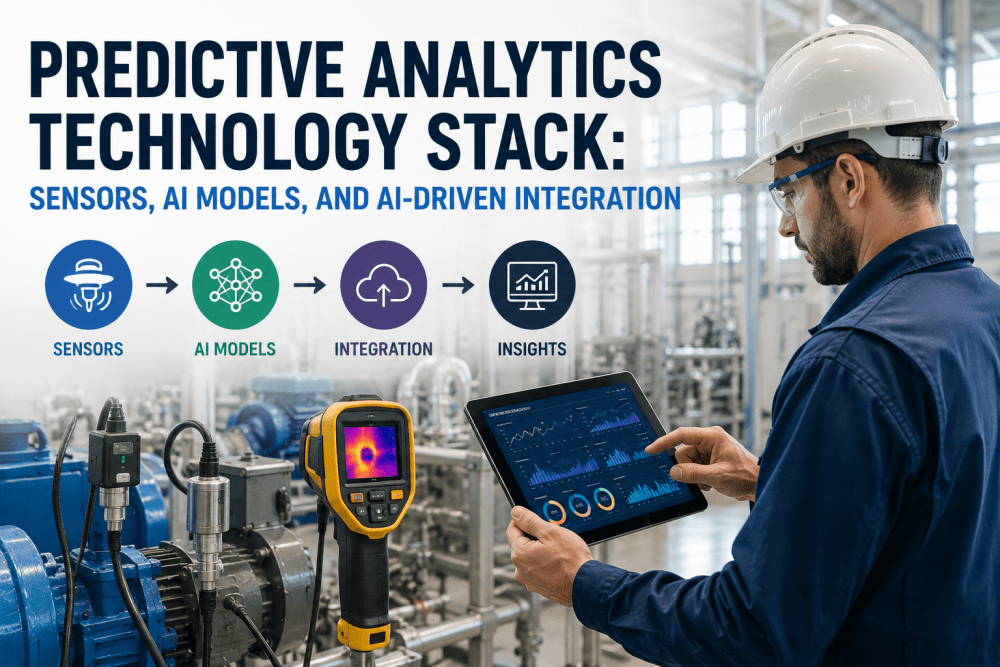
Effective robotics analytics isn't a single dashboard — it's a layered framework that addresses health monitoring, performance optimization, predictive maintenance, and fleet intelligence simultaneously. Each pillar addresses a distinct failure mode and delivers measurable financial returns. See how iFactory's analytics engine covers all four pillars across your specific robot fleet.
01
Real-Time Health Monitoring
Continuous streaming of joint temperatures, motor current signatures, vibration spectra, encoder positions, and force-torque readings. AI baselines are established per robot per task, so deviations trigger alerts — not just threshold breaches. Covers cobots, arms, and AMR drive systems simultaneously.
Machine learning models trained on failure signatures across robot classes identify gearbox wear, bearing fatigue, servo degradation, and gripper wear 2–6 weeks before functional failure. Alerts include failure probability curves, recommended intervention windows, and estimated downtime cost if deferred.
Cycle time analysis, availability tracking, quality rate monitoring, and throughput benchmarking at robot, cell, and fleet levels. Automated OEE reports identify which robots are underperforming against baseline and why — with root cause analysis built into every alert.
Cycle TimeAvailabilityOEE ScoreThroughput
04
Fleet Intelligence & Optimization
Cross-fleet analytics identify systemic patterns invisible at the individual robot level: batch-specific wear acceleration, shift-related performance gaps, route clustering inefficiencies in AMR fleets, and cell synchronization losses. Optimization recommendations are ranked by ROI impact and implementation complexity.
Fleet PatternsAMR RoutesCell SyncROI Ranking
Robot-Type Analytics Breakdown: Cobots, Arms, AMRs, and Robotic Cells
Each robot category has distinct failure signatures, performance metrics, and analytics requirements. A single-dashboard approach that treats all automation the same misses the nuances that drive real ROI. Here's what analytics needs to track — and why — for each category.
Robot Type
Critical Health Signals
Key Performance KPIs
Top Failure Modes
Analytics ROI Driver
Cobots UR, FANUC CRX, ABB YuMi
Joint torque drift, force sensor accuracy, TCP position error, skin sensor calibration
Cycle time consistency, collaboration zone compliance rate, rework rate
Joint calibration drift, force threshold creep, vision system misalignment
Predictive Maintenance Workflow for Industrial Robot Fleets
Understanding what to monitor is only the first step. The operational advantage comes from how analytics translates sensor data into scheduled maintenance interventions before failures occur. Here's the end-to-end predictive maintenance workflow that leading manufacturers are running today.
Step 1
Continuous Data Ingestion
OPC-UA, EtherNet/IP, and robot controller APIs stream joint health, motor telemetry, and operational data at 100ms–1s intervals. No manual data collection. No sampling gaps. Full sensor fidelity preserved.
Step 2
AI Baseline Modeling
Machine learning models establish healthy operating baselines per robot, per task, per shift — accounting for normal variance. Anomaly detection is contextual, not just threshold-based. False positive rate stays below 4%.
Step 3
Degradation Pattern Recognition
Proprietary failure signature libraries — trained on gearbox wear, bearing fatigue, servo degradation, and gripper cycles — identify deterioration curves 2–6 weeks before functional failure. Each alert includes failure probability and confidence interval.
Step 4
Automated Work Order Generation
Predictive alerts auto-generate maintenance work orders in your CMMS (SAP PM, IBM Maximo, Infor EAM) with part lists, technician assignments, and estimated intervention windows — scheduled during planned production gaps to avoid unplanned downtime.
Step 5
Intervention & Outcome Feedback
Post-maintenance health data feeds back into the AI model, improving future prediction accuracy. Each intervention builds the plant's failure history database — progressively sharpening predictive windows and reducing unnecessary preventive work orders.
Still Running Reactive Robot Maintenance? Every Unplanned Downtime Event Costs $18,000–$90,000. Predictive Analytics Stops It Before It Starts.
iFactory's robotics analytics engine deploys across your full robot fleet — cobots, arms, AMRs, and cells — in 5 weeks. Real-time health monitoring, predictive failure detection, and automated CMMS integration. ROI evidence by week 3.
KPI Benchmarks: What Top-Performing Robot Fleets Actually Track
The most impactful robotics analytics programs don't track everything — they track the right things with the right frequency. Based on deployments across U.S. automotive, electronics, and consumer goods manufacturers, here are the KPIs that consistently drive measurable improvements when monitored continuously versus periodically.
94.7%
Robot Availability Rate
Target benchmark for high-performing facilities running predictive maintenance. Industry average without analytics: 81.3%. Each 1% availability improvement on a $2M robot line equals $160K+ annual throughput value.
±0.03mm
Positioning Accuracy Maintenance
Continuous TCP accuracy monitoring maintains precision within spec without manual calibration checks. Calibration drift caught within 2 cycles instead of discovered after bad batches ship.
41%
Reduction in Maintenance Labor Cost
Condition-based work orders replace time-based PM schedules. Technicians spend time on real degradation, not calendar-driven checks. Average labor savings: $67,000/year per 20-robot facility.
78%
AMR Route Efficiency Gain
Fleet-level route analytics identify congestion patterns, charging inefficiencies, and mission sequencing gaps. Average throughput recovery per 10-AMR fleet: $112,000 annually.
93%
Cell OEE Visibility Coverage
Full robotic cell OEE tracking — availability, performance, and quality — with automated bottleneck identification per handoff. Most plants discover 8–14% OEE leakage they were unaware of.
2–6 Weeks
Predictive Alert Lead Time
Average advance warning before mechanical failure across gearbox, servo, and bearing fault classes. Enough time to source parts, schedule downtime windows, and avoid emergency contractor mobilization costs.
<4%
False Positive Alert Rate
Multi-parameter cross-validation prevents alert fatigue and keeps maintenance teams focused on real degradation
100ms
Sensor Data Resolution
High-frequency telemetry capture ensures no degradation event is missed between monitoring cycles
7 days
CMMS Integration Timeline
Full SAP PM, Maximo, and Infor EAM connectivity with automated work order generation completed in under 7 days
$310K
Average Annual Savings
Per facility across downtime prevention, maintenance labor reduction, and throughput recovery
AMR Fleet Analytics: Optimization Beyond Basic Tracking
Real-time and historical route comparison identifies deadheading patterns, congestion hotspots, and suboptimal mission sequencing. AI recommends route restructuring with projected throughput impact per change.
Battery State-of-Health Modeling
Individual battery capacity curves tracked against charge cycle count, depth of discharge, and temperature history. Replacement recommendations arrive 4–8 weeks before capacity drops below operational threshold, avoiding mid-shift failures.
Collision Proximity Event Logging
Near-miss events — AMR-to-AMR, AMR-to-human, AMR-to-obstacle — logged automatically with location, time, speed context, and frequency trends. Safety intervention recommendations generated before incidents occur.
Charger Dock & Infrastructure Analytics
Charging infrastructure utilization, dock alignment accuracy, and queue wait time tracked at facility level. Identifies whether fleet throughput constraints come from AMR degradation vs. charging infrastructure bottlenecks — a distinction most facilities get wrong.
Financial Impact: Robotics Analytics ROI by Category
The business case for robotics analytics extends beyond maintenance cost savings. Each robot category delivers ROI across multiple value streams — downtime prevention, throughput recovery, labor optimization, and quality improvement. Here's how the economics break down from live facility deployments.
Cobot & Industrial Arm Predictive Maintenance
$142K
Annual downtime prevention per facility — eliminating unplanned arm failures at $18,000–$65,000/event, reducing emergency contractor mobilization, and recovering throughput from precision drift before quality escapes occur.
AMR Fleet Optimization & Battery Management
$112K
Annual throughput recovery and battery replacement cost reduction per 10-AMR fleet — route efficiency gains, eliminated mid-shift battery failures, and proactive charger infrastructure optimization.
Robotic Cell OEE & Quality Analytics
$156K
Annual quality cost and throughput recovery — eliminating scrap from gripper and vision drift, recovering OEE leakage from cell synchronization gaps, and reducing first-article inspection failures.
$310K
Average annual savings per facility across all robotics analytics categories
$98K
Average savings achieved within the first 3 weeks of full production rollout
18 months
Average full ROI payback period including platform and integration costs
Expert Review: What Robotics Engineers Get Wrong About Analytics Deployment
Expert Perspective
Principal Robotics Systems Engineer — Tier 1 Automotive Manufacturer, Michigan
"The most common mistake I see is treating robot analytics as a monitoring project instead of a decision-support system. Teams deploy dashboards, collect terabytes of data, and still make the same reactive maintenance decisions they always did — because the analytics never got close enough to operations to change behavior."
"Three things separate analytics programs that deliver ROI from ones that become shelf software. First, baselines must be task-specific, not robot-specific — a KUKA arm running a welding cycle has completely different healthy signatures than the same arm doing material handling. Second, alerts need to include business context: not just 'gearbox anomaly detected' but 'this represents a 73% probability of failure within 18 days, estimated downtime cost $34,000, next planned maintenance window is Tuesday.' Third, the work order integration has to be automatic — if a technician has to manually transcribe an alert into the CMMS, the analytics value erodes within 60 days. These aren't technology problems. They're implementation discipline problems."
Implementation Discipline Checklist:
Task-specific baselines per robot, not fleet-level averages
Alerts include failure probability, timeline, and cost context
Automated CMMS work order generation — zero manual transcription
Role-specific dashboards — operators, technicians, and managers see different views
Post-intervention feedback loops that improve future prediction accuracy
ROI tracking built into the platform from day one — not a post-hoc exercise
Conclusion: Robotics Analytics Is No Longer Optional for Competitive U.S. Manufacturing
The gap between manufacturers running comprehensive robotics analytics and those relying on reactive maintenance is widening at an accelerating pace. Plants with full-fleet predictive monitoring are recovering $310,000+ annually per facility while their competitors absorb unplanned downtime, emergency repair costs, and throughput losses that show up as margin compression quarter after quarter.
The plants that are winning on automation today didn't just install robots — they built the intelligence layer that keeps those robots performing at designed capacity, every shift, every quarter. That intelligence layer is robotics analytics, and the window to build a competitive lead with it is still open — but it's closing. Start with a no-obligation robotics analytics assessment from iFactory today.
Frequently Asked Questions
Does robotics analytics require replacing existing robot controllers or adding new hardware?
In most deployments, no replacement is required. iFactory connects to existing robot controllers — KUKA, FANUC, ABB, Universal Robots, and others — via OPC-UA, EtherNet/IP, and manufacturer-specific APIs. Where controller access is limited, lightweight edge gateway units collect vibration and thermal data externally without touching the robot's control architecture. Hardware needs are confirmed during the Week 1 facility audit.
How long does it take to establish accurate predictive maintenance baselines for a new robot fleet?
Initial AI baselines are established within 7–14 days of data collection under normal operating conditions. Prediction confidence increases progressively over the first 60 days as the models accumulate task-specific operational history. Early-phase alerts are flagged with confidence intervals so maintenance teams can calibrate their response thresholds before the models reach full accuracy.
Can the same analytics platform cover cobots, industrial arms, and AMRs simultaneously?
Yes — and that cross-fleet visibility is where significant additional value is captured. iFactory's platform maintains separate health models and KPI frameworks per robot type while surfacing fleet-level patterns in a unified dashboard. Facilities running mixed fleets typically discover inter-type interactions — like AMR traffic affecting cobot cycle times — that would be invisible in siloed, robot-specific monitoring tools.
What CMMS and ERP systems does iFactory's robotics analytics platform integrate with?
iFactory integrates natively with SAP PM and SAP EAM, IBM Maximo, Infor EAM, Oracle EAM, and most mid-market CMMS platforms via REST API and OData. ERP integration for parts procurement and labor cost tracking is available for SAP S/4HANA and Oracle Cloud. Integration scope and field mapping are confirmed during the Week 1 deployment audit — full connectivity is typically completed within 7 days.
How is robotics analytics ROI measured, and what's a realistic payback timeline?
ROI is tracked across four categories: downtime prevention (unplanned failures avoided × estimated downtime cost), maintenance labor reduction (condition-based vs. time-based PM labor delta), throughput recovery (OEE improvement × production value), and quality cost reduction (rework and scrap eliminated from precision drift). iFactory delivers a baseline ROI report at week 5 of deployment. Average full payback period across deployments is 14–18 months, with $98K average savings visible by week 3 of full production rollout.
Your Robot Fleet Is Losing $310,000 a Year Without Full Analytics Coverage. Fix It in 5 Weeks.
iFactory deploys real-time health monitoring, predictive failure detection, fleet intelligence, and automated CMMS integration across cobots, industrial arms, AMRs, and robotic cells — with a fixed 5-week timeline, guaranteed ROI evidence by week 3, and zero production disruption.
68% of unplanned robot downtime is preventable with real-time analytics
CMMS & ERP integration completed in under 7 days
2–6 week predictive lead time across gearbox, servo, and bearing faults
Less than 4% false positive alert rate — no alert fatigue
$310K average annual savings per facility from live deployments