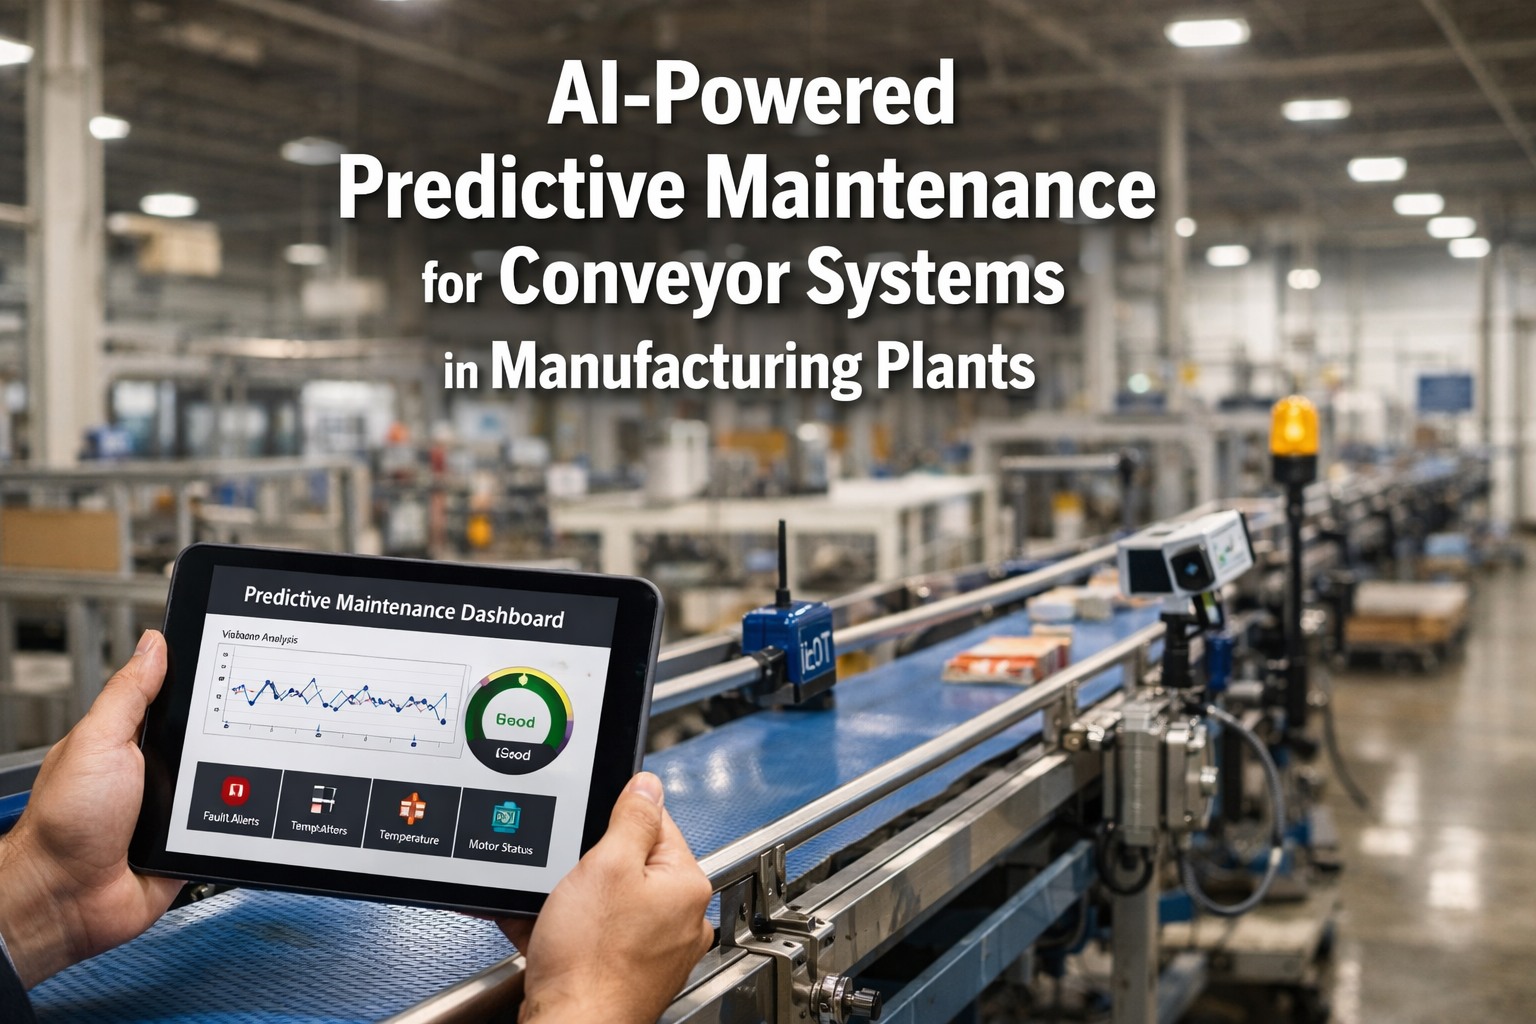
Predictive maintenance technology is transforming how U.S. manufacturers protect their most critical assets. By combining industrial IoT sensors, AI inference models, and edge computing into a unified stack, operations leaders are shifting from calendar-based repairs toward condition-driven decisions—catching equipment degradation days or weeks before a failure occurs. For plant managers under pressure from unplanned downtime, rising labor costs, and tightening OEE targets, building the right predictive maintenance technology stack is no longer optional. It is the competitive foundation that separates high-performing factories from those absorbing avoidable losses every quarter. This guide breaks down every layer of the modern stack—from vibration sensors on the plant floor to AI models in the cloud—and shows exactly how they integrate to deliver measurable reliability gains.
See How iFactory's Predictive Maintenance Stack Works in Your Plant
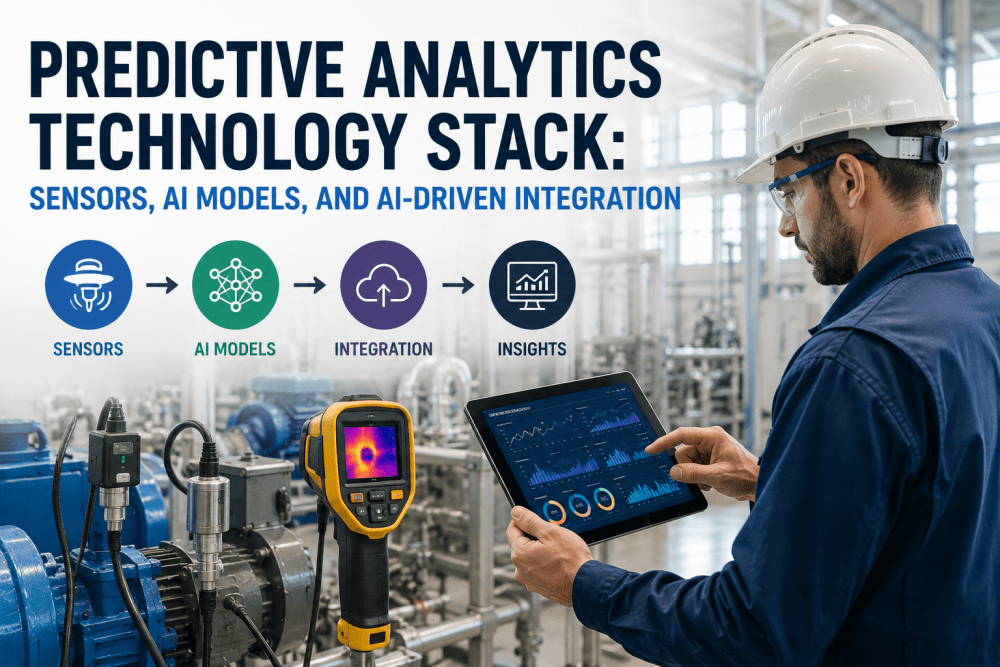
From vibration sensors to AI anomaly detection—iFactory delivers a fully integrated predictive maintenance platform purpose-built for U.S. manufacturing operations.
What Is a Predictive Maintenance Technology Stack?
A predictive maintenance technology stack is the integrated architecture of hardware sensors, data pipelines, machine learning models, and software dashboards that work together to monitor equipment health in real time. Unlike a single software tool, the stack functions as a complete sensing-to-decision system—from the accelerometer mounted on a motor shaft to the work order automatically generated when a bearing failure signature is detected. Understanding all five layers of this stack is critical for operations leaders who want to build a system that actually delivers ROI rather than just generating sensor data nobody acts on. Plant managers who book a demo with iFactory consistently report that seeing the full stack in action—from sensor ingestion to AI alert—is the moment the investment case becomes clear.
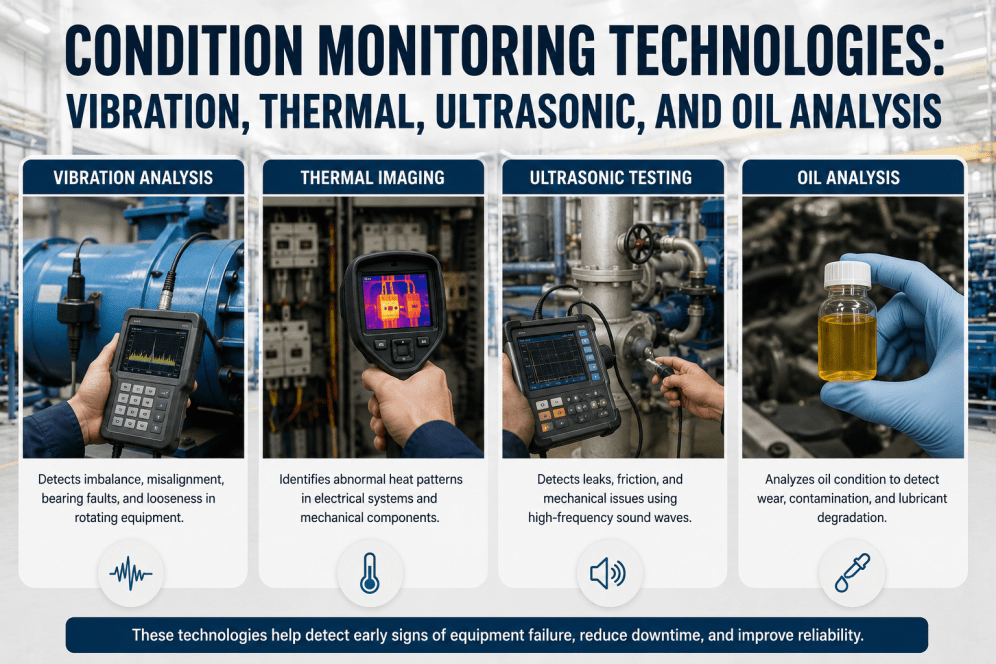
IoT Sensor Types: The Foundation of Every Predictive Maintenance Stack
The quality of every AI model downstream depends entirely on the richness and accuracy of the sensor data collected at the machine level. Selecting the wrong sensor type for a given failure mode is one of the most common and costly mistakes in early predictive maintenance deployments. Below is a definitive breakdown of the six core sensor categories used in U.S. manufacturing environments, with typical deployment targets and the failure modes each detects most reliably. Operations teams that schedule a demo with our engineers receive a custom sensor mapping exercise before any hardware is procured.
AI Models That Power Predictive Maintenance: A Technical Comparison
Not all AI models are created equal when it comes to manufacturing equipment analytics. The model architecture selected must match the failure mode being predicted, the volume of historical data available, and the acceptable latency for generating alerts. A Long Short-Term Memory (LSTM) network that excels at time-series anomaly detection on a compressor may be entirely the wrong choice for a multi-class fault classifier on a CNC spindle. Operations leaders who want to evaluate AI-driven capabilities without wading through academic literature can book a technical walkthrough to see each model type in a live plant context.
| AI Model Type | Best Use Case | Data Requirement | Alert Latency | iFactory Support |
|---|---|---|---|---|
| LSTM Neural Network | Time-series anomaly detection on motors, pumps, compressors | 6–12 months historical | <5 seconds | Native |
| Isolation Forest | Unsupervised outlier detection — minimal labeled fault data | 30 days baseline | <1 second | Native |
| Random Forest Classifier | Multi-class fault classification with labeled failure history | 500+ labeled events | <2 seconds | Native |
| Gradient Boosting (XGBoost) | RUL estimation · Maintenance scheduling optimization | 12+ months historical | Batch / Scheduled | Native |
| Transformer (Temporal Fusion) | Multi-variable forecasting across large asset portfolios | 24+ months, multi-asset | Near real-time | Roadmap |
| CNN (Spectrogram Analysis) | Acoustic / vibration signature fault fingerprinting | 200+ fault recordings | <500 ms | Native |
Remaining Useful Life (RUL) Estimation: The Metric That Changes Maintenance Planning
The most actionable output a predictive maintenance AI model can produce is a Remaining Useful Life estimate—a probabilistic forecast of how many operating hours remain before a specific component reaches its failure threshold. When an AI model estimates that a pump impeller has 340 operating hours remaining at current degradation velocity, the maintenance scheduler can plan the replacement at the next planned shutdown rather than scrambling during a production run. This single capability, when deployed correctly, is responsible for the majority of measurable ROI in most iFactory deployments.
Edge Computing in Predictive Maintenance: Why Local Intelligence Matters
Sending raw sensor data directly to the cloud for every predictive inference introduces two critical problems: latency and bandwidth cost. A vibration sensor sampling at 25 kHz generates roughly 50 MB of raw data per hour per asset. Across a facility with 200 monitored assets, cloud-only architectures become financially and technically untenable. Edge gateways resolve this by running the first tier of analytics—signal filtering, feature extraction, and threshold-based alerts—directly on the plant floor. Only compressed feature vectors and anomaly flags are transmitted upstream, reducing bandwidth requirements by up to 95% while keeping alert latency below two seconds.
- ✓ Alert latency: <2 seconds
- ✓ Operates offline during network outage
- ✓ 95% bandwidth reduction vs. raw stream
- ✓ Local data sovereignty / compliance
- ✓ Supports OPC-UA, Modbus, MQTT, EtherNet/IP
- – Higher upfront hardware investment
- ✗ Alert latency: 15–60 seconds
- ✗ Blind during network disruptions
- ✗ High bandwidth costs at scale
- ✓ Lower upfront deployment cost
- ✓ Easier model updates and versioning
- ✗ Data leaves plant perimeter
Protocol Translation: Connecting Legacy PLCs to Modern AI
The majority of U.S. manufacturing plants have significant investments in legacy PLC infrastructure running Modbus RTU, Profibus, or proprietary OEM protocols. Modern edge gateways bridge this gap by acting as universal translators—ingesting legacy signals and exposing them as standardized OPC-UA or MQTT data streams that cloud AI platforms can consume without custom engineering. This is the architectural insight that makes retrofitting legacy factories with AI-driven predictive maintenance both feasible and cost-effective—no rip-and-replace required. Plant engineers who want to map their existing PLC estate to a compatible sensor architecture can book a demo session with our integration engineers for a no-cost compatibility assessment.
AI-Driven Integration: How the Full Stack Flows from Sensor to Work Order
The true power of a predictive maintenance technology stack only emerges when every layer operates as a closed-loop system. The following workflow illustrates exactly how data moves from a bearing-mounted vibration sensor through the AI inference engine to an automatically generated CMMS work order—in under five seconds.
Vibration accelerometer samples at 25 kHz. Temperature RTD logs every 5 seconds. Current clamp monitors motor draw continuously. Raw signals are timestamped at the sensor level using local GNSS sync to prevent data drift.
Raw signals pass through FFT (Fast Fourier Transform) to generate spectral features. Edge gateway applies threshold filters and statistical feature extraction (RMS, kurtosis, crest factor). Only feature vectors—not raw waveforms—are transmitted upstream, compressing 50 MB to under 50 KB per asset per hour.
Feature vectors land in a time-series database (InfluxDB / TimescaleDB tier). Historical baselines for each asset are maintained as a rolling 90-day feature store. New data points are contextualized against asset-specific normal operating ranges before model inference begins.
LSTM model compares current spectral pattern against learned failure trajectories. Isolation Forest scores the data point for statistical anomaly. If the combined anomaly score exceeds the asset-specific threshold, a Fault Classification model identifies the specific failure mode—bearing inner race spall, imbalance, misalignment, or lubrication starvation.
Alert fires with fault type, severity score, RUL estimate, and recommended action. The iFactory CMMS automatically generates a work order assigned to the correct technician with parts list, safety procedure reference, and estimated repair window. Maintenance supervisor approves or reschedules within the mobile app—zero manual data entry required.
Ready to Build Your Predictive Maintenance Stack?
iFactory engineers map your existing PLC infrastructure, recommend the right sensor coverage, and configure AI models for your specific equipment fleet—delivered as one integrated platform.
Predictive Maintenance Stack Implementation Checklist
Before deploying any predictive maintenance technology investment, operations teams should validate readiness across six critical domains. This checklist reflects the pre-deployment assessment iFactory conducts with every new manufacturing partner. Teams that request a live walkthrough can complete this exercise collaboratively with our application engineers during the discovery call.
What U.S. Manufacturers Achieve with a Fully Integrated Stack
Based on iFactory deployments across discrete manufacturing, process industries, and food & beverage operations, the following benchmarks represent average performance improvements measured within 12 months of full predictive maintenance stack activation.
Expert Perspective: What Most Plants Get Wrong When Building a Predictive Stack
"The single most common mistake I see is plants that invest in sensors but skip the edge layer. They stream raw vibration data to the cloud, quickly discover the bandwidth costs are unsustainable, and scale back the deployment. The second most common mistake is deploying AI models before establishing a 30-day baseline. Without a reliable baseline of normal operating behavior per asset, your anomaly detection model will generate false positive alerts that destroy technician trust within weeks. Build the data foundation first. Let the AI learn what normal looks like. Then activate alerts. Plants that follow this sequence consistently hit their ROI targets. Plants that skip it rarely do."
Building Your Stack: The Path from Sensor Data to Competitive Advantage
A predictive maintenance technology stack is not a single product—it is an architecture built in layers, where the intelligence of each layer depends on the quality of the one below it. The right sensor on the right asset, processed by a well-configured edge gateway, feeding a properly trained AI model, and connected to an action-oriented CMMS is the sequence that drives the 47% downtime reductions and 14-month paybacks that leading U.S. manufacturers are reporting. The gap between a plant that generates sensor data and a plant that acts on AI-driven insights is not a technology gap. It is an architecture gap. Closing that gap with iFactory's fully integrated predictive maintenance platform is the fastest path to measurable, auditable reliability improvement in 2026. Book a demo with our engineering team to see exactly how each layer maps to your current infrastructure—no obligation, no boilerplate pitch.
Predictive Maintenance Technology Stack — Frequently Asked Questions
How many sensors does a plant need to get started with predictive maintenance?
Most iFactory deployments begin with a focused pilot covering 10–20 critical assets rather than instrumenting the entire facility. This approach generates quick-win ROI from the highest-risk equipment while building the operational discipline and data confidence needed to expand. A single chiller with vibration, temperature, and current monitoring can demonstrate the full stack value within 60 days of deployment.
Can AI predictive maintenance work on older equipment without existing sensors?
Yes. Retrofit sensor kits—wireless vibration nodes, clip-on current transformers, and surface-mount temperature patches—can be installed on virtually any rotating or electrical asset without modifying the equipment or interrupting production. The iFactory edge gateway then ingests these new signals alongside any existing PLC data, creating a unified asset health view regardless of equipment age or manufacturer.
How long does it take for AI models to become accurate enough to generate reliable alerts?
Unsupervised models like Isolation Forest can establish an anomaly detection baseline within 30 days of sensor data. Supervised fault classifiers that distinguish between specific failure modes—bearing spall vs. imbalance vs. misalignment—typically require 90–180 days of operational data enriched with maintenance event logs. iFactory accelerates this process using cross-fleet transfer learning, where anonymized patterns from similar assets across the deployed customer base are used to seed model training.
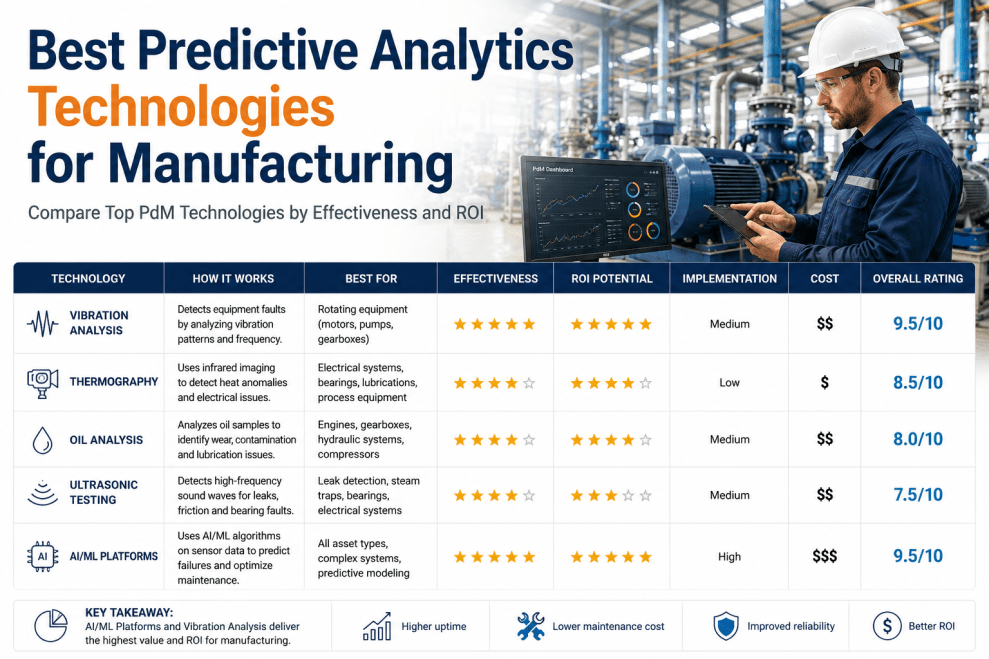
What is the difference between condition monitoring and predictive maintenance?
Condition monitoring is the practice of continuously measuring equipment parameters (vibration, temperature, current) against static thresholds—it tells you when a value exceeds a limit today. Predictive maintenance goes further by using AI to identify the trajectory of degradation and forecast when a failure will occur, enabling planned maintenance rather than reactive response. Condition monitoring is a prerequisite for predictive maintenance, not a substitute for it.
How does iFactory's predictive maintenance platform integrate with existing CMMS or ERP systems?
iFactory provides native REST API and webhook connectors for the major CMMS platforms including SAP PM, Maximo, Infor EAM, and eMaint. When the AI detects a fault, a fully populated work order—including asset ID, fault description, severity, RUL estimate, and recommended action—is automatically created in the CMMS without any manual data entry. ERP integration for spare parts procurement and labor cost tracking is available through the same connector framework.
Stop Reacting to Breakdowns. Start Predicting Them.
iFactory's fully integrated predictive maintenance stack—from sensor selection to AI anomaly detection to automated work orders—is purpose-built for U.S. manufacturing operations. See every layer working live in your plant context.