Maintenance budgeting in manufacturing has evolved from a back-office accounting exercise into a strategic discipline that directly determines plant profitability, asset reliability, and competitive positioning. The plants that consistently deliver 95%+ Overall Equipment Effectiveness, sub-3% unplanned downtime, and maintenance costs below 2.5% of Replacement Asset Value are not spending less than their peers — they are spending more intelligently, guided by structured cost models, industry benchmarks, and rigorous ROI analysis on every maintenance dollar deployed. For U.S. discrete and process manufacturers operating in 2026's margin-compressed environment, the gap between top-quartile and bottom-quartile maintenance cost performance can equal 3 to 5 percentage points of EBITDA — a difference that often exceeds the total maintenance budget itself. Manufacturers using iFactory's Analytics & Reporting Dashboard have shifted from reactive spend tracking to predictive budget modeling — reducing total maintenance cost by 18 to 24% within 18 months while simultaneously improving asset availability and extending equipment life cycles.
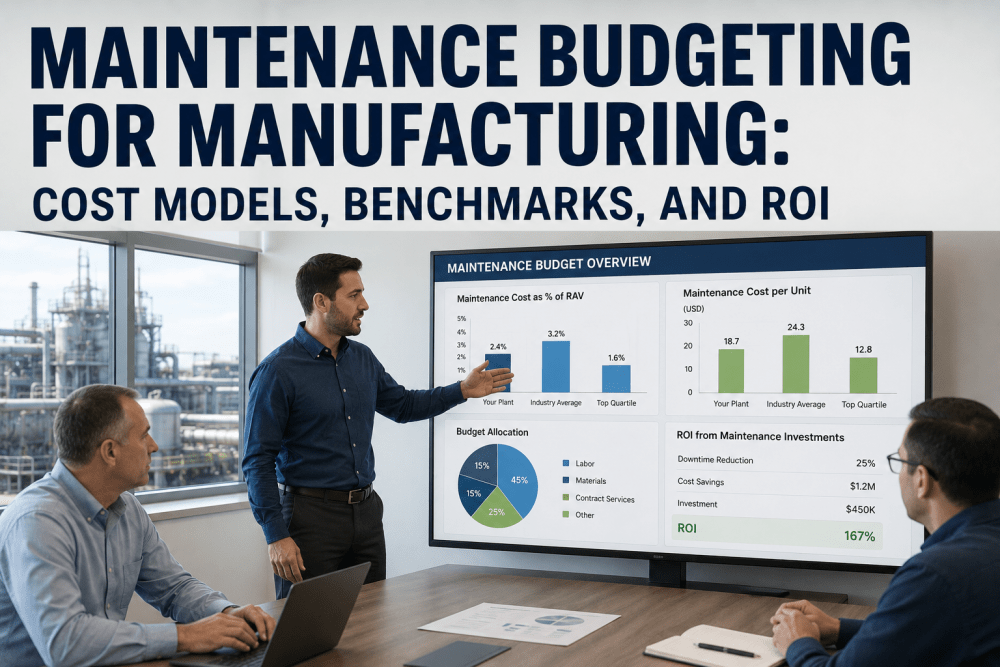
Maintenance Budgeting for Manufacturing: Cost Models, Benchmarks, and ROI
Build defensible maintenance budgets grounded in RAV benchmarks, cost-per-unit models, and ROI-driven prioritization. Move from reactive spend tracking to predictive financial planning with iFactory's Analytics & Reporting Dashboard.
Why Maintenance Budgeting Is the Most Underused Lever in Manufacturing Finance
Most plant managers and CFOs treat the maintenance budget as a fixed cost line — set annually based on the prior year's spend plus an inflation adjustment, monitored monthly against accruals, and rarely revisited until variance forces a conversation. This treatment is operationally inefficient and financially expensive. Maintenance is not a fixed cost. It is a controllable investment that responds directly to asset strategy, work order discipline, parts inventory management, and the maturity of the predictive analytics layer used to deploy maintenance hours.
The shift from reactive to predictive maintenance budgeting changes the conversation entirely. Instead of asking "how much did we spend?", the financial conversation becomes "what return did we generate per dollar deployed?" — a question that exposes the misallocation patterns hidden inside every traditional maintenance budget and identifies the high-leverage corrections that compound over multiple budget cycles.
Budget Set by Precedent, Not Strategy
Last year's spend plus 3% becomes this year's budget — regardless of whether last year's spend was efficient, reactive-heavy, or distorted by major unplanned events. The result is structural overspending in some asset classes and underinvestment in others, with no visibility into which is which.
No Linkage Between Spend and Reliability Outcomes
Without an analytics layer connecting maintenance spend to MTBF, MTTR, and downtime data at the asset level, finance and operations cannot answer the fundamental question: did the money we spent reduce failures? When that question can't be answered, every budget review reverts to negotiation rather than analysis.
CapEx and OpEx Decisions Made in Isolation
Capital replacement decisions are evaluated against capital hurdle rates while maintenance OpEx is tracked against operating budgets — but the two are economically linked. Extending a worn asset's life through increased maintenance spend defers capital, and accelerating replacement reduces maintenance. Without integrated cost modeling, this tradeoff is invisible.
The Four Cost Models Every Maintenance Budget Should Use
A defensible maintenance budget is not built from a single number — it is constructed from four complementary cost models, each answering a different question and each providing a different check on the others. When all four models converge on a similar budget figure, the plan is credible. When they diverge significantly, the divergence itself becomes the conversation that surfaces hidden assumptions and risks.
Want to see all four cost models running against your actual plant data? Book a Demo with iFactory's analytics team and review your maintenance budget against the benchmarks that matter.
Industry Benchmarks: What Top-Quartile Manufacturers Spend
Benchmarks are most useful when segmented by industry, asset intensity, and operating profile rather than expressed as a single number. The figures below reflect aggregated U.S. manufacturing benchmark data across discrete and process sectors, calibrated for plants operating with mature reliability programs and analytics-driven maintenance planning.
| Industry Sector | Top Quartile (% RAV) | Median (% RAV) | Bottom Quartile (% RAV) | PdM Spend Share |
|---|---|---|---|---|
| Automotive Assembly | 2.0–2.4% | 3.1% | 4.6% | 22–28% |
| Steel & Metals | 2.4–2.8% | 3.6% | 5.4% | 18–24% |
| Food & Beverage | 2.2–2.6% | 3.3% | 4.8% | 16–22% |
| Chemicals & Process | 1.8–2.3% | 2.9% | 4.4% | 24–32% |
| Pharmaceuticals | 2.6–3.1% | 3.8% | 5.6% | 20–26% |
| Cement & Building Materials | 2.8–3.4% | 4.2% | 6.1% | 18–24% |
| Textile Manufacturing | 2.0–2.5% | 3.2% | 4.9% | 14–20% |
| Power Generation | 1.6–2.1% | 2.7% | 4.2% | 28–36% |
Two patterns are consistent across every sector. First, the gap between top and bottom quartile is approximately 2× — top-quartile plants spend roughly half what bottom-quartile plants spend per dollar of asset value, with measurably better reliability outcomes. Second, top-quartile plants consistently allocate a larger share of total maintenance spend to predictive maintenance versus reactive maintenance, indicating that the right composition of spend matters more than the absolute total.
The Maintenance Budgeting Workflow: From Asset Data to Approved Plan
Building a defensible maintenance budget is not a finance exercise performed in isolation — it is a structured workflow that integrates asset data, reliability analytics, financial modeling, and operational planning. The workflow below reflects the budgeting process used by manufacturers operating iFactory's Analytics & Reporting Dashboard alongside their CMMS and ERP systems.
Asset Register Validation and RAV Refresh
The starting point for any credible maintenance budget is a current, complete asset register with accurate replacement asset valuations. Most plants discover during this step that 15 to 25% of their asset records carry outdated valuations, missing criticality classifications, or incorrect operational status. iFactory's Analytics Dashboard reconciles the CMMS asset register against current production usage and updates RAV based on current replacement cost methodology, generating the foundation for every downstream calculation.
Historical Spend Analysis and Pattern Classification
Three years of historical maintenance spend is decomposed by asset, work order class (PM, PdM, corrective, emergency), labor versus parts, and internal versus contracted resources. This analysis reveals the spend allocation patterns that drive the current cost profile and identifies the high-leverage corrections. Plants typically discover 8 to 15% of historical spend was misclassified or applied to assets that have since been retired or significantly modified.
Reliability Performance and Failure Mode Review
Asset reliability performance — MTBF, MTTR, downtime hours, and failure mode distribution — is reviewed against industry benchmarks and prior-year targets. Assets with declining reliability trends are flagged for increased PM/PdM investment in the upcoming budget; assets with strong reliability and low recent spend are candidates for PM optimization. This step converts the maintenance budget conversation from a cost discussion into a reliability investment discussion.
Four-Model Budget Build and Reconciliation
The four cost models — RAV, cost per unit, asset criticality, and zero-based — are run in parallel using validated inputs from the prior steps. The four model outputs are reconciled against each other, with divergences investigated and resolved before the budget is finalized. Models that converge within 5% of each other indicate a credible budget; models that diverge by 15% or more indicate underlying assumptions that must be surfaced and addressed.
ROI Prioritization and Scenario Modeling
Major budget line items — capital deferral decisions, new PdM technology investments, shutdown scope, contracted service additions — are evaluated through ROI analysis with explicit downtime avoidance, yield improvement, and asset life extension benefits. Multiple budget scenarios are modeled (constrained, baseline, expanded) showing the reliability and cost-per-unit consequences of each, allowing finance and operations to align on tradeoffs before approval.
Monthly Variance Tracking and Forecast Refresh
Once approved, the budget enters the active management cycle. iFactory's Analytics Dashboard tracks monthly variance against plan at the asset, work order class, and resource category level — flagging deviations early and updating the full-year forecast based on actual spend patterns and emerging reliability data. This continuous refresh replaces the traditional once-a-year budget process with rolling 18-month forward visibility that adapts as the operational reality changes.
ROI Analysis: Calculating Returns on Maintenance Investment
Maintenance ROI calculations are often dismissed as soft because the avoided costs — failures that didn't happen, downtime that wasn't taken, yield that wasn't lost — are inherently harder to measure than incurred costs. This dismissal is wrong both technically and strategically. Maintenance ROI is calculable with the same rigor as any other capital or operating investment when the right data structure is in place, and the failure to calculate it leaves the maintenance organization unable to defend its budget in the conversations that matter.
CapEx vs OpEx: Resolving the Hidden Tradeoff
The financial tension between maintenance OpEx and capital replacement CapEx is the single largest unmanaged variable in most manufacturing financial plans. Plant operations are incentivized to extend asset life through maintenance because capital is constrained; corporate finance is incentivized to control maintenance spend because OpEx flows directly to operating margin. The result is a structural disagreement that produces poor decisions in both directions — overspending on dying assets that should have been replaced, and prematurely replacing assets that could have run profitably for years longer with the right maintenance investment.
The resolution to the CapEx-OpEx tradeoff is integrated lifecycle cost modeling — calculating the present value cost of maintaining versus replacing on a per-asset basis using actual reliability data, maintenance cost trends, and replacement asset economics. iFactory's Analytics & Reporting Dashboard generates this calculation continuously for every critical asset, producing the decision-quality data that allows operations and finance to align rather than negotiate.
Want a CapEx vs OpEx analysis for your plant's critical assets? Book a Demo with iFactory's analytics team and see the lifecycle cost calculation on your actual equipment.
Expert Review
After 19 years building maintenance budgets across U.S. discrete and process manufacturing facilities — including six greenfield plant startups and twelve mature plant turnarounds — the patterns that separate top-quartile from bottom-quartile cost performance are not about spending more or spending less. They are about three specific disciplines that compound across budget cycles.
Conclusion
Maintenance budgeting is no longer a finance department exercise performed once a year — it is a continuous discipline that integrates asset data, reliability analytics, and financial planning into a rolling forward view of plant cost and performance. The manufacturers operating at top-quartile cost performance are not the ones spending the least. They are the ones with the most rigorous cost models, the cleanest asset data, the strongest linkage between spend and reliability outcomes, and the analytical infrastructure that makes ROI visible at the level where budget decisions are actually made.
iFactory's Analytics & Reporting Dashboard provides that infrastructure — bringing the four cost models, industry benchmarks, ROI analysis, and rolling forecast capability into a single platform that integrates with your existing CMMS and ERP systems. The 18 to 24% maintenance cost reduction reported by deployed facilities is not the result of cutting work — it is the result of cutting the work that no longer earns its place and reinvesting the freed budget in the work that drives the highest reliability and lifecycle cost returns.
Frequently Asked Questions
Move From Reactive Spend Tracking to Predictive Budget Modeling
iFactory's Analytics & Reporting Dashboard brings the four cost models, industry benchmarks, ROI analysis, and rolling forecast capability into a single platform — purpose-built for U.S. manufacturers driving structural cost performance.