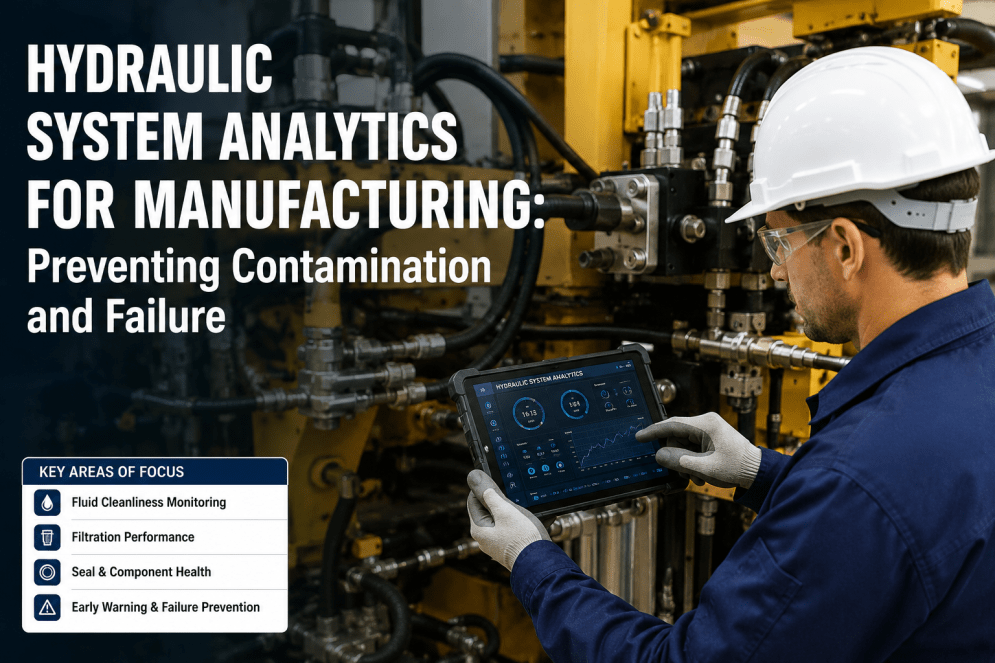
Hydraulic systems are the silent workhorses of modern manufacturing — powering presses, injection molding machines, stamping lines, machine tools, and material handling equipment with precision that no other power transmission technology can match. Yet they are also among the most underdiagnosed assets on the plant floor. Industry research consistently attributes 75–90% of hydraulic system failures to contamination, with the remainder driven by overheating, cavitation, and seal degradation that condition-based monitoring could have caught weeks earlier. The cost is staggering: a single unplanned hydraulic failure on a critical production line can exceed $50,000 in lost throughput, emergency labor and component replacement. Book a Demo to see how iFactory AI's Preventive Analytics Scheduling platform protects hydraulic assets through continuous fluid health, pressure, and temperature monitoring.
Stop Hydraulic Failures Before They Stop Your Production Line
iFactory AI's hydraulic system analytics combine ISO 4406 particle monitoring, pressure trending, and AI-driven failure prediction — delivering up to 3–4 weeks of advance warning before catastrophic component failure.
Why Hydraulic Contamination Is the #1 Cause of Manufacturing Equipment Failure
Walk into any U.S. manufacturing plant experiencing chronic hydraulic problems, and the diagnosis is almost always the same: contaminated fluid. Particles smaller than the width of a human hair circulate through pumps, valves, and cylinders at thousands of pounds per square inch — scoring precision-machined surfaces, jamming spool valves, eroding pump vanes, and depositing varnish on servo components. The damage compounds silently. By the time an operator notices erratic cylinder motion, falling cycle pressures, or sudden temperature spikes, the system has already accumulated weeks of internal wear that cannot be reversed without major rebuilds.
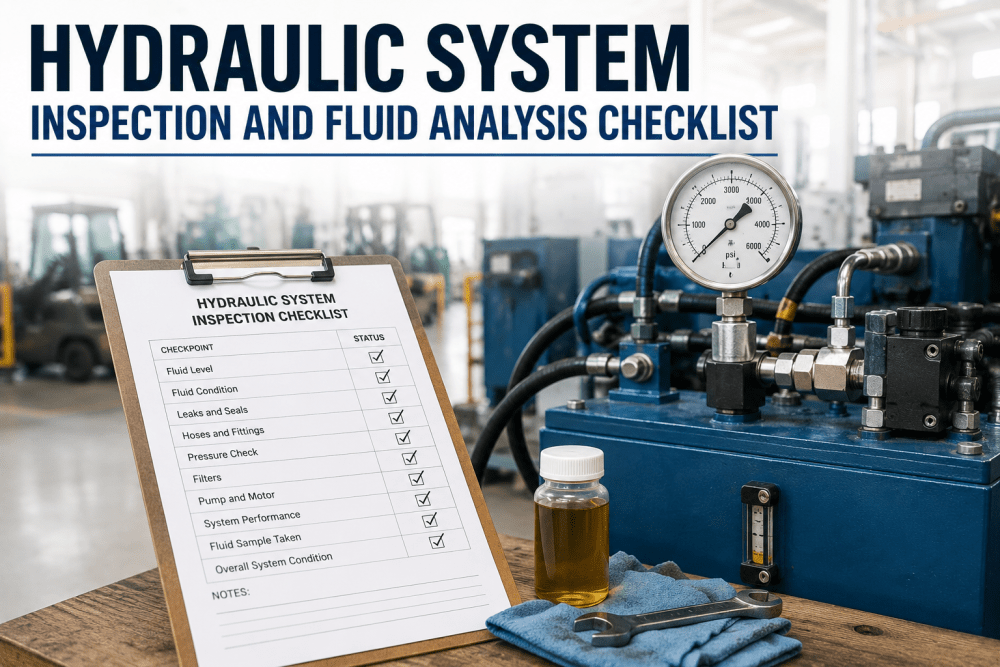
The mechanical reality is unforgiving: hydraulic components are manufactured with clearances measured in microns. A servo valve spool may have only 2–5 micron clearance between spool and bore. When particles in that size range circulate continuously through the fluid, abrasive wear is inevitable. The international standard for measuring this risk — ISO 4406 — quantifies particle counts at 4µm, 6µm, and 14µm thresholds, providing maintenance teams with the objective cleanliness data they need to predict component life. Yet most manufacturing plants still rely on quarterly oil samples sent to external labs, returning results that are 7–14 days old by the time corrective action could begin. iFactory AI replaces this lag with continuous inline particle counting — surfacing contamination trends in real time before damage occurs.
Hydraulic Component Failure Modes: What to Monitor and Why
Each hydraulic component degrades through a distinct mechanical pathway, and effective predictive maintenance requires component-specific analytics — not a single generic alert threshold applied across the entire system. The following framework represents current best practice for hydraulic equipment condition monitoring in U.S. manufacturing environments.
Hydraulic Pumps: Cavitation, Wear Particles & Volumetric Efficiency Drift
Hydraulic pumps — whether vane, gear, or piston designs — are the highest-cost and most failure-sensitive components in any industrial hydraulic circuit. Internal wear on pump vanes, gear teeth, and piston shoes generates metal particles that contaminate the fluid and accelerate damage downstream. Cavitation — fluid vaporizing under low suction pressure — causes pitting damage that remains invisible until volumetric output drops critically. By the time an operator reports "the press is slow," the pump has typically lost 15–25% of rated output and is weeks from catastrophic failure.
iFactory AI's pump analytics module monitors suction-side pressure, discharge pressure ripple, case drain flow, and motor amp draw simultaneously — building a multi-parameter pump health signature that detects cavitation onset, vane wear, and bearing degradation 2–4 weeks before output performance is affected on the production floor.
Servo & Proportional Valves: Spool Wear, Stiction & Response Lag
Servo and proportional valves are the most contamination-sensitive components in any hydraulic system. With internal spool clearances of just 2–5 microns, even moderately contaminated fluid causes progressive spool wear, internal leakage, and eventual sticking. In closed-loop motion control systems — injection molding, machine tool axis drives, press tonnage control — spool wear changes the valve gain curve, producing erratic machine behavior that often gets misdiagnosed as a controller problem until valve flow testing reveals the actual fault.
iFactory AI tracks valve response time, pressure overshoot, and command-to-flow correlation on every actuation cycle — flagging spool wear and stiction patterns before they translate into scrap, off-spec parts, or unplanned line stoppages. The platform's AI models distinguish between contamination-induced sticking, electrical coil degradation, and mechanical spring failure — directing technicians to the correct root cause instead of trial-and-error valve swaps.
Hydraulic Cylinders: Seal Wear, Rod Scoring & Internal Bypass Detection
Hydraulic cylinders fail most often through piston seal wear, rod seal degradation, and rod surface scoring caused by particles dragged past wiper seals during retraction strokes. Once internal bypass begins — fluid leaking from the pressure side to the return side past worn piston seals — cycle times extend, holding pressure decays, and downstream products fall out of dimensional tolerance. External rod leaks become visible only after seal wear is already advanced, by which point production has likely been producing marginal product for days.
iFactory AI monitors cylinder cycle time, holding pressure decay rate, and position-versus-flow correlation continuously — detecting internal bypass at the earliest measurable stage, often when bypass volume is still under 2% of stroke volume. The platform also tracks rod surface temperature differentials that indicate scoring damage progressing along the rod travel path.
Filtration Systems: Differential Pressure, Element Loading & Bypass Activation
Filtration is the primary defense against hydraulic contamination, yet filters themselves are often the most neglected components on the manifold. As filter elements load with particles, differential pressure across the element rises — and once the bypass valve opens, unfiltered fluid flows directly to sensitive downstream components. Most plants discover bypass activation only at the next quarterly filter change, by which point days or weeks of contaminated fluid has circulated through pumps and valves.
iFactory AI continuously monitors filter differential pressure on every hydraulic circuit, generating condition-triggered work orders the moment loading trends suggest replacement is needed — typically 3–7 days before bypass activation. Combined with inline ISO 4406 particle counting, this approach maintains target cleanliness codes (e.g., 16/14/11 for servo systems) with measurable consistency rather than relying on calendar-based filter changes.
Hydraulic Fluid Cleanliness Targets: ISO 4406 by Equipment Type
The ISO 4406 standard expresses fluid cleanliness as a three-number code representing particle counts at 4µm, 6µm, and 14µm. The scale is logarithmic: every single point increase represents a doubling of particles in that size range. Setting and maintaining the correct cleanliness target for each piece of equipment is one of the most impactful actions a maintenance team can take — but the right target depends entirely on the component's internal clearance and pressure rating.
| Equipment Type | Target ISO 4406 Code | Operating Pressure | Impact of Exceeding Target |
|---|---|---|---|
| Servo Valves | 16/14/11 | 2,000–4,000 PSI | 4–6× higher failure rate |
| Proportional Valves | 17/15/12 | 2,000–3,500 PSI | Sluggish response, scrap parts |
| Piston Pumps (Variable) | 18/16/13 | 3,000–6,000 PSI | Premature pump wear, low output |
| Vane Pumps | 19/17/14 | 1,500–3,000 PSI | Vane wear, internal leakage |
| Standard Cylinders | 20/18/15 | 1,000–3,000 PSI | Seal wear, rod scoring |
| Mobile/Low-Pressure Systems | 21/19/16 | Under 2,000 PSI | Reduced fluid & component life |
iFactory AI's Preventive Analytics Scheduling platform automatically applies the correct cleanliness target to each monitored hydraulic circuit, triggering corrective actions when actual particle counts approach the threshold. This eliminates the manual interpretation step that most maintenance teams struggle with and ensures every hydraulic asset operates within its specified cleanliness envelope.
From Reactive Repair to Condition-Triggered Hydraulic Maintenance
Traditional hydraulic maintenance is reactive: a component fails, production stops, and a technician scrambles to diagnose and repair the issue. Even calendar-based preventive maintenance falls short — replacing healthy filters every 90 days while missing the contamination event that occurred on day 45. iFactory AI replaces both approaches with a continuous, condition-driven workflow that responds to real-time equipment health rather than fixed schedules.
Continuous Sensor Data Collection
IoT sensors measure pressure, temperature, flow, particle count, water content, and viscosity at multiple points across each hydraulic circuit — feeding data to the iFactory AI platform every few seconds. PLC and SCADA integration captures pump amperage, valve commands, and cylinder position data without modifying control systems.
AI Baseline & Anomaly Detection
Machine learning models establish normal operating signatures for each hydraulic asset across all production conditions. Once baselines are set, the AI continuously compares live sensor data against learned patterns, surfacing deviations that traditional threshold alarms would miss — including subtle cavitation onset, slow contamination buildup, and valve response drift.
Condition-Triggered Work Order Generation
When AI health scores breach pre-defined thresholds, iFactory AI automatically generates targeted work orders with diagnostic context, recommended parts, and estimated repair time. Maintenance teams receive prioritized task lists ranked by failure risk and production impact — eliminating wasted PM labor on healthy assets.
Post-Repair Validation & Continuous Learning
After every maintenance event, sensor data confirms that hydraulic parameters have returned to baseline before production restart approval is granted. Each work order outcome — successful repair, premature recurrence, or false alarm — feeds back into the AI models, continuously improving prediction accuracy over time.
The Financial Impact of Hydraulic Analytics on U.S. Manufacturing Operations
For manufacturers running hydraulic-intensive equipment — stamping presses, injection molding machines, die casting cells, machine tools — hydraulic reliability directly determines plant throughput and product quality. A single unplanned hydraulic failure on a high-throughput line typically costs $15,000–$80,000 in lost production, emergency labor, replacement components, and quality losses. Multiplied across a fleet of 20–40 hydraulic-powered assets, the annual cost of preventable failures regularly exceeds $1.5 million.
| Cost Category | Without Analytics | With iFactory AI | Annual Impact |
|---|---|---|---|
| Unplanned Hydraulic Failures | 8–12 events/yr per line | Under 2 events/yr | $680,000+ recovered uptime |
| Hydraulic Fluid Consumption | Full system changes every 6 mo | Condition-based fluid life | $95,000/yr in fluid & disposal |
| Pump & Valve Replacement | $240,000/yr per plant | $70,000/yr per plant | $170,000/yr saved |
| Scrap & Quality Losses | 2.4–3.8% rejection rate | Under 0.6% rejection rate | $210,000/yr per line |
| Filter Element Costs | Calendar replacement | Condition-triggered only | $48,000/yr per plant |
| Hydraulic Asset Lifespan | 10–14 year average | 18+ year lifespan | $280,000 CapEx deferral |
For a typical U.S. manufacturing facility with 25–40 hydraulic-powered assets, iFactory AI customers consistently report total annual value realization between $1.4M and $2.2M, with measurable ROI achieved within the first 6–9 months of deployment.
Make Every Hydraulic System in Your Plant Predictable
From injection molding cells to 4,000-ton stamping presses, iFactory AI delivers component-level health visibility that transforms hydraulic maintenance from reactive firefighting to engineered reliability.
Expert Perspective: What World-Class Hydraulic Reliability Programs Have in Common
After two decades reviewing hydraulic reliability programs across automotive, aerospace, plastics, and heavy machinery manufacturing facilities, one pattern is consistent: the plants achieving top-quartile hydraulic uptime are not the ones spending the most on maintenance — they are the ones who have shifted from time-based intervention to condition-based decision-making. The technical foundation is always the same: continuous fluid cleanliness monitoring, multi-parameter component health tracking, and integrated work order systems that respond to data, not to the calendar.
The plants still struggling with chronic hydraulic problems share a different set of patterns: oil samples sent to external labs and forgotten until results arrive, filter elements replaced on fixed schedules regardless of differential pressure, valve failures diagnosed by part swapping rather than diagnostic data, and reliability metrics measured in mean-time-between-failure rather than predictive lead time. The gap between these two operating philosophies typically represents 15–25 percentage points of OEE — and millions of dollars of recoverable annual value.
"The most cost-effective hydraulic reliability investment a U.S. manufacturer can make today is not bigger pumps or premium oil — it is real-time visibility into fluid cleanliness and component health. Once a plant can see what its hydraulic systems are actually doing minute-by-minute, the entire maintenance philosophy changes."
— Manufacturing Reliability Engineering Practice, iFactory AI Customer Success Team
Deploying Hydraulic Analytics in 90 Days Without Disrupting Production
U.S. manufacturing plants operate on tight production schedules — sensor installation downtime is a non-starter. iFactory AI's deployment methodology is engineered around this constraint, with all sensor placement, integration, and AI model training executed during scheduled maintenance windows, weekend stops, and planned changeover periods. Most plants achieve full hydraulic monitoring coverage without a single hour of dedicated installation downtime.
Asset Audit & Sensor Specification
Comprehensive hydraulic system audit identifies critical assets, existing sensor coverage, and required additions. Pressure transducers, particle counters, temperature probes, and water-in-oil sensors specified per circuit based on equipment criticality and ISO 4406 targets.
Sensor Installation & PLC Integration
Sensors installed during planned maintenance windows. PLC, SCADA, and CMMS systems integrated with the iFactory AI platform. Universal IoT bridge connects legacy hydraulic equipment without native digital outputs, enabling whole-plant visibility regardless of equipment age.
AI Baseline & Predictive Alerts Activation
Machine learning models learn normal hydraulic operating signatures across all production conditions. First predictive alerts generated. Maintenance teams transition from time-based PM rounds to AI-directed interventions, typically identifying 4–8 developing issues in the first 30 days.
Full Dashboard & KPI Reporting Live
Plant-wide hydraulic reliability dashboard activated. ISO 4406 compliance reporting automated. Component-level remaining useful life predictions live for every monitored asset. KPI reports for plant management aligned with maintenance budget and capex planning cycles.
From Hydraulic Firefighting to Engineered Reliability
Hydraulic system failure is not a matter of "if" — it is a matter of "when," and how much warning the maintenance team receives before production is affected. The choice between reactive repair and predictive intervention is fundamentally an information problem. With continuous monitoring of fluid cleanliness, component pressures, valve response, and pump efficiency, the warning signs of failure become visible weeks before mechanical breakdown occurs. Without that visibility, every hydraulic failure feels sudden — even when the technical degradation was actually weeks or months in the making.
U.S. manufacturers competing on cost, quality, and delivery cannot afford to treat hydraulic systems as black boxes. The technology to predict hydraulic failures with 3–4 weeks of advance warning is proven, deployable in 90 days, and pays for itself within the first year through reduced downtime, lower component replacement costs, and improved product quality. iFactory AI's Preventive Analytics Scheduling platform delivers this capability today, with the equipment-specific component analytics and ISO 4406 compliance reporting that U.S. manufacturing reliability programs demand. Book a Demo to map iFactory AI's hydraulic analytics capability to your specific equipment fleet.
Frequently Asked Questions: Hydraulic System Analytics
What is the most important hydraulic parameter to monitor for predictive maintenance?
Fluid cleanliness measured against ISO 4406 standards is the single most predictive indicator of hydraulic system health. Because 75–90% of hydraulic failures trace back to contamination, continuous particle counting at 4µm, 6µm, and 14µm thresholds provides earlier warning than any other measurement. iFactory AI combines ISO 4406 monitoring with pressure, temperature, and flow analytics to build a complete equipment health picture.
Can iFactory AI monitor older hydraulic equipment without digital sensors?
Yes. iFactory AI's universal IoT bridge supports non-invasive sensor retrofits on legacy hydraulic systems — including pressure transducers, particle counters, vibration sensors, and thermal probes that install without modifying the original equipment or requiring OEM cooperation. The platform translates analog machine behavior into digital health scores for any hydraulic asset, regardless of age.
How quickly will we see results from hydraulic analytics deployment?
Most U.S. manufacturing customers identify the first preventable failure event within 30 days of sensor activation. Full ROI — through reduced downtime, lower component spend, and improved fluid life — is typically achieved within 6–9 months. Plants with starting hydraulic reliability below 88% see the fastest returns because preventable failure events are more frequent and impact is higher.
Does the platform support ISO 4406 compliance reporting for audits?
iFactory AI auto-generates audit-ready ISO 4406 cleanliness records for every monitored hydraulic circuit, with timestamped particle count trends, target threshold alerts, and corrective action histories. These records are stored in searchable format and satisfy the equipment maintenance documentation requirements of ISO 9001, IATF 16949, AS9100, and similar quality management standards.
How does the AI distinguish between normal pressure variation and an actual problem?
iFactory AI's machine learning models establish baseline signatures for each hydraulic asset across every operating condition the equipment encounters — different SKUs, different cycle rates, different production loads. The AI compares live data against the appropriate baseline context, eliminating the false-positive alerts that plague simple threshold-based monitoring. The result is high-confidence alerts that maintenance teams trust and act on.
Make Hydraulic Failures a Thing of the Past
iFactory AI's Preventive Analytics Scheduling platform is protecting hydraulic-intensive operations at U.S. manufacturers across automotive, aerospace, plastics, metals, and machine tool industries. See a live walkthrough of the hydraulic analytics dashboard — no obligation, tailored to your equipment fleet.