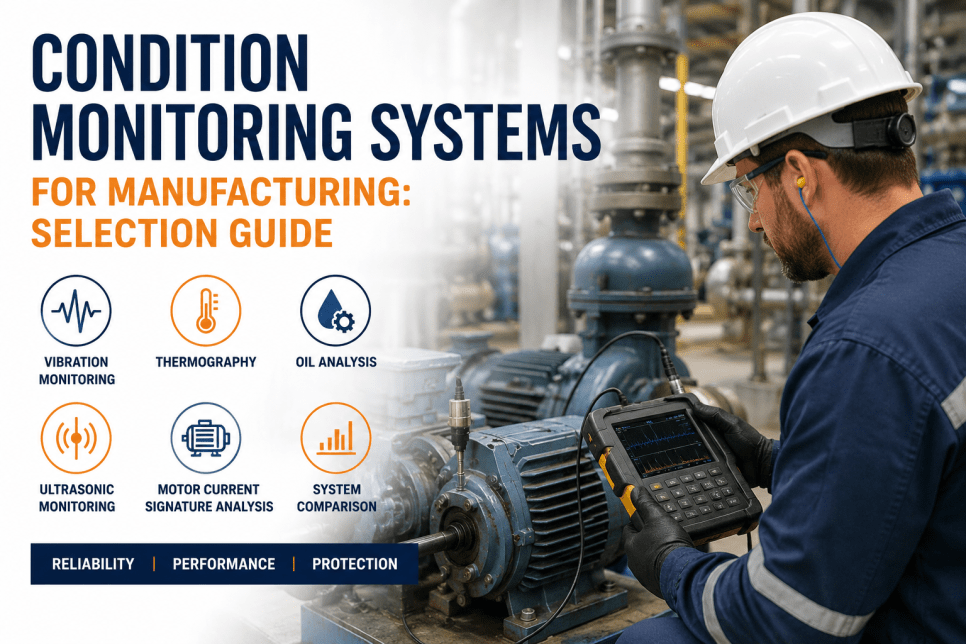
Condition Monitoring Systems for Manufacturing: Selection Guide
By Hannah Baker on June 8, 2026
Selecting the right condition monitoring system for a manufacturing facility is not a technology procurement exercise — it is a reliability strategy decision that directly determines how effectively unplanned downtime is prevented, maintenance budgets are spent, and production throughput is protected. With vibration analysis, thermography, oil analysis, ultrasonic testing, and motor current signature analysis each offering different detection capabilities for different failure modes, the risk of investing in the wrong technology or over-investing in capability that does not match the asset base is real and costly. iFactory AI's platform integrates multi-technology condition monitoring with predictive analytics, CMMS work order automation, and real-time asset health dashboards — enabling manufacturing teams to select, deploy, and scale the right monitoring strategy for every asset class without managing multiple disconnected systems.
Condition Monitoring Systems for Manufacturing: Selection Guide
Choose the best condition monitoring system for your facility with a structured framework covering vibration analysis, thermography, oil analysis, ultrasonic testing, motor current signature analysis, and how to match each technology to asset criticality for maximum reliability ROI.
Core monitoring technologies for comprehensive asset coverage
38%
Average reduction in unplanned downtime with integrated condition monitoring
3-9
Month payback period for well-targeted condition monitoring programs
80%
Of equipment failures preceded by measurable condition indicators
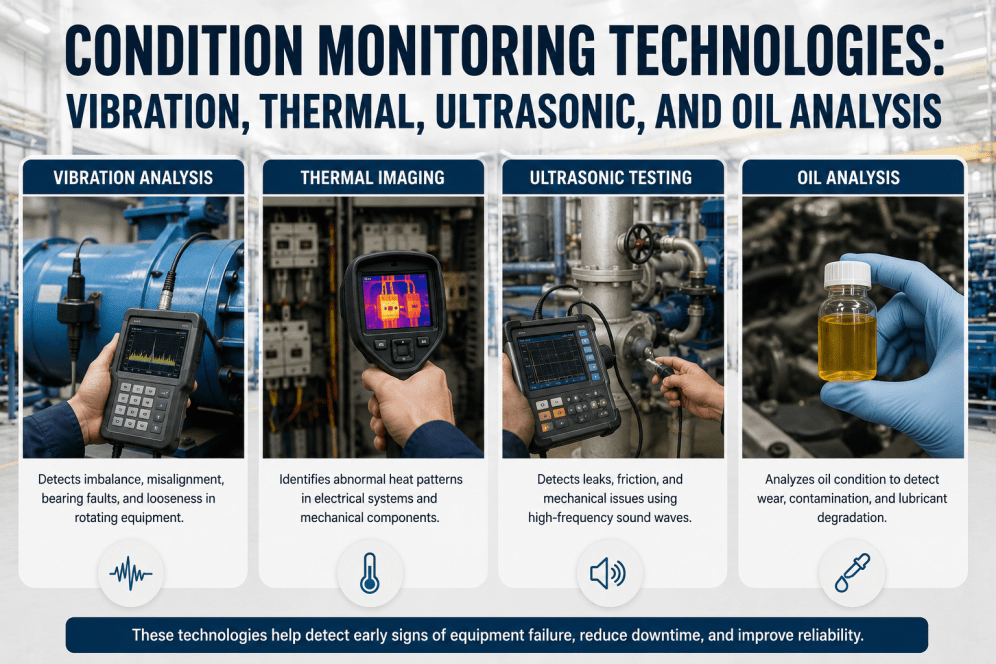
Understanding the Core Condition Monitoring Technologies
Six core technologies form the backbone of industrial condition monitoring. Each detects a distinct set of failure modes across different asset classes, and a well-designed program combines several of them rather than relying on a single method. Understanding what each technology detects, where it applies, and what its output looks like is the first step in building a monitoring strategy that matches the facility's actual failure risk profile rather than a generic off-the-shelf approach. iFactory's platform ingests data from all six technologies into a unified asset health dashboard, correlating readings across sensor types on the same asset to surface the earliest possible failure warning.
Best for: Pressure vessels, storage tanks, pipelines, welding inspection, composite materials, large structural welds
Output: Hit count vs. time, amplitude distribution, location mapping (2D/3D source triangulation), intensity trends
Selection Framework: Matching Technology to Asset Criticality
Not every asset needs every monitoring technology. Applying all six technologies across every machine drives unnecessary capital cost and creates data overload that buries actionable signals in noise. The selection framework below maps asset classes by operational criticality to the monitoring technologies that deliver the highest detection value for the investment — enabling reliability teams to allocate monitoring spend where it produces the fastest payback.
Asset Class
Recommended Technologies
Failure Modes Covered
Rationale
Est. Annual Cost
Critical continuous rotating Main air compressor, cooling tower pump, production line drive motor
Standard vibration sensors miss sub-60 RPM faults; ultrasound detects high-frequency emissions from slow-speed bearing distress
$5K–$10K per asset
Non-critical support General ventilation fan, small pump, light-duty conveyor
Periodic route-based vibration or ultrasound
General mechanical degradation, unexpected failure
Minimal investment; monitored on extended interval with handheld route collection rather than permanent sensors
$1K–$3K per asset
Step-by-Step Implementation Workflow
Deploying condition monitoring in a structured sequence prevents the most common failure mode of reliability programs — paralysis from too much data too fast. The workflow below moves from asset prioritization through technology deployment to closed-loop corrective action, with each phase building on the previous one so the program generates measurable value before expanding scope.
PHASE 1
Asset Criticality Ranking
Classify all monitored assets by operational criticality using a structured risk matrix that considers production impact of failure, repair cost, lead time for replacement parts, and safety/environmental consequences. Output is a ranked asset list with criticality scores that directly inform monitoring technology assignment and route frequency.
Typical duration: 2–3 weeks
PHASE 2
Technology Selection Per Class
Map each asset criticality tier to the appropriate monitoring technologies using the selection framework. For critical continuous assets, specify permanent online sensors with continuous data streaming. For intermittent and non-critical assets, define route-based data collection with portable instruments on a scheduled interval.
Typical duration: 1–2 weeks
PHASE 3
Sensor Installation & Route Definition
Install permanent sensors on critical assets at specified measurement points with correct mounting, orientation, and cabling. Define collection routes for portable instruments with measurement point locations, parameter settings, and frequency bands for each asset. Calibrate all sensors and verify data transmission to the monitoring platform.
Typical duration: 3–6 weeks
PHASE 4
Baseline Collection & Alarm Threshold Setting
Collect baseline data over a 30-day operating window to establish normal condition profiles for each measurement point. Set alarm thresholds using statistical methods — typically two standard deviations for warning and three for alarm — rather than default vendor settings. Validate thresholds against known failure histories.
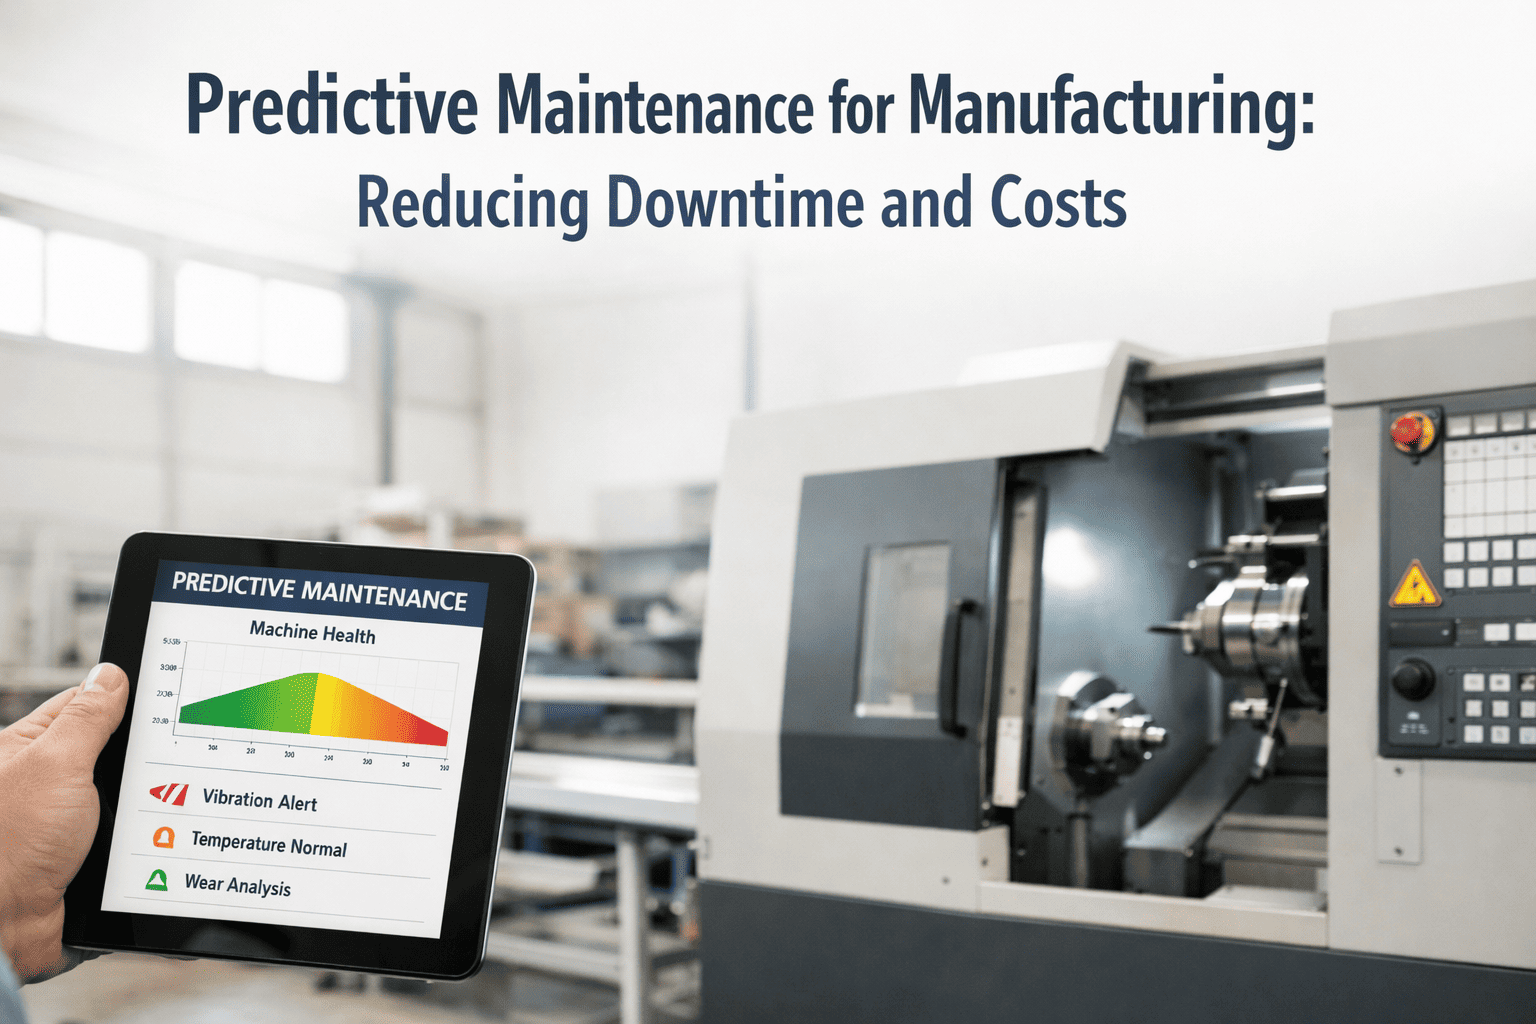
Begin continuous data collection and analysis with alerts routed to reliability engineers for diagnosis. Connect flagged anomalies directly to CMMS work order generation so that every detected fault triggers a documented corrective action. Track notification-to-resolution cycle time and asset health trend improvement as the program matures.
Ongoing — review threshold accuracy quarterly
Ready to Build Your Condition Monitoring Program?
iFactory AI's platform integrates all six condition monitoring technologies into a single asset health dashboard with automated alarm management, CMMS work order integration, and multi-technology correlation — so you deploy the right monitoring strategy for every asset class without managing six separate vendor systems.
Expert Review: What Industry Leaders Look for in a Condition Monitoring System
Practitioners who have deployed condition monitoring across large industrial asset bases consistently emphasize that technology capability matters far less than system integration and workflow automation when it comes to sustained program success. The evaluation criteria below reflects perspectives from reliability leaders at Fortune 500 manufacturing organizations who have implemented multi-technology condition monitoring programs at scale.
"After deploying multi-technology condition monitoring across 14 plants, the single biggest factor separating successful programs from shelfware was not the sensor technology — it was the platform's ability to turn raw data into a prioritized maintenance action list. Teams that had vibration spectra but no clear 'what to fix first' guidance saw adoption stall within six months. Teams whose system surfaced the top three anomalies each shift with a direct link to the CMMS work order system sustained the program and reduced unplanned downtime by an average of 38% within nine months."
Senior Director of Reliability EngineeringFortune 500 Automotive Manufacturing · 14-plant deployment program
Key Evaluation Criteria from Industry Practitioners
Data-to-Decision Latency
How fast does an anomaly become a work order? Systems that require manual spectrum analysis before flagging a fault introduce 2–5 day delays. The best platforms flag anomalies automatically and generate CMMS work orders within minutes.
Multi-Technology Fusion
Can the platform correlate vibration, temperature, oil, and current data on the same asset? Cross-technology correlation catches failure modes that no single sensor type can detect reliably in isolation.
Threshold Tuning Flexibility
Can reliability engineers adjust alarm thresholds themselves without vendor support? Static vendor defaults miss 40% of incipient faults. The platform should support statistical, adaptive, and rule-based threshold setting by in-house teams.
Integration Depth
Does the platform connect to the facility's CMMS, SCADA, PLC, and historian out of the box? Custom integration projects add 6–12 months and $50K–$200K to a condition monitoring deployment, often negating the ROI case entirely.
Conclusion: Building a Condition Monitoring Strategy That Pays
Selecting a condition monitoring system is not a technology purchase — it is a reliability strategy decision that determines how effectively the facility detects, diagnoses, and acts on equipment degradation across the entire asset base. The facilities that generate the highest ROI from condition monitoring share three characteristics: they match the monitoring technology to the asset class instead of applying a uniform approach, they connect the condition data directly to a CMMS workflow that drives corrective action rather than leaving alarms in a dashboard, and they prioritize platforms that turn raw signals into prioritized maintenance decisions instead of requiring reliability engineers to interpret spectra for every alert. iFactory AI's unified platform delivers all six condition monitoring technologies with automated alarm management, multi-technology data fusion, native CMMS integration, and scalable deployment from a single-asset pilot to a 1,000-asset enterprise program. Book a Demo to discuss your facility's condition monitoring requirements and see iFactory's platform configured for your asset base.
Deploy the Right Condition Monitoring Strategy for Every Asset Class.
iFactory AI provides the unified platform that integrates all six condition monitoring technologies with predictive analytics, CMMS work order automation, and real-time asset health dashboards — enabling manufacturing teams to select, deploy, and scale the right monitoring strategy with measurable reliability ROI.
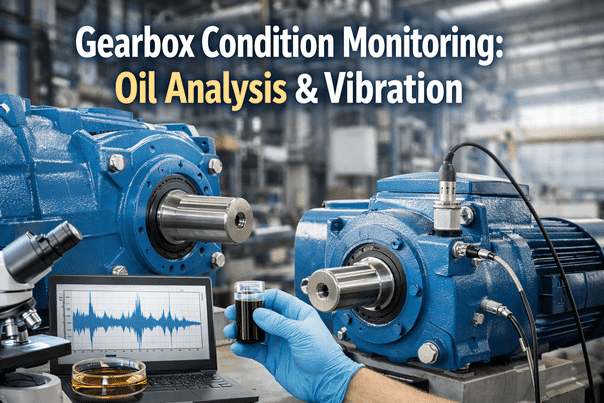
There is no single most important technology — the right monitoring approach depends on the asset class and dominant failure modes at each facility. Vibration analysis is the most widely deployed because it covers the broadest range of rotating equipment failure modes including imbalance, misalignment, bearing wear, and looseness. However, a facility with significant electrical distribution assets may find thermography more impactful, while a plant with extensive gearbox and hydraulic systems may prioritize oil analysis. The most effective programs combine two to three technologies matched to the asset criticality profile, using vibration as the baseline technology and supplementing with thermography for electrical assets, oil analysis for lubricated systems, and ultrasound for leak detection and slow-speed machinery.
Condition monitoring system costs vary widely based on the number of assets monitored, technology types deployed, sensor installation requirements, and software platform capability. A basic route-based program using handheld vibration and ultrasonic instruments for 50 assets typically costs $15,000 to $30,000 in initial equipment investment plus $5,000 to $10,000 annually in software and training. A comprehensive online system with permanent sensors across 200 assets covering vibration, temperature, and current monitoring typically ranges from $80,000 to $250,000 fully installed with a monthly or annual software subscription. For most manufacturing facilities, the payback period is three to nine months based on unplanned downtime reduction and maintenance cost avoidance alone, not counting extended asset life and secondary benefits like reduced energy consumption from optimally running equipment.
No — condition monitoring is designed to complement and optimize preventive maintenance, not replace it entirely. While condition-based maintenance (performing maintenance only when the monitored condition indicates need) can extend intervals for many preventive tasks, certain maintenance activities such as calibration, cleaning, filter replacement, and statutory inspections must still be performed on a scheduled basis regardless of condition. The most effective maintenance strategies use condition monitoring to convert fixed-interval preventive tasks to condition-based execution where possible (typically 40–60% of PM tasks can be condition-optimized), while retaining time-based PM for tasks where condition monitoring cannot predict the need. iFactory's platform supports both condition-based and time-based maintenance strategies within a single CMMS, enabling a smooth transition from calendar-driven to condition-driven maintenance as the monitoring program matures.
A structured condition monitoring implementation typically spans 10 to 20 weeks from asset ranking to fully operational continuous monitoring, depending on facility size and technology scope. The asset criticality ranking and technology selection phases take 3 to 5 weeks. Sensor installation, baseline data collection, and threshold setting take 6 to 12 weeks for a typical facility with 100 to 200 monitored assets. The remaining time covers training, alarm validation, and workflow integration with the CMMS. Route-based programs that use portable instruments rather than permanent sensors can be operational in 4 to 8 weeks because no installation work is required. iFactory's platform includes pre-built sensor configurations, automated threshold calculation using statistical baseline analysis, and native CMMS integration that reduces the implementation timeline by approximately 30% compared to assembling separate vendor systems with custom integration.
The requirement for in-house reliability engineering expertise depends on the complexity of the monitoring program and the sophistication of the platform. Basic route-based vibration and ultrasound programs with automated alarm analysis can be managed by trained maintenance technicians with one to two weeks of technology-specific training and access to the platform's diagnostic guidance. Advanced programs using multiple technologies with cross-correlation analysis, failure mode diagnosis, and root cause investigation benefit from at least one dedicated reliability engineer or a technician with a vibration analysis certification (Category II or higher). iFactory's platform reduces the expertise barrier by providing automated anomaly detection, severity ranking, and recommended corrective actions that guide less experienced personnel through the diagnosis process. The platform also supports remote reliability engineering support from iFactory's team for facilities that do not have in-house condition monitoring expertise during the program startup phase.