Condition monitoring has evolved from a periodic diagnostic activity into a continuous, sensor-driven discipline that defines how modern manufacturers protect equipment reliability and uptime. The four core technologies — vibration analysis, thermal imaging, ultrasonic testing, and oil analysis — each illuminate a different failure mechanism, and when combined into an integrated condition-based monitoring strategy, they detect 80–90% of mechanical and electrical faults months before catastrophic failure. For U.S. manufacturing professionals managing aging asset bases, rising labor costs, and shrinking maintenance windows, deploying the right mix of these technologies has become the single highest-leverage investment in plant reliability. Teams that book a demo with iFactory consistently uncover three to five critical assets where condition monitoring would have prevented the last unplanned outage.
Unify Vibration, Thermal, Ultrasonic, and Oil Data in One Predictive Platform
iFactory's AI-powered predictive analytics platform ingests every condition monitoring signal — turning raw sensor data into prioritized work orders and remaining-useful-life forecasts.
Why Condition Monitoring Is the Foundation of Modern Predictive Maintenance
Condition monitoring is the practice of measuring a defined physical parameter of an asset — vibration, temperature, acoustic emission, lubricant chemistry — and using changes in that parameter as the trigger for maintenance action. The shift from time-based preventive maintenance to condition-based monitoring (CBM) has redefined how reliability teams allocate capital and labor: rather than servicing equipment on a calendar, they intervene only when measurable evidence of degradation appears. This single change reduces maintenance labor by 25–35% and unplanned downtime by 40–50% in mature programs. The four technologies covered below each address a distinct failure mode, and a credible reliability program rarely relies on any one of them in isolation.
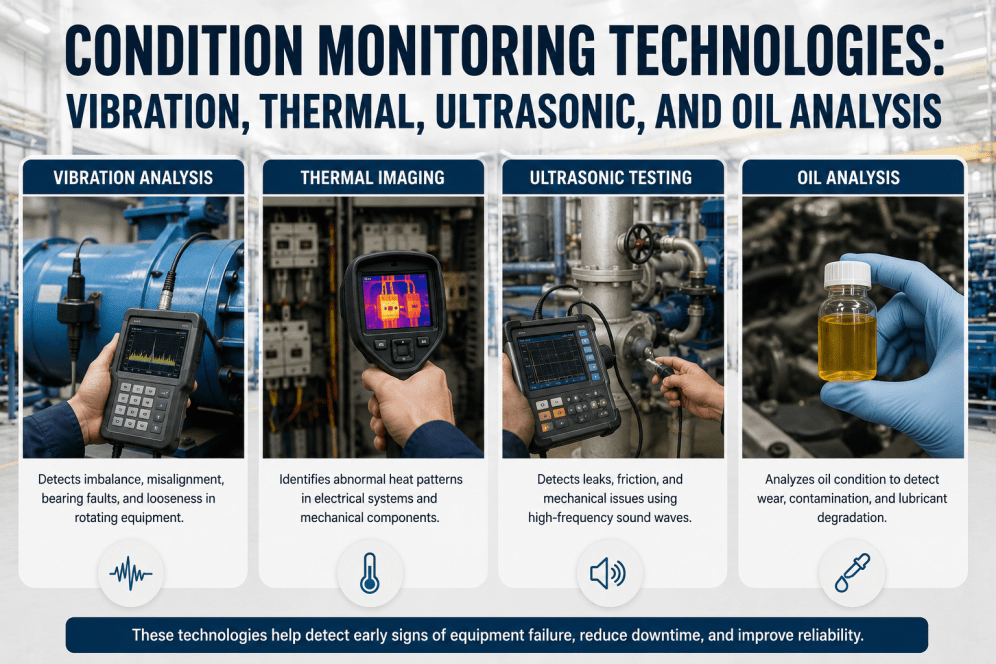
Vibration Analysis
Detects imbalance, misalignment, bearing wear, gear faults, and looseness in rotating equipment. The broadest-spectrum technique for mechanical fault detection.
Thermal Imaging
Identifies hot spots in electrical panels, motors, bearings, and steam traps. Non-contact, fast, and ideal for surveys of high-energy assets.
Ultrasonic Testing
Captures high-frequency emissions from friction, leaks, electrical arcing, and early-stage bearing defects — often the earliest detectable signal of failure.
Oil Analysis
Reveals wear particle metallurgy, lubricant degradation, and contamination. The only technique that diagnoses what is happening inside the bearing or gear contact zone.
Vibration Analysis: The Broadest-Spectrum Tool for Rotating Equipment Diagnostics
Vibration analysis is the workhorse of industrial condition monitoring — every rotating component, whether a bearing, gear, shaft, or coupling, generates a vibration signature that reflects its mechanical condition. When that signature changes, something is developing inside the machine. Modern triaxial accelerometers capture vibration across frequencies from 0 Hz to 64 kHz, and Fast Fourier Transform (FFT) processing converts time-domain waveforms into the frequency spectra where specific fault signatures become readable. A well-designed vibration program reliably catches imbalance, misalignment, looseness, bearing defects, gear mesh anomalies, and resonance — typically 60–90 days before functional failure. Plants that book a demo with iFactory routinely find that wireless vibration sensors pay back inside 9–12 months on critical rotating assets.
Sensor Capture
Triaxial accelerometers mounted at bearing housings record vibration amplitude across a defined frequency range, 24/7.
FFT Processing
Time-domain waveforms are converted to frequency spectra, exposing the characteristic peaks of bearing, gear, and shaft faults.
Baseline Compare
Live spectra are compared against known-good reference signatures captured under matching load and speed conditions.
Work Order
Confirmed anomalies trigger a prioritized work order with diagnosed fault type, severity, and recommended action.
Thermal Imaging, Ultrasonic Testing, and Oil Analysis: The Complementary Diagnostic Stack
Vibration alone does not see everything. Electrical faults, steam-system leaks, early lubrication problems, and contamination in oil films sit outside vibration's detection envelope — and this is where the complementary technologies earn their place in the program. Thermal imaging excels at non-contact electrical and mechanical inspection. Ultrasonic testing catches the highest-frequency emissions that precede measurable vibration change. Oil analysis is the only modality that quantifies what is happening at the metal-on-metal contact zone itself. The most effective reliability programs treat these as a layered detection stack — each technology covering the blind spots of the others.
Infrared Thermography Surveys
Handheld and fixed thermal cameras detect hot spots in electrical switchgear, motor windings, bearing housings, steam traps, and refractory linings. Loose electrical connections — the leading cause of arc-flash incidents — show up as clear thermal anomalies long before failure. Surveys are fast, non-contact, and require no equipment shutdown.
Airborne and Structure-Borne Ultrasound
Ultrasonic instruments capture emissions in the 20–100 kHz range generated by friction, turbulent flow, electrical corona, and partial discharge. Compressed air and steam leaks, valve passing, and very-early-stage bearing defects all produce ultrasonic signatures detectable months before vibration changes become measurable.
Lubricant and Wear Particle Analysis
Laboratory oil analysis quantifies viscosity, acid number, water content, particle count, and elemental wear metals via ICP spectroscopy. Analytical ferrography characterizes wear particle morphology, distinguishing benign rubbing wear from severe fatigue or abrasive wear. Oil tells you what the bearing is doing — not just that something is wrong.
Motor Circuit Analysis
Motor current signature analysis (MCSA) and offline electrical testing detect rotor bar damage, stator insulation degradation, and air-gap eccentricity that vibration cannot fully resolve. Electrical condition monitoring complements vibration on the largest motor populations in any plant.
Multi-Modal AI Fusion
Modern platforms ingest all four technology streams into a single asset health model, using AI to correlate signals across modalities. A bearing showing both elevated 1× shaft frequency vibration and rising iron content in oil is a far higher-confidence diagnosis than either signal alone.
Choosing the Right Condition Monitoring Technology for Each Asset Type
No single condition monitoring technology fits every asset. The table below maps the four core technologies to the failure modes they detect most reliably and the asset types where each delivers the highest reliability return. Sophisticated reliability programs assign primary and secondary monitoring modalities to each critical asset based on failure mode analysis, then layer in AI-driven anomaly detection across all streams. Teams that book a demo with iFactory receive a per-asset technology mapping during the initial program design workshop.
| Technology | Primary Failure Modes Detected | Best-Fit Assets | Typical Lead Time |
|---|---|---|---|
| Vibration Analysis | Imbalance, misalignment, bearing defects, gear wear, looseness, resonance | Motors, pumps, fans, gearboxes, compressors, turbines | 30–180 days |
| Thermal Imaging | Electrical hot spots, loose connections, bearing overheat, steam trap failure, refractory breakdown | Switchgear, MCCs, motors, steam systems, furnaces, transformers | 7–60 days |
| Ultrasonic Testing | Compressed air leaks, steam leaks, valve passing, early bearing wear, electrical partial discharge | Compressed air systems, steam traps, bearings, switchgear, valves | 60–270 days |
| Oil Analysis | Wear particle generation, lubricant degradation, water and particulate contamination, additive depletion | Gearboxes, turbines, hydraulic systems, large engines, compressors | 30–365 days |
| Motor Circuit Analysis | Rotor bar damage, stator insulation degradation, air-gap eccentricity | Medium and large AC induction motors | 60–180 days |
Stop Running Four Disconnected Monitoring Programs — Unify Them in One Platform
iFactory ingests vibration, thermal, ultrasonic, oil, and motor circuit data into a single AI-powered reliability layer with automated work order generation.
Expert Review: What Separates a Mature Condition Monitoring Program from a Sensor Project
The most consistent observation across hundreds of U.S. plant reliability assessments is that the technology is rarely the limiting factor — program discipline is. Plants frequently install vibration sensors, thermal cameras, or oil sampling routines without the underlying criticality analysis, alarm thresholds, work-order integration, and corrective-action loop that turn data into reliability gain. The result is a wall of dashboards that nobody acts on. A mature program is defined by four characteristics that have nothing to do with which sensor brand was purchased.
Criticality-Driven Coverage
Assets are tiered by production and safety impact, and monitoring intensity matches the tier. Continuous online monitoring is reserved for top-criticality assets; mid-tier equipment gets walkaround routes; low-tier assets get reactive coverage.
Closed-Loop Workflow
Every alarm produces a work order, every work order produces a completion record, and every completion record updates the asset health baseline. Without this closed loop, the program degrades within 18 months.
Trend-Based Alarming
Absolute threshold alarms produce noise. Mature programs alarm on rate-of-change against an asset's own historical baseline, dramatically reducing false positives and elevating diagnostic confidence.
Analyst Skill Depth
Sensors generate data; analysts produce diagnoses. The programs that sustain results invest in ISO-certified vibration analysts, thermographers, and lubrication technicians — and increasingly use AI to amplify their reach.
Conclusion: Condition Monitoring Technologies Are Most Powerful When They Talk to Each Other
Vibration, thermal, ultrasonic, and oil analysis each capture a real and distinct view of asset health — and each has well-understood blind spots. The reliability programs that consistently deliver double-digit OEE improvement, single-digit unplanned downtime percentages, and measurable maintenance cost reduction are the ones that treat these technologies as a coordinated detection stack rather than four independent projects. The integration layer is where modern AI-powered platforms create value: correlating a rising 2× line-frequency vibration peak with elevated copper in oil analysis with a thermal hot spot at the motor end-bracket produces a high-confidence diagnosis that any single technology would have surfaced only as ambiguous noise. U.S. manufacturers that build this integrated capability today position themselves to absorb the next decade of workforce turnover and capacity expansion without proportional growth in maintenance spend. To start mapping your condition monitoring technology stack, book a demo with iFactory and walk through your top ten critical assets with our reliability engineering team.
Condition Monitoring Technologies: Frequently Asked Questions
Which condition monitoring technology should we deploy first?
Most U.S. manufacturers start with vibration analysis on critical rotating equipment because it covers the broadest range of mechanical failure modes and produces the clearest financial case. Thermal imaging is typically the second deployment, focused on electrical infrastructure. Ultrasonic and oil analysis usually follow as the program matures and asset criticality data clarifies where the marginal return is highest.
How early can these technologies detect a developing failure?
Lead times vary by technology and failure mode. Ultrasonic monitoring often detects bearing wear 6–9 months before failure, oil analysis 3–12 months, vibration analysis 1–6 months, and thermal imaging typically 1–2 months. Combining technologies extends the effective detection window and dramatically improves diagnostic confidence.
Do we need continuous online monitoring, or are walkaround routes enough?
It depends on asset criticality. Top-tier assets — those that shut a line or violate a safety standard when they fail — justify continuous wireless monitoring. Mid-tier assets are well covered by monthly or quarterly walkaround routes. Low-tier equipment can usually run to failure economically. A criticality analysis should drive the deployment decision rather than a single uniform standard.
How does AI improve traditional condition monitoring?
AI extends condition monitoring in three ways. It learns each asset's normal operating signature and alarms on deviation rather than fixed thresholds. It correlates signals across vibration, thermal, ultrasonic, and oil streams for multi-modal diagnosis. And it forecasts remaining useful life, allowing maintenance to be scheduled into planned windows rather than reacting to alarms. iFactory's AI-powered predictive analytics performs all three.
What ROI should we expect from a condition monitoring program?
Mature condition monitoring programs in U.S. manufacturing typically return 3–10× the program investment within the first 18–24 months, driven by unplanned downtime reduction, extended asset life, lower spare parts consumption, and reduced overtime. The largest single contributor is usually the avoidance of one or two catastrophic failures per year on critical production equipment.
Build a Condition Monitoring Program That Pays Back Inside Two Years
iFactory's AI-powered predictive analytics platform unifies every condition monitoring technology into a single reliability layer — turning sensor data into prioritized work orders, RUL forecasts, and measurable OEE gain.