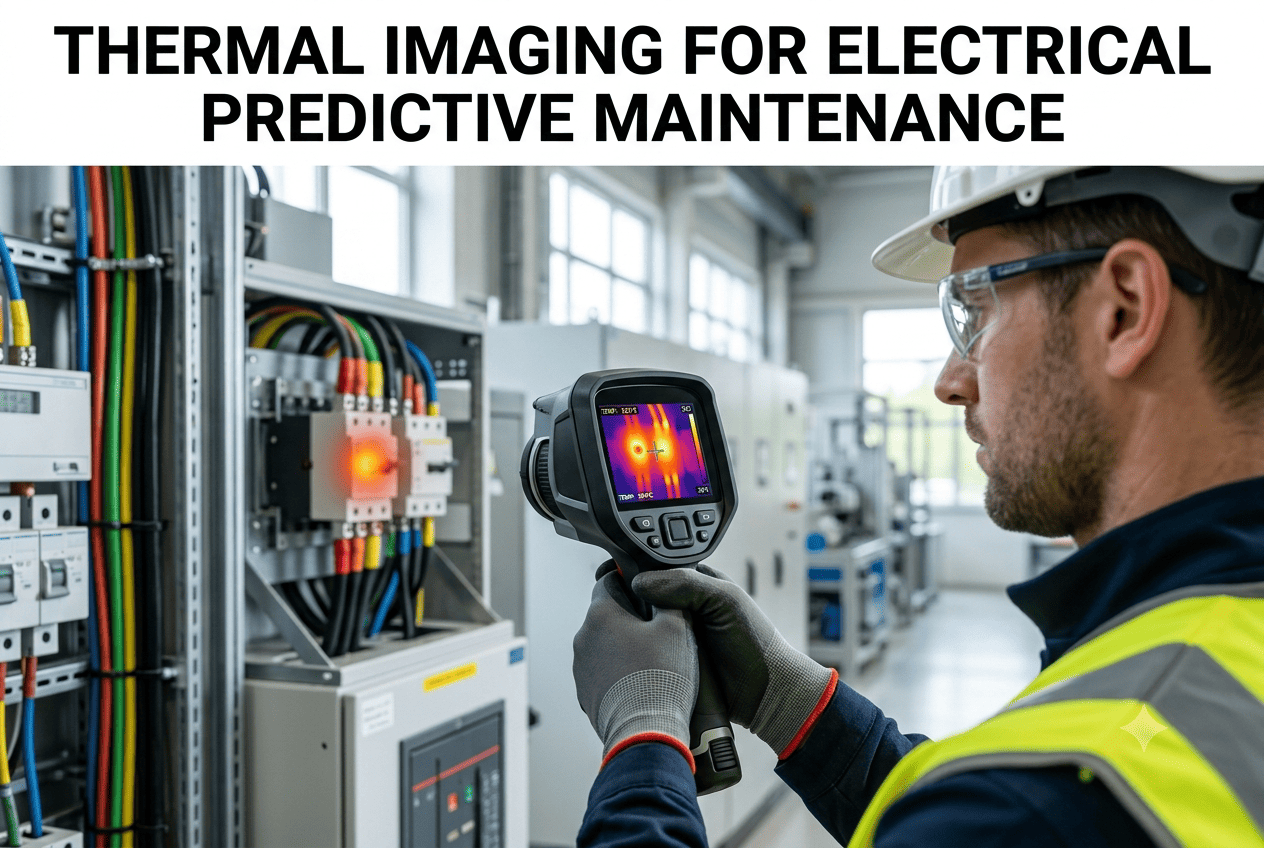
Every electrical fault your plant will ever have generates heat before it generates a failure. A loose lug at a terminal block, a phase imbalance in a motor control center, a degrading breaker connection — all of it shows up on an infrared camera weeks before it shows up as a tripped line or a fire. The real problem isn't that thermal imaging fails to catch these faults, it's that most plants only point a camera at their electrical gear once or twice a year. Reliability engineers moving to continuous, AI-monitored thermal scanning routinely catch faults an annual survey would have missed entirely. See what your own switchgear looks like under continuous monitoring when you book a demo.
The Hotspot That Never Made the Annual IR Survey Is the One That Takes Down Your Line
Electrical faults produce a heat signature 30 to 90 days before they cause a failure. iFactory's AI-driven thermal monitoring catches that signature continuously, turning invisible degradation into a prioritized work order before anyone smells smoke.
How Long Before Failure Does a Hotspot Actually Give You?
Different electrical faults produce heat at different rates, but nearly all of them give a measurable warning window that an annual or quarterly inspection is too infrequent to catch reliably.
A once-a-year thermography walkdown will catch a bearing that's been drifting for six months, but it has almost no chance of catching a loose termination that develops and escalates inside an eight-week window between surveys.
What Changes When Thermal Monitoring Stops Being an Annual Event
The camera technology isn't the differentiator anymore — the difference is whether a human is walking the plant with a handheld unit twice a year, or an AI model is comparing every panel against its own baseline every day.
| Capability | Handheld Annual Survey | AI Continuous Monitoring |
|---|---|---|
| Inspection frequency | 1-2 times per year | Continuous, 24/7 |
| Detection window | Depends on survey timing luck | Flagged within days of onset |
| Baseline comparison | Relies on inspector memory | Learned per-component baseline |
| Work order generation | Manual, after report review | Automatic, pre-filled with image and severity |
| False alarm handling | Inspector judgment call | Calibrated thresholds, sub-2% false alarm rate |
Your Last IR Survey Already Missed Something
The first 90 days of an AI thermal deployment typically surface 15 to 25 hotspots that previous handheld surveys never caught. Find out what's already heating up in your panels.
Five Places Electrical Heat Builds Before Anyone Notices
These five locations account for the overwhelming majority of thermally detectable electrical faults across manufacturing and process plants.
Switchgear & Breakers
Asymmetric heating at contact points signals developing resistance long before a trip event occurs.
Motor Control Centers
Localized hotspots on power components typically appear 14 to 45 days before the component actually fails.
Busbars & Terminal Blocks
Increased resistance at a connection generates heat before any measurable drop in electrical performance.
Transformer Bushings
Oil degradation and bushing contamination create thermal gradients detectable 60 or more days out.
Motor Windings
Phase-to-phase imbalance under otherwise balanced load is an early sign of a developing turn-to-turn short.
How a Heat Signature Becomes a Prioritized Repair
Continuous Scan
Fixed or on-device cameras capture thermal frames of monitored panels and components around the clock.
Baseline Comparison
Each frame is compared against a learned healthy signature for that specific component, not a generic threshold.
Severity Classification
Deviations are graded by delta-T, rate of change, and component criticality against recognized reliability standards.
Automated Work Order
A classified fault writes directly into your CMMS with image, location, and recommended corrective action attached.
What Plants Report After Moving to AI Thermal Monitoring
What a Missed Electrical Fault Actually Costs
Electrical failures don't just cause downtime, they cause the most expensive kind of downtime, because a fault caught reactively almost always costs more to fix than the same fault caught early would have.
One facility discovered this the hard way after spending $2.1 million on reactive electrical repairs in a single quarter, only to realize afterward that its existing inspection methods had given no warning at all of the overheating connections behind the failures. The heat was there weeks earlier. Nobody was watching for it continuously.
Questions Reliability Engineers Ask About Thermal AI
Stop Waiting for the Next Scheduled IR Survey
Electrical faults don't wait for your inspection calendar. See how continuous, AI-driven thermal monitoring catches hotspots weeks before they become work stoppages.