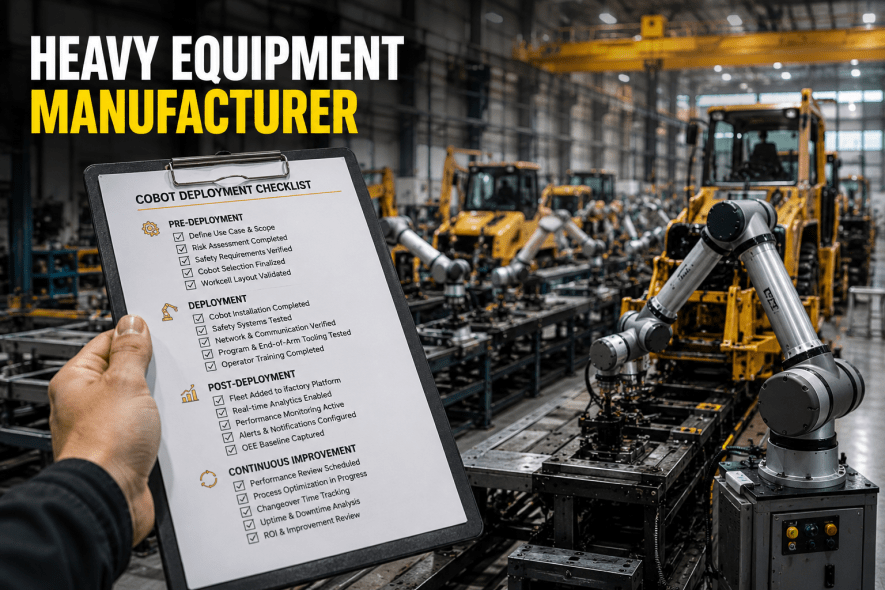
Manufacturing floors are no longer the exclusive domain of fixed, caged industrial robots. Collaborative robots — cobots — are working shoulder-to-shoulder with human operators, handling tasks from precision assembly to quality inspection. But as cobot adoption accelerates across U.S. plants, a critical gap is emerging: most facilities lack the analytics infrastructure to extract full value from these machines. Without visibility into uptime patterns, cycle efficiency, and integration performance, cobots become expensive underperformers rather than the productivity multipliers they promise to be. Book a free demo to see how iFactory AI closes this gap →
What Makes Cobots Different from Traditional Industrial Robots
Traditional industrial robots are built for speed, repeatability, and isolation. They execute fixed programs inside safety cages, with zero tolerance for human proximity during operation. Cobots flip this model entirely. Designed with force-limiting joints, proximity sensing, and lightweight construction, cobots can operate in shared spaces with human workers, stop automatically when contact is detected, and be reprogrammed rapidly for different tasks without specialized robotics engineers.
This flexibility makes cobots attractive for small-to-mid-size manufacturers who cannot justify the floor space, safety infrastructure, or changeover rigidity of traditional automation. A cobot can handle palletizing in the morning and switch to quality inspection in the afternoon. That operational agility is exactly why cobot fleets are growing across automotive, electronics, food processing, and pharmaceutical manufacturing — and exactly why analytics designed for static robots fail to serve them.
| Dimension | Traditional Industrial Robot | Collaborative Robot (Cobot) |
|---|---|---|
| Safety Requirements | Safety cages, light curtains, full isolation | Force-limiting joints, shared floor space, no cage needed |
| Programming | Specialist-only, fixed programs, high changeover cost | Hand-guided teaching, operator-reprogrammable, fast changeover |
| Payload Capacity | High payload (50–500 kg typical) | Lower payload (3–35 kg typical) |
| Deployment Timeline | Months of integration, facility modification | Days to weeks, minimal infrastructure change |
| Analytics Complexity | Single-task performance, predictable data patterns | Multi-task tracking, dynamic baselines, human interaction events |
| Ideal Application | High-volume, single-task, large payload, fixed layout | Mixed-volume, multi-task, small-medium payload, flexible layout |
The Core Analytics Cobots Require for Peak Uptime
Cobot analytics differ fundamentally from traditional machine monitoring. Because cobots switch tasks, interact with humans, and operate across variable production schedules, the data required to maintain peak uptime is richer and more contextual than simple cycle count tracking. Here are the six analytics categories that determine whether a cobot fleet performs or underperforms. Schedule a demo to see all six dashboards live →
Measures what percentage of available shift time each cobot is actively running versus idle, waiting, or in pause states. Cobots with below 65% utilization typically indicate upstream feeding issues, task queue misalignment, or programming inefficiencies. Utilization data segmented by task type reveals which applications extract the most cobot value.
Actual cycle time compared against programmed target time per operation. Drift above target indicates joint wear, grip calibration issues, or process condition changes. Tracking this trend by cobot unit and by task type enables predictive maintenance scheduling before cycle degradation affects output quality or throughput.
Every cobot safety stop — whether triggered by human contact, force limit breach, or zone intrusion — should be logged with timestamp, location, and contributing context. High stop frequency on specific tasks signals ergonomic workflow design issues. Patterns across shifts reveal whether certain operators or cell configurations generate more interference events, pointing to layout improvements.
One of the cobot's key advantages is fast task changeover — but without measurement, this advantage is invisible. Tracking the time from last cycle of one task to first productive cycle of the next quantifies changeover efficiency. Benchmarking changeover times by operator and by task pair identifies training gaps and opportunities to standardize switching procedures.
See changeover analytics in a live demo →Cobot joints transmit torque data continuously. Trending joint load over time against manufacturer specifications predicts bearing wear and motor fatigue before failure occurs. This is the backbone of cobot predictive maintenance: catching the gradual degradation pattern weeks before a joint failure causes unplanned downtime and potential product quality issues.
Cobot OEE — combining availability, performance rate, and quality rate — only becomes actionable when linked to the broader production line's OEE data. A cobot operating at 95% availability but feeding a bottlenecked downstream station delivers no throughput gain. Integrated OEE visibility shows where cobot performance intersects with line-level constraints.
How Cobots Improve OEE — And Where Analytics Close the Gap
Overall Equipment Effectiveness (OEE) is the standard metric for manufacturing productivity, combining availability, performance, and quality. Cobots improve all three components — but only when analytics are in place to measure and sustain those gains over time. Without measurement, improvement is assumed rather than proven, and degradation goes undetected until output numbers slip. Request a demo of iFactory AI's OEE dashboard →
The critical insight most facilities miss: cobot OEE cannot be evaluated in isolation from line OEE. A cobot cell operating at 95% performance rate while feeding a downstream manual station running at 60% capacity delivers no net throughput advantage. Integrated analytics that connect cobot performance data to production line flow metrics reveal where the actual constraint lives — and where investment will generate the greatest return.
Cobot Integration Challenges That Analytics Expose
Deploying a cobot is straightforward. Sustaining its performance across a dynamic manufacturing environment is harder. The integration challenges that erode cobot ROI over time are rarely dramatic failures — they are slow, invisible degradations that only analytics detect before they become costly. Manufacturers who invest in real-time cobot monitoring identify these patterns weeks earlier than those relying on manual observation or periodic maintenance schedules.
Building a Cobot Analytics Implementation Roadmap
Implementing cobot analytics does not require ripping out existing systems or hiring a data science team. The most effective approach integrates with existing cobot controllers, SCADA platforms, and MES data flows to build a unified performance picture. The roadmap below reflects the deployment sequence used by manufacturers who achieve measurable OEE gains within 60–90 days of implementation. Facilities that schedule an analytics assessment early consistently accelerate this timeline by identifying integration points before the implementation phase begins.
Week 1–2
Week 2–4
Week 4–6
Week 6–8
Month 3+
Expert Perspective: What Separates High-Performing Cobot Fleets
Manufacturing automation specialists consistently identify a common pattern among facilities that extract the highest ROI from cobot investments: they treat the data layer as a first-class component of the cobot system, not an afterthought. Plants that instrument their cobots from deployment day one establish performance baselines that make degradation immediately visible. Those that deploy analytics six or twelve months after the cobots are installed spend the first phase of implementation reconstructing what normal looks like — which delays the point at which analytics generate actionable guidance.
A second observation from implementation experience across automotive, electronics, and food processing facilities: cobot ROI is most frequently eroded not by equipment failure but by process drift. Operators modify workstation layouts. Product changeovers introduce new fixture configurations. Upstream feed rates change. None of these changes are individually dramatic, but each one shifts the operating context the cobot was programmed for — and without analytics, the cumulative performance impact is invisible until output numbers force an investigation.
The facilities that sustain cobot performance over three-to-five year horizons share one characteristic: they have a continuous feedback loop between cobot performance data and process engineering decisions. Analytics is that feedback loop.
Conclusion: Cobots Perform to the Depth of Their Analytics
Collaborative robots are reshaping what manufacturing automation looks like — more accessible, more flexible, and more integrated with human work than the industrial robots of previous decades. But the productivity promise cobots carry depends entirely on the visibility layer supporting them. Utilization data, cycle time benchmarking, stop event logging, changeover analysis, and joint health trending are not optional reporting exercises. They are the operational intelligence that separates a cobot fleet generating consistent returns from one quietly underperforming for months before anyone quantifies the gap.
The manufacturers winning with cobot automation are not necessarily the ones with the newest or most expensive equipment. They are the ones who know what their cobots are doing, when they are drifting, and where the next maintenance action should be scheduled — because their analytics tell them, continuously and automatically. That is the competitive foundation cobot analytics builds. See it live — book your free iFactory AI demo today →

.png)