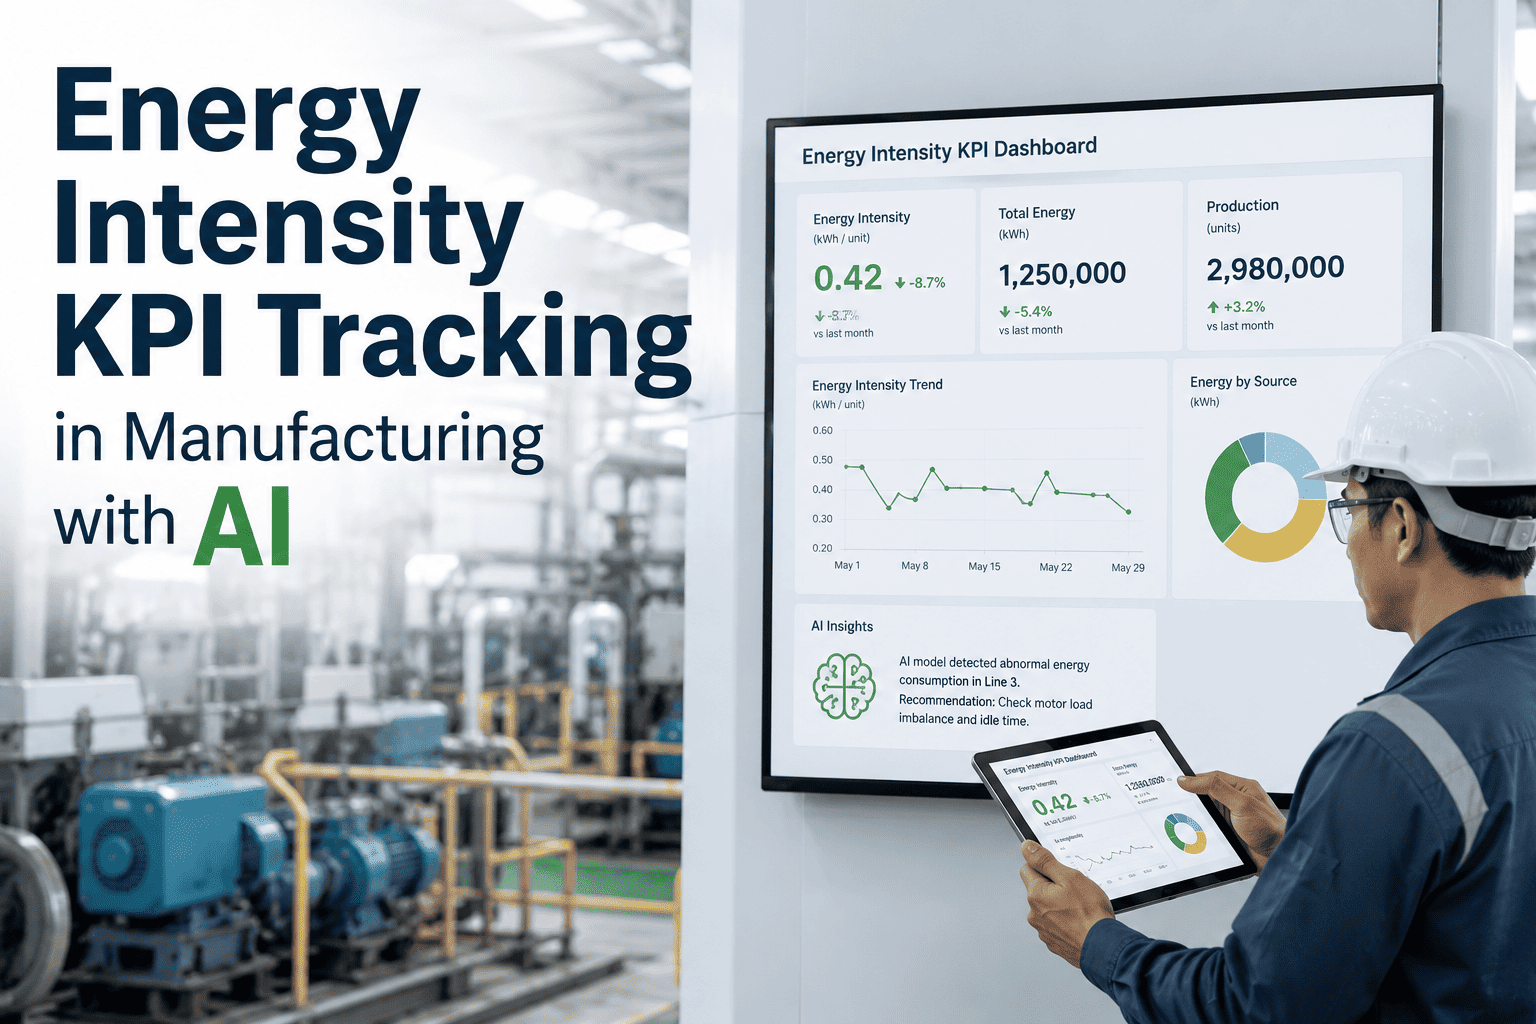
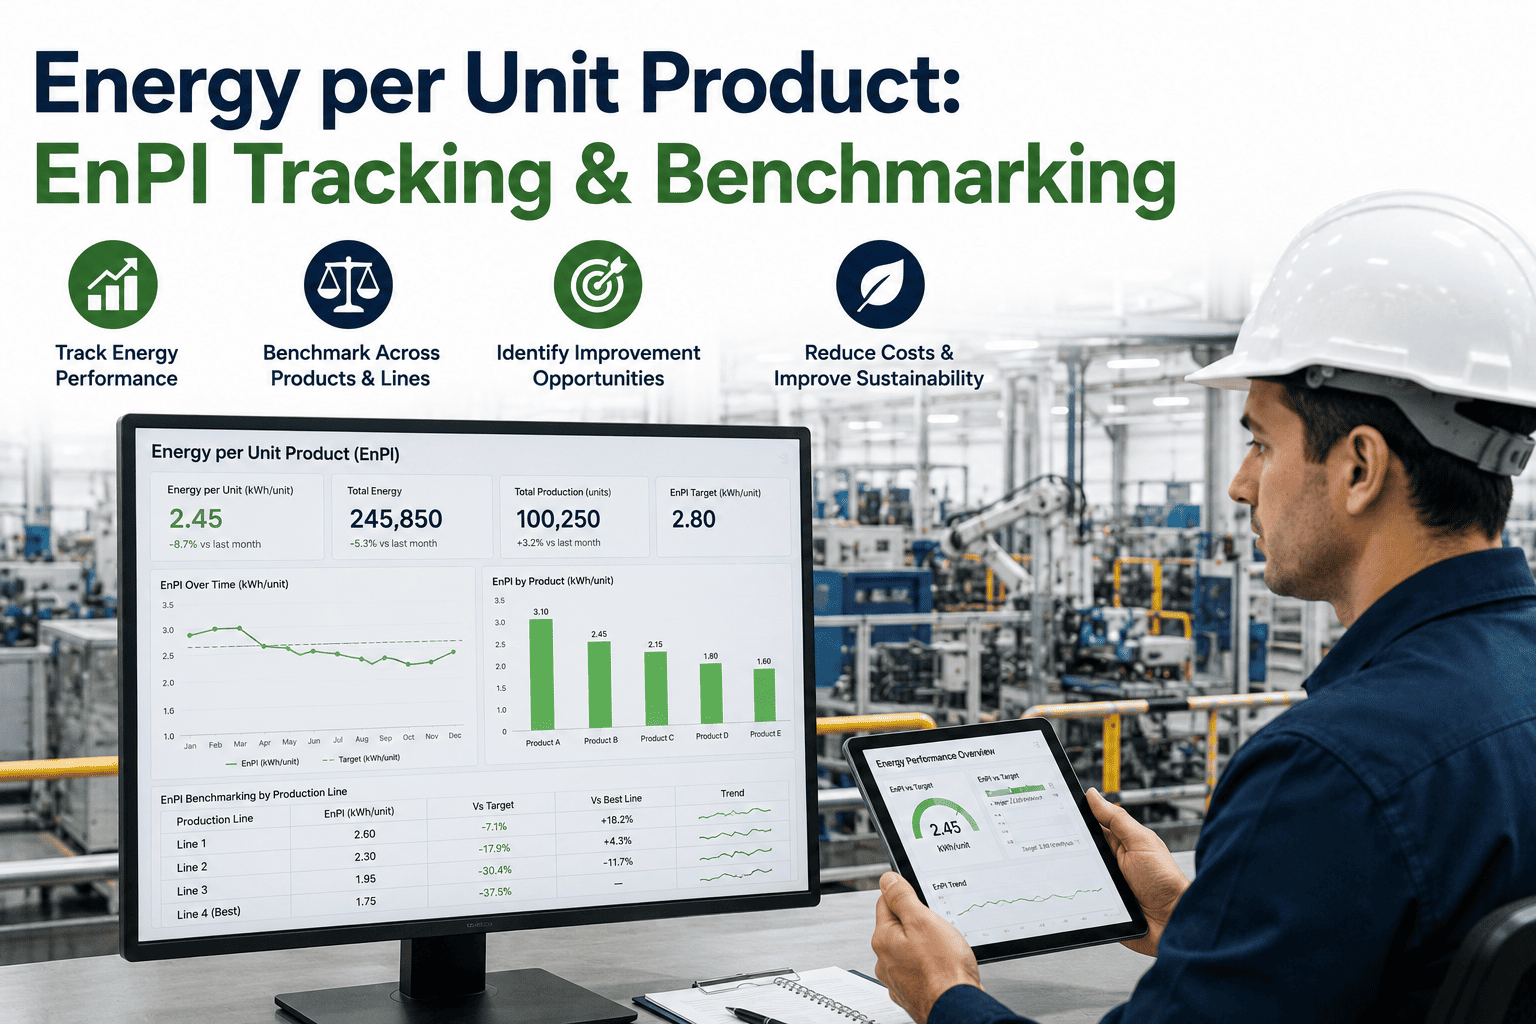
Energy managers usually have one number they report every month: kilowatt-hours per unit produced. It sounds like a clean, honest measure of efficiency, but a single raw energy intensity number hides more than it reveals. The same plant can show energy intensity climbing in a colder month, dropping when a high-volume product runs more shifts, and swinging for reasons that have nothing to do with how efficiently the equipment actually ran. Compare that number across two plants making a different product mix and the comparison becomes close to meaningless. Energy managers end up explaining away the swings in a monthly report instead of using the number to drive action. iFactory's AI platform normalizes energy intensity for production mix, capacity utilization, and weather automatically, and you can book a demo to see your own raw energy data turned into a KPI that actually holds still long enough to manage against.
ENERGY & DECARBONIZATION · ENERGY INTENSITY KPI · AI NORMALIZATION
Your kWh-Per-Unit Number Is Probably Lying to You Every Month
Raw energy intensity moves with product mix, capacity utilization, and weather just as much as it moves with actual efficiency. iFactory's AI platform separates the two so the number you report is the number worth acting on.
Raw kWh Per Unit
AI-Normalized kWh Per Unit
The raw number jumps around with mix and weather. The normalized number shows the trend that is actually worth managing.
WHY ONE NUMBER FAILS
Three Things That Move Energy Intensity Without Touching Efficiency
Energy intensity is a ratio: total energy divided by units produced. Anything that shifts the denominator without changing how efficiently the equipment ran will move the ratio too, and none of the three factors below have anything to do with wasted energy.
Capacity Utilization
A line running at 60% of nameplate capacity carries the same idle, startup, and standby energy load across fewer units, inflating energy intensity even though nothing on the line got less efficient. The equipment simply spent a larger share of its energy budget on periods when it was not actually producing.
Product Mix
A plant that makes both a high-energy and a low-energy product will show a worse intensity number in any month the high-energy product takes a larger share of the schedule, regardless of how well either product line actually performed on its own.
Weather and Seasonality
Heating and cooling load swings with outdoor temperature, and comparing a January number to a July number without adjusting for degree days compares two different problems as if they were one, making a perfectly efficient winter month look worse than a mediocre summer one.
INDUSTRY BENCHMARKS
What a Reasonable kWh-Per-Unit Number Looks Like by Industry
Energy intensity is only meaningful in context, and that context is different for every industry, every process, and often every product line within the same plant. The ranges below reflect typical energy intensity bands reported across manufacturing sectors, useful as a starting reference before you build a plant-specific baseline from your own equipment and product mix.
HOW NORMALIZATION WORKS
Turning a Noisy Ratio Into a KPI You Can Actually Manage
Normalization does not change what actually happened on the plant floor. It separates the part of the number caused by mix, load, and weather from the part caused by genuine efficiency, so the trend you act on is the real one.
STEP ONE
Establish a Plant-Specific Baseline
Historical energy and production data is regressed against capacity utilization, product mix, and degree days to establish what energy intensity should look like under normal conditions for that specific plant, not a generic industry average.
STEP TWO
Adjust Every New Reading Against It
Each new period's raw energy intensity is compared against the baseline-predicted value for that period's actual mix, load, and weather, isolating the efficiency component from everything the plant could not control.
STEP THREE
Surface a Clean Trend Line
The normalized trend is what shows up on the dashboard, so a real efficiency improvement or degradation is visible immediately instead of buried inside next month's product mix or weather swing.
Stop Explaining Away Your Energy Number and Start Managing It
iFactory's AI platform builds a plant-specific normalization baseline from your own historical data, so every energy intensity reading going forward reflects efficiency instead of noise.
WHAT IT'S WORTH
The Money Behind a Small Move in Energy Intensity
Because energy intensity scales with total production volume, even a modest percentage improvement translates into a meaningful dollar figure once it is applied across a full year of output.
10%
Intensity Reduction Can Mean $180K-$400K a Year
A plant moving energy intensity from 1,000 to 900 kWh per unit typically sees annual savings in this range, depending on electricity cost and total production volume across the site.
25%
Reduction Achieved in a Documented Beverage Plant
A documented case brought energy intensity down to roughly 0.9 kWh per liter, saving approximately $200,000 a year in energy costs after sub-metering and process changes were implemented.
2-5%
Typical Annual Efficiency Target for Manufacturers
This is the range most manufacturing energy programs target year over year, a goal that is much harder to track honestly without a normalized KPI that separates real gains from noise.
1
Comparable Number Across Every Plant in the Portfolio
Normalized energy intensity gives multi-site energy managers one apples-to-apples figure to benchmark plants against each other regardless of local product mix, climate, or capacity utilization patterns.
ON THE DASHBOARD
What an Energy Manager Actually Sees Day to Day
The goal is a live number that survives a second look, not a static report that gets rebuilt every month. These are the core views energy managers use most once normalization is running.
Live Plant-Level Trend
Normalized energy intensity updates continuously by shift and by day, so a real efficiency shift is visible well before the end-of-month report gets compiled and reviewed.
Cross-Plant Benchmarking
Every site reports on the same normalized basis, so a multi-site energy manager can rank plants fairly even when their product mixes and climates differ significantly from one another.
Automatic Variance Alerts
When normalized intensity drifts outside its expected band, the platform flags it immediately instead of waiting for a quarterly review to notice a pattern that started weeks earlier.
Audit-Ready Methodology
The normalization model and its inputs are documented and versioned, so the number reported to finance or included in an ESG disclosure can be explained and defended consistently to an outside reviewer.
FREQUENTLY ASKED QUESTIONS
Questions Energy Managers Ask About Normalized KPI Tracking
How is this different from a simple degree-day adjustment we already do?
A degree-day adjustment only accounts for weather, while iFactory's model normalizes for product mix and capacity utilization at the same time, using a regression baseline built from your own historical data rather than a generic industry formula that may not reflect your specific process.
Book a demo to see the normalization model built against your plant's actual history.
Do we need new metering hardware to get started?
Most plants already have the utility meters and production counts needed to build an initial baseline. iFactory's deployment team reviews your existing data sources during onboarding and recommends additional sub-metering only where it would materially improve accuracy of the resulting model.
Contact our support team for a metering readiness review.
Can this normalized number be used in our official ESG or CSRD disclosure?
Yes, the normalization methodology is documented and versioned specifically so it can support external reporting and withstand assurance review, and many customers use the same normalized energy intensity figure in both internal dashboards and regulatory disclosures without maintaining two separate calculations.
Book a demo to see how the methodology documentation is structured.
How does benchmarking work when our plants make completely different products?
The normalization model is built per plant against that plant's own product mix and history, then expressed on a common index so plants with entirely different outputs can still be ranked fairly on how efficiently each one runs relative to its own baseline rather than to an unrelated site.
Contact our support team to discuss benchmarking across a mixed product portfolio.
How quickly will we see a reliable normalized baseline?
A meaningful baseline typically requires twelve to eighteen months of historical energy and production data to capture a full seasonal cycle, though the platform starts producing directionally useful normalized figures as soon as it is connected to your first data sources.
Book a demo to find out what baseline quality is achievable with your available history.
Get an Energy Intensity Number Worth Putting in Front of Leadership
iFactory's AI platform separates real efficiency gains from mix, load, and weather noise so your monthly energy report tells the truth. Book a demo to see it running against your plant's own data.