Manufacturing plants consume 25 to 40 percent of total facility energy across HVAC, compressed air, lighting, and production equipment operating continuously across shifts. Yet most plants track energy consumption only at the utility meter level, receiving monthly billing data with zero visibility into which equipment consumes what percentage of total energy, where waste occurs, or which operational decisions drive demand spikes. Production lines run inefficiently during startup cycles, compressed air leaks go undetected for months, motors operate under partial load without throttling adjustments, and HVAC systems heat and cool simultaneously because equipment operates independently from energy awareness. The cost compounds: a typical mid-size manufacturing facility wastes 15 to 25 percent of energy through undetected inefficiency, equivalent to $120,000 to $300,000 in annual unnecessary costs. Energy monitoring through submetering delivers machine-level visibility into consumption patterns, enabling targeted interventions that reduce energy costs by 12 to 18 percent without capital equipment replacement. Most plants achieve ROI within 12 to 18 months through identified efficiency improvements alone. Book a demo to see machine-level energy monitoring deployed at your facility.
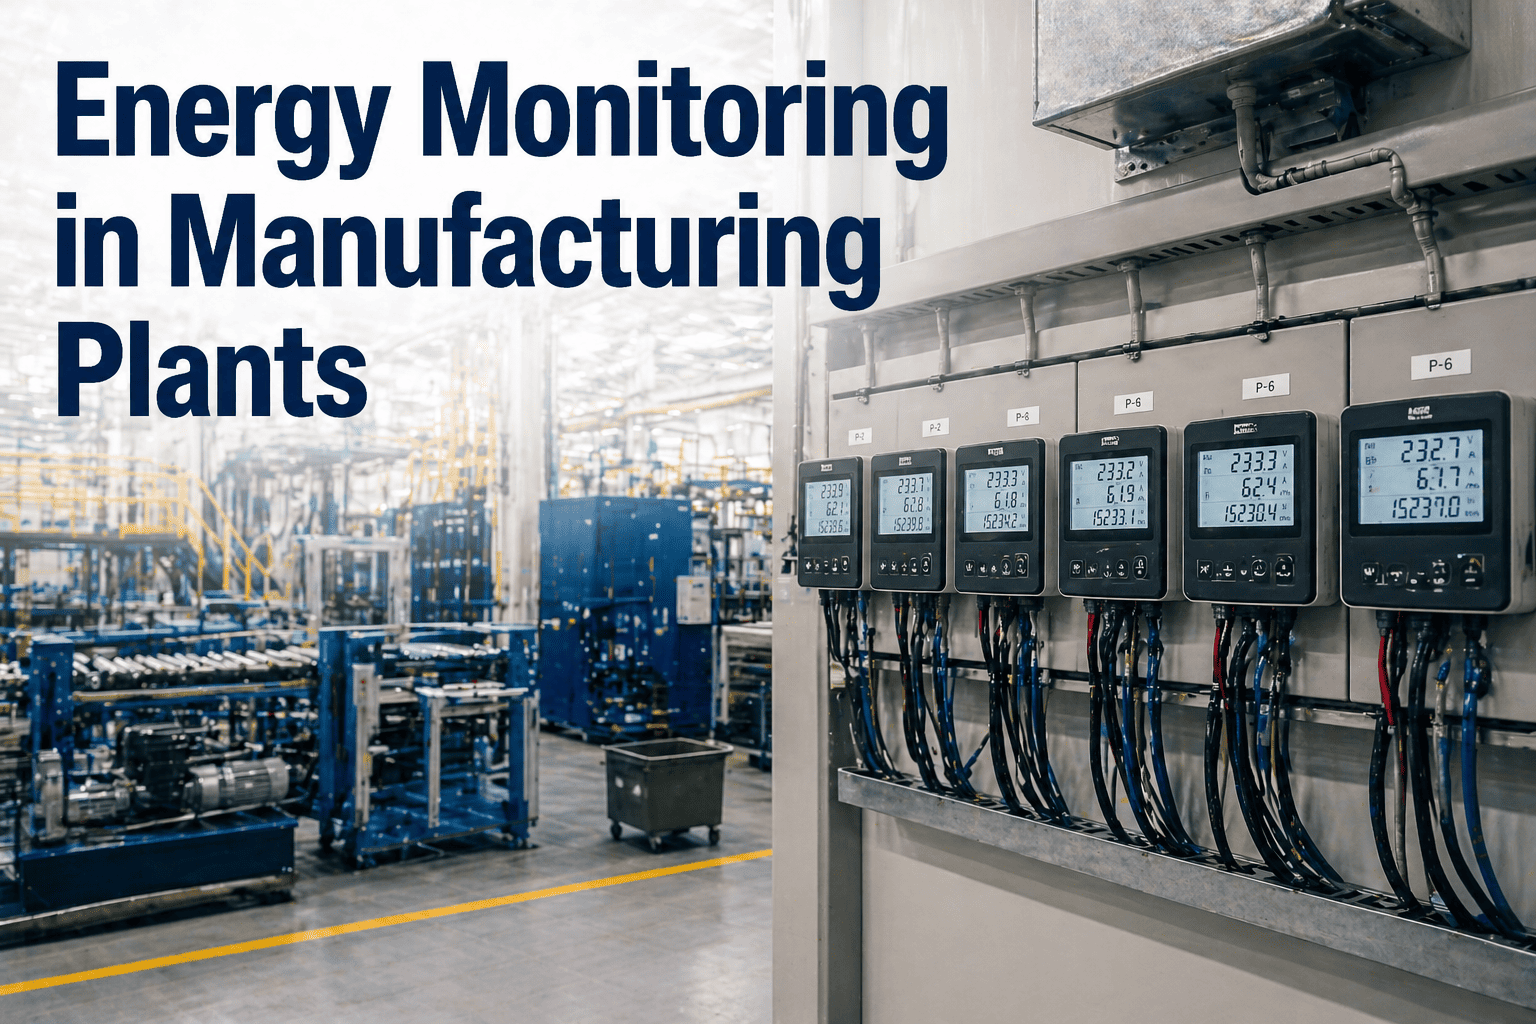
Energy monitoring in manufacturing plants through submetering and machine-level sensors delivers real-time visibility into consumption patterns by equipment, production line, and shift. Submeters installed on critical energy consumers (compressors, HVAC systems, large motors, furnaces, chillers) track power draw continuously, feeding data to energy analytics platforms that identify consumption anomalies, inefficient operating cycles, equipment degradation, and demand management opportunities. Industrial energy analytics correlates consumption with production output, identifying energy waste per unit produced and enabling targeted efficiency interventions. Most plants reduce energy costs by 12 to 18 percent through submetering deployment alone, with ROI within 12 to 18 months. Real-time dashboards and shift-based energy reports enable production teams to make equipment operation decisions based on energy awareness, creating behavioral efficiency gains beyond technical interventions.
Four Critical Energy Monitoring Challenges Manufacturing Plants Face
Manufacturing plants operate with complete visibility into production metrics yet almost total blindness regarding energy consumption. This mismatch creates predictable, quantifiable waste across all facility categories.
Monthly utility bills show total facility consumption but provide zero insight into which equipment consumes energy, when consumption peaks, or whether consumption patterns are efficient or wasteful. Production teams cannot correlate energy use with output. Maintenance cannot identify degrading equipment consuming excess power. Energy managers cannot locate leaks or inefficient cycles. A utility meter shows 50 kW average consumption without revealing that compressed air accounts for 18 kW, HVAC accounts for 16 kW, or that each production line's energy intensity varies by 40 percent depending on product and shift. Without machine-level submetering, energy efficiency improvements remain speculative.
Motors running continuously without load optimization consume 30 to 50 percent excess energy compared to optimally loaded equipment. Compressed air compressors leak 20 to 50 percent of generated air due to undetected failures in fittings and delivery lines. HVAC systems operate simultaneously in heating and cooling modes during schedule transitions, creating 5 to 10 kW of wasted energy per transition cycle. Chiller efficiency degrades 15 to 25 percent as refrigerant charge drops or heat exchanger fouling develops, but consumption patterns appear normal until catastrophic failure. Without submetering data, these inefficiencies remain invisible until energy consumption becomes obviously abnormal or equipment fails completely.
Day shift, night shift, and weekend operations run with identical equipment and settings regardless of production volume or energy efficiency targets. A production line running 50 percent capacity consumes 80 percent of full-capacity energy because equipment cannot adapt to reduced demand. Night shift operators make scheduling and equipment decisions without awareness of whether their choices increase or decrease facility energy consumption. Energy consumption per unit produced varies 20 to 40 percent between shifts due to operator behavior and equipment settings, but shifts remain unaware of their relative efficiency. Monthly energy reports show facility-wide trends invisible to production teams making real-time decisions.
MES systems track production volume, downtime, and defect rates independently from energy monitoring systems. No platform correlates energy consumption with production output, preventing calculation of energy intensity per unit. Energy managers cannot identify which product types require excess energy or which equipment configurations drive inefficiency. Production schedulers cannot make decisions based on energy efficiency. Cost accounting treats energy as facility overhead rather than a variable cost associated with specific production decisions. Without integrated energy-production visibility, optimization requires manual analysis across disconnected spreadsheets, delaying intervention and preventing real-time optimization.
See Energy Monitoring Transform Manufacturing Operations
Book a 30-minute demo showing machine-level energy monitoring, real-time submetering dashboards, and efficiency opportunity identification configured for your facility type.
How Energy Monitoring Works: Submetering, Sensors, and Analytics
Manufacturing energy monitoring integrates three core technology layers: hardware sensors and submeters measuring consumption, data platforms aggregating streams, and analytics software identifying inefficiency patterns and optimization opportunities.
Current transformers (CTs) and power quality meters installed at equipment circuits or main distribution points measure voltage, current, power factor, harmonic distortion, and real-time power consumption. Submeters cost $200 to $1,500 per installation depending on voltage level and sensor sophistication. Wireless submeters ($400 to $2,000) eliminate installation labor, enabling retrofitting of existing equipment without electrical modifications. Submeters sample at 10 to 100 Hz frequencies, capturing consumption patterns and anomalies invisible to slower measurements. Data transmits via hardwired networks (RS-485, Modbus TCP) or wireless protocols (Zigbee, LoRaWAN, cellular) to collection points.
Energy data from submeters and sensors streams continuously to historian platforms or edge computing devices that store high-resolution consumption data. Cloud-based or on-premise platforms ingest data from dozens to hundreds of submeters simultaneously. Compression algorithms reduce storage footprint by aggregating sub-second samples into 1-minute or 5-minute intervals while preserving anomaly detection capability. Historical data retention of 12 to 36 months enables year-over-year trend analysis and seasonal pattern identification. Integration with existing PLC, SCADA, and MES systems enables correlation of energy consumption with production events, equipment status, and shift operations.
Machine learning algorithms trained on historical consumption data identify baseline equipment signatures and detect deviations indicating inefficiency, degradation, or fault conditions. Consumption anomaly detection identifies when equipment consumes 10 to 20 percent more than historical baseline, triggering maintenance investigation. Energy intensity analytics correlate production volume with consumption, identifying energy cost per unit produced and trends. Peak demand analytics identify times and equipment combinations driving peak power consumption, enabling demand response or load shifting to reduce demand charges (typically 30 to 40 percent of industrial electricity costs). Comparison analytics benchmark equipment efficiency across similar units or facilities, identifying which line or shift operates most efficiently and enabling best-practice replication.
Energy monitoring platforms deliver real-time dashboards showing facility consumption, equipment-level breakdowns, and efficiency metrics updated every 5 to 15 minutes. Shift reports provided at shift handover show energy consumption during shift, per-unit energy intensity, major consumption events, and efficiency recommendations. Mobile applications enable operators and maintenance staff to view equipment-specific consumption and respond to anomalies in real-time. Integration with production scheduling systems enables energy optimization decisions during production planning—identifying whether high-demand products should be scheduled during off-peak utility rate periods, whether equipment should be pre-staged during low-demand time windows, or whether production sequence should be optimized for energy efficiency.
Energy monitoring platforms analyze utility bill data and rate structures, identifying demand charges (typically triggered by highest 15-minute consumption block during billing period) and time-of-use rates. Optimization algorithms recommend load shifting—scheduling high-energy equipment outside peak rate periods or peak demand windows. Demand response capabilities enable automated or manual load reduction during peak periods to reduce demand charges. Rate optimization identifies when to shift consumption to off-peak periods, reducing utility costs without reducing facility production. Over 12 to 36 months, demand response and rate optimization typically achieve 5 to 10 percent additional energy cost reduction beyond efficiency improvements.
Energy Monitoring by Equipment Category: Where Waste Occurs
Manufacturing facility energy consumption breaks into distinct equipment categories, each with specific efficiency challenges and submetering requirements. Understanding category-specific waste patterns enables targeted interventions.
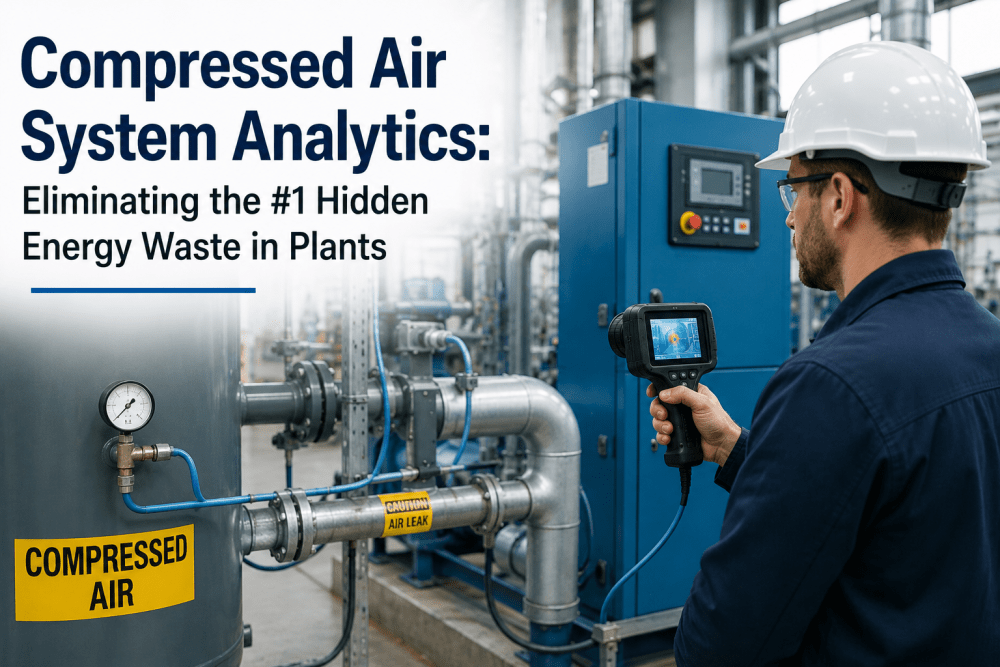
Compressed air ranks among the most inefficient energy systems in manufacturing, with 20 to 50 percent of generated air lost to leaks in fittings, hoses, and distribution lines. Undetected leaks waste thousands of dollars annually before system failure triggers repair. Compressor efficiency degrades 5 to 15 percent annually as intake filters clog and oil levels drop below optimal. Submetering measures discharge pressure and flow volume, identifying leaks (pressure drop without flow increase) and degradation (higher power draw for same flow). Installing submeters on compressor discharge and branch lines enables detection of major leaks within days rather than discovering them through catastrophic failures months later.
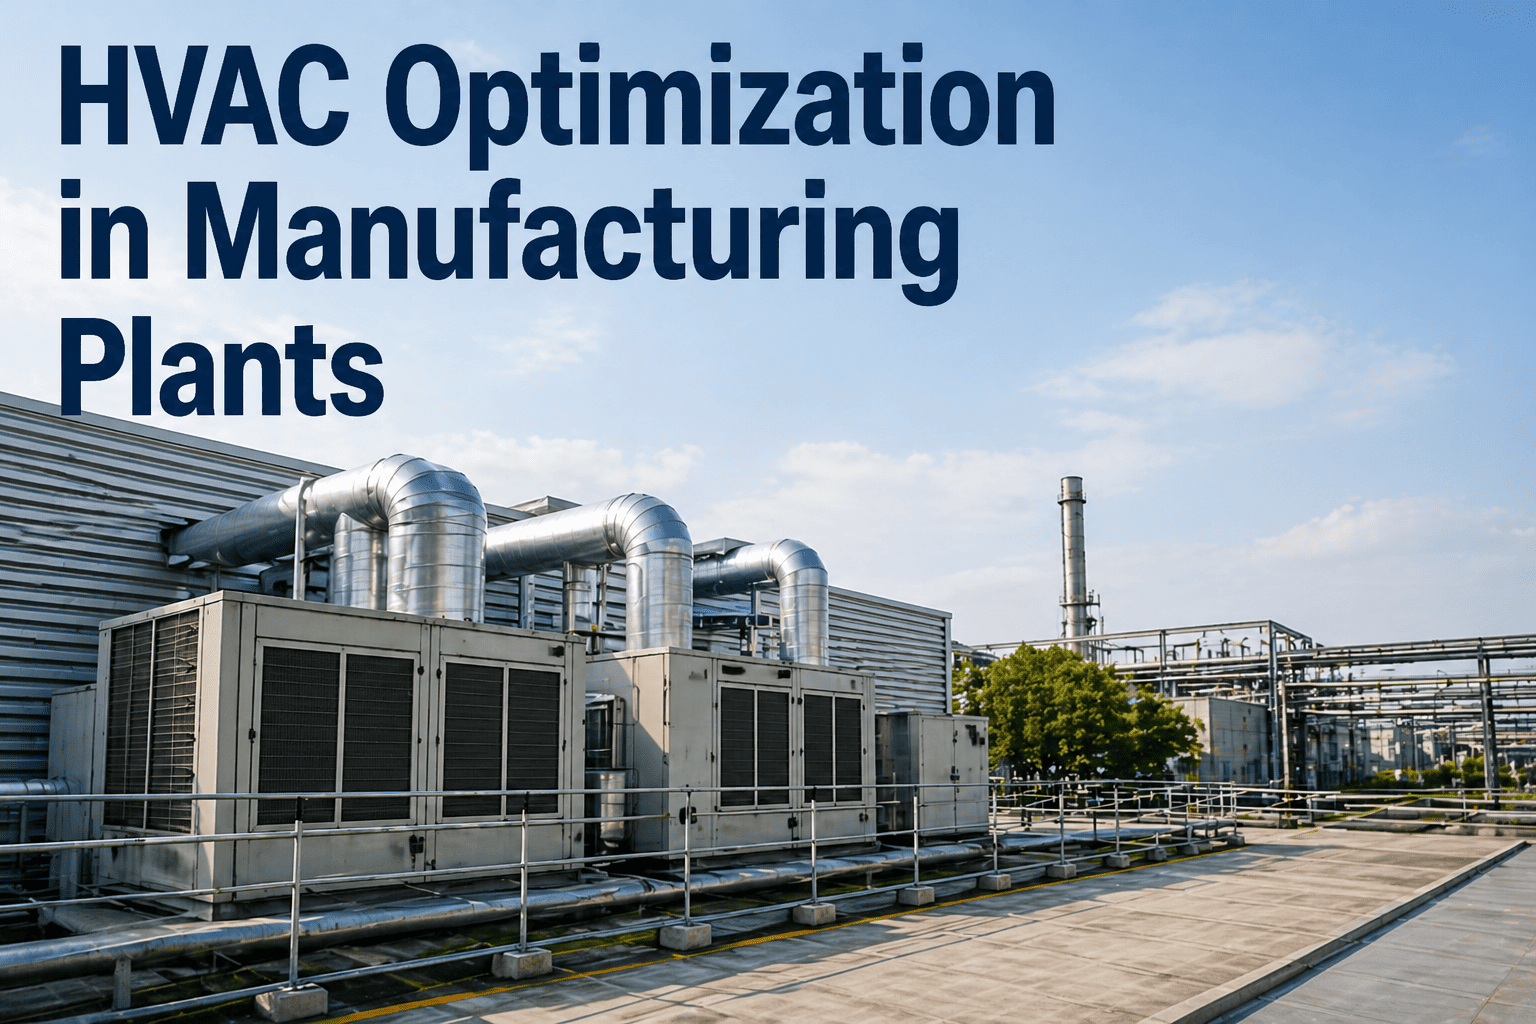
Heating and cooling systems operate on preset schedules regardless of occupancy, weather, or production requirements. Many facilities simultaneously heat and cool during shift transitions, creating 5 to 15 kW of wasted energy per transition. Thermostat setpoints often leave 3 to 5 degree deadbands (difference between heating trigger at 68F and cooling trigger at 73F) unnecessarily large. Boiler and chiller efficiency degrades 10 to 20 percent annually as sediment builds and heat exchanger fouling develops. Submetering on boiler and chiller circuits measures power draw and correlates with supply/return water temperatures, enabling identification of efficiency degradation and over-sized equipment. Supply air volume submetering identifies ductwork balance issues (some zones receiving 20+ percent excess air) wasting energy in over-supplied areas.
Motors consume the largest share of manufacturing facility energy. Standard motors operate at nearly constant speed regardless of load, wasting 15 to 30 percent energy when running partially loaded. Conveyor systems run continuously between production runs without load optimization. Fans and pumps often operate with fixed discharge or inlet restrictions, consuming excess energy against artificial resistance. Variable frequency drives (VFDs) can reduce motor consumption by 20 to 40 percent by modulating speed to actual load demand, but VFD effectiveness depends on continuous monitoring revealing actual load variations. Submetering on individual motor circuits identifies which motors run continuously without load and which equipment combinations produce demand peaks. Machine-specific submetering reveals that one production line consumes 40 percent more energy per unit than another identical line, enabling investigation of setup differences, material batch variations, or maintenance issues.
Facility lighting operates on fixed schedules or manual control, often running in unoccupied areas for hours daily. High-intensity discharge (HID) systems consume 150 to 400 watts per fixture versus 40 to 80 watts for equivalent LED output. Occupancy sensor integration can reduce lighting energy by 20 to 50 percent in intermittently-occupied spaces (offices, break areas, restrooms) and 5 to 15 percent in continuously-occupied production areas through daylight harvesting. Submetering on lighting circuits identifies which areas consume most energy and reveals whether lights operate when spaces are unoccupied. LED retrofit decisions prioritize high-utilization areas identified through submetering data, ensuring ROI focus on areas with greatest consumption.
Process equipment like industrial ovens, furnaces, washers, and plating tank heaters often operate at preset temperatures or cycles regardless of batch requirements. Temperature setpoints can often be reduced 5 to 10 degrees without affecting product quality, reducing energy consumption 8 to 15 percent. Cycle times can be optimized based on actual thermal properties rather than conservative standard times. Insulation degradation reduces heating efficiency 10 to 20 percent but remains invisible without consumption monitoring. Submetering on oven and furnace circuits measures power draw and enables correlation with actual batch processing, identifying opportunities to reduce temperature setpoints, optimize cycle times, or batch production to minimize idle heating time.
Uninterruptible power supplies (UPS) and battery backup systems consume 10 to 30 percent parasitic energy even in standby mode charging batteries that may never be discharged. Standby generators run monthly test cycles consuming fuel and wearing components. Emergency lighting and exit signs operate continuously consuming 5 to 10 kW facility-wide without contributing to production. Submetering on UPS and battery charger circuits identifies whether backup systems are oversized or unnecessarily consuming energy. Optimization can eliminate underutilized backup systems, consolidate redundant UPS units, or implement efficient power management modes reducing parasitic consumption by 30 to 50 percent.
ROI and Cost Savings: Energy Monitoring Implementation Economics
Energy monitoring deployments deliver ROI within 12 to 18 months through identified efficiency improvements, with typical mid-size manufacturing facilities recovering $120,000 to $300,000 annually in energy waste reduction.
30 to 50 submeters at $400 to $1,500 each = $12,000 to $75,000. Wireless submeters enable rapid deployment without electrical modifications, reducing installation labor to $2,000 to $5,000. Total hardware and installation: $14,000 to $80,000 depending on facility size and retrofit approach.
Energy monitoring platforms (cloud or on-premise) cost $200 to $500 monthly for small to medium facilities or $500 to $2,000 monthly for large multi-site portfolios. Annual software cost: $2,400 to $24,000. Integration with existing SCADA or MES adds $5,000 to $15,000 in professional services for first-time setup.
Compressed air leak detection and prevention: $15,000 to $40,000. HVAC optimization: $25,000 to $60,000. Motor and drive optimization: $30,000 to $80,000. Lighting efficiency: $10,000 to $25,000. Process equipment optimization: $20,000 to $50,000. Total annual savings: $100,000 to $255,000+ depending on facility size, baseline inefficiency, and intervention scope. Conservative mid-range estimate: $150,000 annual savings for typical 100,000+ sq ft facility.
Hardware and software cost: $16,400 to $119,000 depending on deployment approach. Annual savings: $100,000 to $255,000. Payback period: 9 to 18 months for typical facilities. Additional benefits not included in payback calculation: equipment lifespan extension through optimized operation, reduced maintenance through early anomaly detection, improved production scheduling through energy-aware planning.
Energy Monitoring Identifies Thousands in Annual Waste
Manufacturing plants implementing energy monitoring through submetering and analytics reduce energy costs by 12 to 18 percent within 12 months. The only question is how much waste exists at your facility waiting to be discovered and eliminated. Schedule an energy audit demo to quantify your facility's efficiency potential.
Submetering Strategies: Choosing Which Equipment to Monitor
Energy monitoring deployments scale from basic facility-level metering to comprehensive machine-level submetering. Strategic submeter placement maximizes cost-benefit and ROI.
Install submeters on equipment consuming 5 to 10 percent of facility energy individually: main compressor, primary HVAC units, largest production line motors, process furnaces. This tier typically requires 8 to 15 submeters at $400 to $800 each. Captures 50 to 70 percent of facility consumption with minimal hardware cost. Identifies largest waste sources quickly, enabling fast payback through targeted interventions. Ideal for facilities evaluating energy monitoring before broader deployment.
Install submeters on each major production line, department, or functional area (packaging line 1, packaging line 2, assembly, test, HVAC zone 1, compressed air distribution, lighting circuits). Requires 20 to 35 submeters. Enables tracking of energy intensity per production line, identifying which lines operate most efficiently and which require optimization. Supports shift-based energy awareness and production-energy correlation. Typical mid-size facility deployment approach balancing comprehensive visibility with reasonable cost.
Install submeters on individual equipment, major motors, compressor branch lines, HVAC zone dampers, and detailed process equipment. Requires 40 to 100+ submeters depending on facility complexity. Provides complete visibility into consumption patterns at granular level, enabling precise identification of inefficiency and degradation. Supports optimization of equipment scheduling and load balancing. Typically deployed after initial analysis reveals specific optimization opportunities justifying detailed monitoring. Wireless submeters reduce retrofit cost and installation disruption.
Deploy Tier-1 submeters first, identify largest waste sources and quick ROI opportunities, execute efficiency improvements, then deploy additional Tier-2 or Tier-3 submeters based on discovered opportunities. Spreads hardware investment across time, reducing upfront capital requirement. Enables prioritization of submeters based on identified waste rather than assumptions. Demonstrates energy monitoring value quickly, building organizational momentum for broader deployment. Most cost-effective approach for risk-averse organizations.
Real Manufacturing Results: Energy Monitoring Case Studies
These case studies reflect actual manufacturing facilities deploying energy monitoring and achieving documented energy cost reductions.
250,000 sq ft facility operating three stamping lines 24/7. Baseline energy consumption: 12 MW average, $1.4M annual cost. Deployed Tier-2 submetering (18 submeters on each stamping line, HVAC systems, compressed air). Analysis revealed compressed air system leaking 35 percent of generated air and stamping line #2 consuming 40 percent more energy per part than line #1. Leak repair cost $8,000, yielding $180K annual savings. Line #2 investigation identified worn hydraulic pump and calibration drift in pressure settings. Replacement and recalibration cost $35,000, yielding $280K annual energy reduction. Total annual savings: $460K (33% of compressed air and line energy, 22% of facility total). ROI on submetering and analysis: 4 months.
120,000 sq ft facility with three process zones requiring temperature control to specific ranges. Baseline energy consumption: 4.2 MW average. Deployed Tier-2 submetering on three separate HVAC zones plus boiler and chiller circuits. Analysis revealed two HVAC zones over-sized for actual load, running significant excess air continuously. Ductwork rebalancing and damper adjustment (no capital cost) reduced air volume 15 percent while maintaining temperature compliance. Boiler efficiency analysis revealed sediment buildup reducing heat exchanger effectiveness; chemical descaling improved efficiency 8 percent. Chiller optimization identified 3-degree deadband unnecessarily large; narrowing to 1 degree maintained temperature control with 12 percent less cooling energy. Total annual savings: $185K (18% of HVAC energy, 12% of facility total). ROI on submetering: 3 months.
180,000 sq ft facility with seven assembly lines and heavy conveyor infrastructure. Baseline energy consumption: 5.8 MW average, demand charges $240K annually (40 percent of electricity cost). Deployed Tier-2 submetering on each assembly line and major conveyor motor circuits. Analysis revealed demand peak during simultaneous startup of lines 1-4 at 6:00 AM shift change, triggering demand charges affecting all utility rates. Implementation of 15-minute load shifting (staggering line startups) reduced peak demand 18 percent, saving $43K annually in demand charges. Motor submetering identified conveyor line 5 running continuously without load between production runs; timer installation to shut off between runs saved $52K annually. VFD retrofit on three lines consuming partial load (validated through submetering) achieved average 22 percent energy reduction on those lines, saving $78K annually. Total annual savings: $173K. ROI on submetering and interventions: 8 months.
Shift-Based Energy Awareness: Making Energy a Production Decision Factor
Energy monitoring enables shift teams to make operations decisions based on energy awareness and cost implications, creating behavioral efficiency gains beyond technical interventions.
Providing each shift with energy consumption summary and per-unit energy intensity data at handover creates awareness of relative efficiency and competitive motivation for improvement. Visibility of which shift operates equipment most efficiently drives engagement in energy optimization.
Displaying current facility consumption and equipment-level breakdowns on production floor dashboards enables operators to see immediate impact of scheduling or operational decisions. Feedback loop between decision and result creates rapid learning and behavior modification.
Notification to production schedulers when utility rates approach peak thresholds enables delay of non-urgent equipment startup to off-peak periods. Behavior-based demand management achieves 5 to 10 percent demand reduction without capital investment or operational sacrifice.
Competitive visualization of which production lines or shifts operate most energy-efficiently drives engagement and motivates continuous improvement without formal incentives.
Frequently Asked Questions: Energy Monitoring in Manufacturing
Transform Manufacturing Energy Efficiency Through Visibility
Energy monitoring through submetering and analytics delivers 12 to 18 percent energy cost reduction within 12 to 18 months through visibility-driven optimization. The typical manufacturing facility wastes $120,000 to $300,000 annually in undetected energy inefficiency. Your facility's specific waste profile remains unknown until submetering reveals it. Schedule an energy audit to quantify your efficiency potential and identify quick-win interventions.
Energy Monitoring Features and Capabilities Comparison
Energy monitoring solutions vary in submeter precision, analytics depth, integration capability, and reporting comprehensiveness. Key differentiators enable faster ROI and deeper optimization.
| Capability | Basic Systems | Mid-Tier Platforms | Advanced Analytics |
|---|---|---|---|
| Submeter Precision | 15-minute interval sampling, 5 to 10 kW minimum detection | 5-minute interval, 1 to 2 kW minimum detection | 1-minute or better, <500W anomaly detection |
| Anomaly Detection | Threshold-based alerts (fixed upper limit) | Machine learning baselines with seasonal adjustment | AI-driven pattern recognition including multi-parameter correlation |
| Production Correlation | Manual export/correlation with separate systems | API integration with MES for energy intensity calculation | Real-time production-energy correlation with predictive scheduling optimization |
| Demand Response Integration | Manual alerts to operators during peak rate periods | Automated notifications with recommended load shifting | Automatic demand response with utility rate optimization |
| Shift-Based Reporting | Daily consolidated report, facility-wide metrics only | Shift-specific reports with line-level breakdowns | Real-time dashboards, per-unit energy intensity, shift leaderboards |
| Typical Annual Cost | $2,000 to $5,000 software + $8,000 to $20,000 hardware | $5,000 to $12,000 software + $15,000 to $40,000 hardware | $12,000 to $24,000 software + $25,000 to $80,000 hardware |
| Typical ROI Timeline | 18 to 24 months, reactive improvements only | 12 to 18 months, proactive optimization | 9 to 12 months, automated continuous optimization |
Regional Utility Rate Structures and Energy Monitoring Optimization
Manufacturing energy optimization strategies differ by region depending on utility rate structures. Demand response and time-of-use optimization are region-specific.
| Region | Typical Rate Structure | Energy Monitoring Opportunity |
|---|---|---|
| US Northeast / Midwest | Demand charges (40-50% of cost) + consumption charges + time-of-use rates with 3-5 peak periods | Peak demand reduction through load shifting yields 10-15% savings. Shift heavy equipment startup to off-peak periods. |
| US West Coast | Demand charges (30-35%) + steep time-of-use rates with up to 6 daily rate periods | Production scheduling during lowest-cost hours can achieve 8-12% savings independent of equipment efficiency improvements. |
| Europe | Demand charges (25-30%) + consumption + capacity charges. Industrial user taxes vary 15-25% by country. | Contract renegotiation based on monitored demand profiles can achieve 5-8% rate reduction. Energy intensity trending supports competitive bidding. |
| Asia Pacific | Time-of-use rates with 2-4 periods. Demand charges less common. Power factor penalties common. | Scheduling during off-peak hours yields 10-15% savings. Power factor correction through submetering-identified load balancing. |
Manufacturing Energy Efficiency Begins With Visibility
Energy monitoring through submetering and analytics delivers 12 to 18 percent energy cost reduction within 12 to 18 months through visibility-driven optimization. Your facility's specific efficiency opportunities remain unknown until monitored. Begin with a facility energy audit to identify quick-win improvements and quantify total savings potential.