Air Compressor Maintenance Checklist Manufacturing

By John Polus on May 2, 2026

air-compressor-analytics-checklist-manufacturing

Compressed air is the lifeblood of manufacturing operations, powering pneumatic tools, controls, and automated systems across assembly lines, stamping shops, and packaging facilities. Yet compressed air is also the most inefficient utility in manufacturing plants, with 20 to 30% of generated air lost to leaks, inefficient pressure regulation, and inadequate maintenance. A single 3mm leak in a plant with 100 psi supply costs $2,700 per year in wasted energy. A manufacturing plant with unmanaged compressed air system degradation can lose $50,000 to $150,000 annually in energy waste alone, before accounting for downtime from equipment failures and pressure drops that halt production lines. Book a demo to see how iFactory tracks air compressor performance and leak detection across your facility.

⚙️
Air Compressor Analytics and PM Checklist
Monitor compressor efficiency, detect leaks in real time, and prevent catastrophic failures. One platform for compressed air system reliability across your plant.

Why Compressed Air System Maintenance Matters

Compressed air systems in manufacturing plants typically operate continuously, delivering pressurized air to hundreds of pneumatic devices across multiple production areas. Unlike electrical or steam systems with visible consumption data, compressed air consumption is largely invisible. A poorly maintained system delivers the required volume and pressure to operators and equipment, but at continuously rising energy cost because the system must work harder to overcome leaks, heat losses, and pressure drop from dirty or undersized filtration.

The core maintenance challenge is that compressor failure modes develop gradually and are often masked by operator workarounds. When pressure drops 5 psi below specification, operators increase the compressor setpoint by 5 psi to restore performance. This adds 5-7% more energy consumption per 1 psi pressure increase. When filter element becomes saturated, pressure drop increases and the compressor unloads less frequently, running longer. When cooler fouling restricts heat transfer, discharge temperature rises and the compressor must run longer to move the same volume. Each of these degradation modes is individually invisible but collectively compound into a system that is consuming 30-40% more energy than design specification while delivering equivalent nominal performance.

The Air Compressor Problem: Hidden Energy Waste and Reliability Risk

20-30% Energy Waste from Unmanaged Leaks

A 3mm leak wastes $2,700 per year in energy cost. A plant with multiple small leaks and no systematic detection program can easily waste $50,000-$150,000 annually. Most plants have no baseline understanding of actual leak volume.

5-7% Energy Increase Per 1 PSI Setpoint Increase

When operators increase compressor pressure to compensate for pressure drop from dirty filters or undersized lines, they trigger exponential energy increases. A 10 psi increase for system convenience costs $30,000-$50,000 per year in extra energy.

Pressure Drop Cascades Across Production Lines

A single point of high pressure drop downstream of the compressor affects all equipment fed from that branch. Pneumatic tool performance degrades, cycle times increase, and production throughput suffers silently until pressure drop is severe enough to trigger visible slowdowns.

Catastrophic Compressor Failure from Lack of Preventive Maintenance

A compressor running continuously with degraded cooling, contaminated oil, and unmanaged pressure spikes can fail suddenly with no warning. An unplanned compressor failure halts all pneumatic systems simultaneously, costing $150,000-$300,000 in emergency repair and lost production.

Water Contamination in Compressed Air Lines

Moisture in compressed air corrodes pneumatic tools and shortens actuator life. Water in air lines can freeze in regulators during cold weather, creating sudden pressure drops. Most plants have no active condensate management strategy.

Unmanaged Peak Load Spikes Trigger Auxiliary Compressor Activation

When production lines ramp demand rapidly, pressure drops temporarily and backup compressors activate. If the primary compressor is degraded and cannot respond quickly, peak demand periods trigger frequent auxiliary compressor starts, wasting energy and accelerating primary compressor wear.

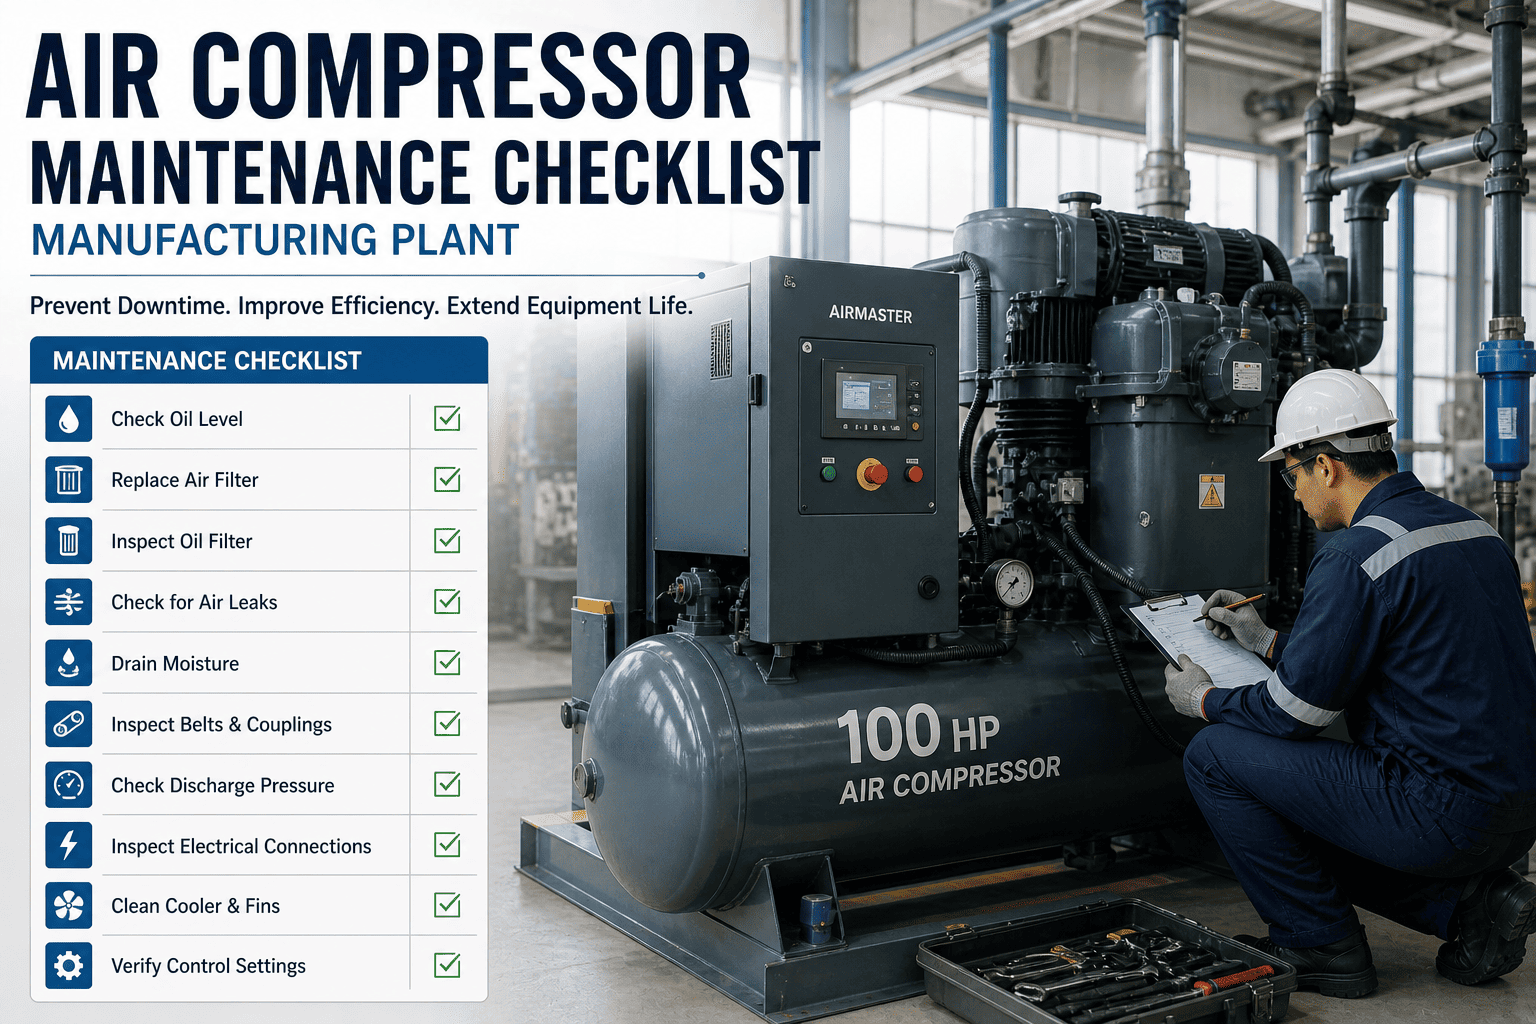
The Complete Air Compressor Maintenance Checklist

A structured air compressor PM program tracks three maintenance dimensions simultaneously: compressor unit condition (oil, temperature, vibration), system efficiency (pressure regulation, energy consumption, leaks), and downstream air quality (moisture, particulate, pressure stability). This checklist covers all three with specific inspection intervals and success criteria.

Section 1: Compressor Unit Condition Monitoring

Daily Compressor Checks
Discharge Pressure Reading — Log actual pressure at compressor discharge. Standard target is 100-105 psi. If pressure drifts above 110 psi, investigate unload valve function and downstream pressure regulation. Check Daily
Oil Level Visual Inspection — Check oil sight glass. Level should be at mid-mark. Low oil indicates possible leak or excessive consumption from worn screw elements. Top off only with OEM-specified compressor oil. Check Daily
Discharge Temperature Check — Monitor discharge air temperature if thermometer is installed. Normal range is 150-180°F. Temperature above 190°F indicates fouled cooler, restricted oil circulation, or worn compressor elements requiring immediate investigation. Check Daily
Audible Noise Assessment — Listen for abnormal grinding, squealing, or knocking sounds. New sounds may indicate bearing wear, belt misalignment, or internal screw element damage. Record and investigate immediately. Check Daily
Compressor Run/Unload Cycling — Observe compressor load/unload sequence. Normal operation has compressor reaching full load pressure, then unloading to idle (pressure drops to ~20 psi below setpoint) when demand reduces. If unload valve sticks in load position, compressor runs continuously wasting energy. Check Daily
Vibration Assessment — Place hand on compressor frame to assess vibration level. Excessive vibration may indicate bearing wear, foundation bolt looseness, or internal damage. Compare vibration level to baseline from prior month to identify trends. Check Daily/Weekly
Weekly Compressor PM Tasks
Cooler External Surface Cleaning — Inspect cooler fins for dust and debris accumulation. If cooler surface is visibly blocked, use compressed air or soft brush to clean exterior fins. Fouled cooler increases discharge temperature and energy consumption by 10-15%. Check Weekly
Air Intake Filter Visual Check — Inspect intake filter element through sight glass if equipped. If element appears dark or restricted, change filter immediately. Clogged intake filter reduces compressor capacity and increases power draw. Check Weekly
Condensate Trap Drain Check — If compressor discharge air has cooler and aftercooler, check condensate drain traps. Manual drain valves should be opened for 3-5 seconds to evacuate accumulated water. Automatic float traps should remain clean and free of debris. Check Weekly
Foundation Bolt Tightness — Check compressor mounting bolts for tightness. Vibration can loosen bolts over time, increasing noise and vibration. All bolts should be snug but not over-torqued. Check Weekly
Pressure Gauge Calibration Check — Compare compressor discharge pressure gauge reading against a secondary reference pressure gauge. Gauge accuracy of +/- 2 psi is required for proper pressure regulation. If gauge reads >5 psi off, replace it immediately. Check Weekly
Monthly Compressor Maintenance
Oil Change and Sampling — If compressor has not been serviced per OEM interval, change oil at monthly minimum if unit runs continuously. Collect used oil sample for analysis if available. Dark or metallic-smelling oil indicates internal wear. Check Monthly
Air Filter Element Replacement — Replace intake air filter element per OEM recommendation or when pressure differential across filter exceeds specification (typically 3-5 psi). Log hours and filter part number in maintenance records. Check Monthly
Separator Element Condition Inspection — If compressor has oil separator element, inspect for oil carryover. Excessive oil mist in discharge air indicates separator element failure requiring replacement. Oil in downstream air damages pneumatic tools. Check Monthly
Minimum Pressure Relief Valve Test — Compressor unload valve maintains pressure at ~20 psi below load setpoint when idle. Test by observing pressure drop when load is removed. If pressure does not drop within 5 psi, unload valve may be stuck and requires cleaning or replacement. Check Monthly
Air Line Pressure Drop Survey — Using a secondary pressure gauge, measure pressure at several points downstream of the compressor (main header, branch lines to production areas). Pressure drop should be minimal (typically <3 psi from compressor discharge to furthest equipment). Excessive drop indicates undersized piping or partial blockage. Check Monthly
Belt Drive Inspection — For belt-driven compressors, check belt tension and alignment. Belt should have 0.5 inch deflection when pressed mid-span. Frayed or damaged belts require replacement. Misaligned belts indicate pulley misalignment requiring correction. Check Monthly

Section 2: Compressed Air System Leak Detection

Leak Detection and Quantification

Air leaks are the primary efficiency loss in manufacturing compressed air systems. A single 3mm leak in a 100 psi system costs $2,700 per year. Leaks compound: a plant with 5-10 small leaks can waste $15,000-$30,000 annually without awareness.

Acoustic Leak Detection Walk-Through — During non-production hours or at reduced load, walk the facility with compressed air system in operation. Listen carefully for hissing sounds indicating air leaks. Mark any suspected leak locations. Common leak sources: connection point fittings, disconnected hose ends, worn hose sections, stuck open solenoid valves, damaged regulator seals. Check Monthly
Soap Bubble Leak Confirmation — Apply soapy water solution to suspected leak locations. Bubbling indicates active leak. Mark all confirmed leaks with temporary tape. Quantify leak severity by counting bubble rate (fast/medium/slow) to prioritize repair sequence. Check Monthly
Connection Point Inspection — Compress air header connections are high-stress points. Inspect all ball valve connections, regulator inlet fittings, and pressure gauge taps for seeping or dripping. Weeping connections can be tightened 1/4 turn. If still leaking after one quarter turn, disconnect and re-seal with PTFE thread tape. Check Monthly
Hose Assembly Condition Assessment — Walk all compressed air hose runs. Look for visible damage (cracks, swelling, abrasion), kinks, or improper support causing strain at connections. Crimped fittings under stress will fail under vibration. Replace any hose showing signs of wear before failure occurs. Check Monthly
Solenoid Valve Seating Check — Pneumatic solenoid valves that remain partially open waste air through exhaust ports. Energize solenoid (if safe to do during operation) and listen for air escaping exhaust. If solenoid does not fully seat, it requires replacement or cleaning. Check Monthly

Section 3: Air Quality and System Efficiency

Compressed Air Quality Monitoring
Moisture Content Assessment — Compressed air quality deteriorates when moisture is not removed. Indicator: if pneumatic tools suffer rust or corrosion, water is present in discharge air. Install desiccant dryer if not present. If dryer is present, check desiccant color indicator. Blue desiccant is dry; pink indicates saturation and requires desiccant replacement. Check Monthly
Particulate Contamination Check — Disconnect a small portable air hose at a branch outlet and listen/feel for particulate discharge. Fine black particles or visible dust indicate aftercooler or filter element failure allowing dirt to pass downstream. Dirty air damages pneumatic actuators and shortens tool life. Check Monthly
Desiccant Dryer Performance — If desiccant dryer is installed, verify discharge pressure (typically 2-5 psi below unfiltered air). Excessive pressure drop indicates dryer cartridge saturation. Monitor desiccant color indicator for regeneration cycle timing. Heating element should cycle periodically to regenerate desiccant. Check Monthly
Pressure Regulation Setpoint Audit — Check all pressure regulators serving production equipment. Verify setpoint matches equipment specification. Over-pressurization increases energy consumption and shortens component life. If multiple regulators are set above specification, investigate root cause (inadequate compressor sizing, excessive demand, or incorrect setup). Check Monthly

Compressor Efficiency Analytics: KPI Results

28%
Average energy consumption reduction from systematic leak detection and repair
$65,000
Average annual savings per 100hp compressor from preventive maintenance program
42%
Reduction in unplanned compressor downtime with structured PM
3.2x
ROI within 18 months from energy savings alone on a typical facility

Real Use Cases: Air Compressor Efficiency Improvements

Case 1: Leak Detection Reduced Energy Cost by $38,000 Annually

Impact: 22% total energy consumption reduction

A mid-sized automotive supplier with a 150 hp compressor was spending $180,000 annually on compressed air energy. A structured leak detection program identified 12 leaks totaling an estimated 35 CFM loss at 100 psi (nearly 8% of compressor output). Repairs included: replacement of 4 worn hose assemblies, sealing 6 connection points with thread tape, and replacement of one stuck solenoid exhaust valve. Total repair cost: $1,200. Annual savings: $38,000.

Case 2: Pressure Optimization Saved $22,000 and Improved Production

Impact: 13% energy reduction + faster cycle times

A packaging line was operating at 115 psi system pressure to overcome 15 psi pressure drop in an undersized distribution header. Operators had increased the compressor setpoint incrementally over years as demand grew. A system pressure survey revealed the header problem. After replacing the distribution header and optimizing regulator setpoints, system operated at 105 psi with no pressure drop affecting equipment. Energy consumption dropped 13% immediately. Production cycle time improved 3% from more consistent pressure to pneumatic actuators.

Case 3: Preventive Maintenance Avoided $280,000 Emergency Compressor Replacement

Impact: Continuous production, $280K emergency cost avoided

A primary compressor suffered bearing degradation that went undetected until catastrophic failure occurred during full production. Replacement compressor required emergency procurement ($45K), overnight freight ($12K), emergency installation labor ($28K), and 18 hours of production shutdown across all pneumatic systems ($195K lost production). Total crisis cost: $280K. A structured vibration monitoring program would have detected bearing wear 6 weeks earlier, enabling planned weekend replacement at $35K cost.

Air Compressor PM Implementation: 8-Week Timeline

Weeks 1-2
System Audit and Baseline
Document all compressors, receivers, dryers, and distribution piping. Create pressure map showing pressure at key points. Establish energy baseline by reviewing electric bills.
Weeks 3-4
Leak Detection and Repair
Conduct comprehensive leak audit. Identify and prioritize all leaks. Begin repair sequence starting with largest leaks. Document each repair location and estimated CFM saved.
Weeks 5-6
Pressure Optimization
Survey pressure at all production equipment. Identify over-pressurized areas. Adjust regulator setpoints to match equipment specifications. Validate pressure stability across all branches.
Weeks 7-8
PM Schedule Establishment and Staff Training
Document daily, weekly, and monthly PM tasks. Assign responsibilities. Train maintenance staff on checklist procedures. Establish baseline for ongoing energy tracking.

How iFactory Solves Air Compressor Maintenance

Real-Time Compressor Performance Monitoring

iFactory integrates with compressor controllers to track discharge pressure, temperature, run time, and load/unload cycles in real time. Performance trends reveal degradation before failure occurs. Pressure setpoint changes are logged and correlated with energy consumption changes.

Energy Consumption Analytics

Track compressor power draw and correlate with production demand and system pressure. Identify the energy impact of leaks, pressure increases, and equipment changes. Compare actual energy consumption to baseline to quantify savings from each repair or optimization.

Leak Detection and Tracking

Log detected leaks with location, severity rating, and repair status. Track which leaks have been repaired and verify energy consumption improvement post-repair. Prevent new leaks from developing by trending pressure stability across distribution piping.

Maintenance Task Automation

Configure PM schedule for all compressors. Daily checks, weekly tasks, and monthly audits are automatically scheduled and assigned to maintenance staff. Completion tracking ensures no PM windows are missed.

Pressure Regulation Monitoring

Track setpoint changes across all regulators. Alert when pressure is increased beyond specification. Correlate regulator setpoint increases with energy consumption increases to quantify the energy cost of pressure changes.

Compressor Reliability Predictions

Monitor bearing temperature, oil condition, vibration trends, and discharge temperature. Predict remaining useful life of critical components. Schedule preventive replacement during planned downtime rather than responding to failures.

Monitor Your Compressed Air System with iFactory

Real-time energy analytics, leak detection, and pressure optimization in one platform. Reduce energy waste by 20-30% and prevent catastrophic compressor failures.

Frequently Asked Questions

How much does a 3mm leak cost annually?
A 3mm leak in a 100 psi system costs approximately $2,700 per year in wasted energy. Larger leaks scale proportionally: a 5mm leak costs $7,500 annually. Most plants have multiple small leaks that compound into $50,000-$150,000 annual energy waste. Book a demo to quantify leaks in your facility.
What is normal pressure drop across a compressed air system?
Pressure drop from compressor discharge to furthest equipment should not exceed 3 psi. Pressure drop above 5 psi indicates undersized piping, clogged filters, or partial blockages. Every 1 psi of pressure drop requires 0.5-0.7% additional compressor energy to maintain supply pressure. Optimize pressure distribution to reduce energy consumption.
How often should compressor oil be changed?
For continuously running compressors, oil should be changed every 500 operating hours or monthly, whichever comes first. More frequent changes are justified for compressors running 24/7 in dusty environments. Track oil condition with sampling to identify when change is truly needed. Dark, metallic-smelling oil indicates internal wear and requires immediate investigation. Contact support for guidance on your compressor type.
What pressure should I run my compressed air system at?
Run at the lowest pressure that meets all equipment requirements. Most pneumatic tools require 90-100 psi. Running at 110-120 psi wastes 7-14% energy per 10 psi of excess pressure. Audit all equipment to determine actual pressure requirement, then set system pressure to minimum value plus 5 psi margin for pressure drop.
How does moisture damage compressed air systems?
Water in compressed air corrodes pneumatic tools, rusts control valve internals, and shortens actuator seal life. Water pooling in air lines can freeze in regulators during cold weather, creating sudden pressure drops. Most plants should install desiccant or refrigerated dryers to remove moisture. Start a free trial to track air quality with iFactory.
Can iFactory integrate with existing compressed air systems?
Yes. iFactory connects to most compressor controllers via standard interfaces. We can also implement standalone pressure and temperature monitoring via retrofit sensors. No replacement of existing equipment required. Integration takes 2-4 weeks for typical facility.

Final: Start Your Compressed Air Optimization Program

Reduce Energy Waste and Prevent Compressor Failures

Structured air compressor maintenance and real-time efficiency monitoring reduces energy consumption by 20-30% while preventing catastrophic failures. ROI in 18 months from energy savings alone.

Leak Detection Analytics Energy Consumption Tracking Pressure Optimization PM Automation Compressor Reliability Monitoring

Share This Story, Choose Your Platform!